
In today’s data-driven business environment, organizations demand reliable and stable business insights to make informed decisions. To cater to this demand, over 60% of companies turn to data warehouses (DWs) to store, manage, and analyze their data efficiently. The success of these DW implementations depends on dimensional data modeling – an analytical approach that organizes and categorizes data for efficient analysis and querying.
Dimensional data modeling utilizes fact and dimension tables to store and retrieve big data quickly from a data warehouse. These processes efficiently organize relevant data while separating inconsequential data, making queries performant.

Moreover, dimensional modeling processes help uncover critical terminology and views that Data Governance needs to gain agreement on and support. Understanding the fundamentals of dimensional data modeling – what it is, why to use it, and how to create it – plays a key role in getting the most from this technique.
What Is a Dimensional Model?
Dimensional modeling organizes data in a DW to optimize querying and analysis. It first appeared in Ralph Kimball’s 1996 book, The Data Warehouse Toolkit.
Dimensional modeling focuses its diagramming on facts and dimensions:
- Facts contain crucial quantitative data to track business processes. Examples of these metrics include sales figures or number of subscriptions.
- Dimensions contain referential pieces of information. Examples of dimensions include customer name, price, date, or location.
Keeping the dimensions separate from facts makes it easier for analysts to slice-and-dice and filter data to align with the relevant context underlying a business problem. Data modelers organize these facts and descriptive dimensions into separate tables within the data warehouse, aligning them with the different subject areas and business processes.
Why Use a Dimensional Model?
Dimensional modeling provides a basis for meaningful analytics gathered from a data warehouse for many reasons. Its processes lead to standardizing dimensions through presenting the data blueprint intuitively.
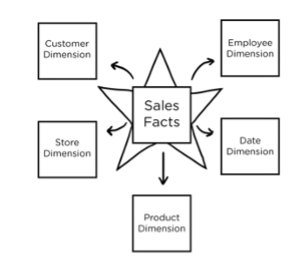
For example, the diagram below frames data around sales facts, critical metrics for any business. The dimensions, such as “customer,” make sense across the company’s business units.
Additionally, dimensional data modeling proves to be flexible as business needs evolve. The data warehouse updates technology according to the concept of slowly changing dimensions (SCD) as business contexts emerge.
In SCD, technology stores and manages current and historical data in the DW. As technology implements its changes, analysts can continue business as usual by running their queries. The clear dimensional model makes this update a success and ensures organizations continue to get reliable insights.
Designing a Dimensional Model
Designing a dimensional model to get needed business insights requires collaboration. Key to dimensional data modeling processes are interactions and agreement among business units across an organization.
These discussions result in four decisions that inform the implementation of the dimensional model. This article discusses each process and outcome.
Select Business Process
Selecting the business process sets the stage for how all the organizational data will be collected and organized, searched, and used. Any dimensional modeling must have clarity around all the work activities needed to solve business problems.
To meet this need, high-level managers need to support the effort to gather business requirements and understand existing data roles, processes, and technologies, with a holistic end-to-end view of operations. Examples of business processes are subscriptions, customers, profit, sales, organizations, etc.
When discussing which business processes to use in dimensional modeling, representatives from each team talk about their core key performance indicators (KPI) and metrics. This information will ground conversations about the facts, which are the core concepts of the data warehouse.
Dimensional modelers will need to figure out any intermediary steps that will impact DW design, like existing Data Quality, along with KPIs. Technical experts with a data maturity assessment can provide an understanding of these realities before going to the next step.
Declare the Grain
After defining the business process, organizations work on declaring a common grain. It is the lowest level of detail or measurement for the business process. For example, if executives want to know the number of subscriptions sold per month per customer, then they want a grain of the “subscription sale information by month per customer.”
Some teams think that this value is self-evident and either skip or spend less time on this step. They do so to their detriment, introducing design errors and failing to establish what facts and dimensions represent.
Skipping the grain leads to complexity and poor Data Quality. Analysts scratch their heads wondering what is meant in a report.
To mitigate this issue, Data Governance comes in handy. It uncovers and resolves business needs among departments, which likely have different perspectives on the grain. Alignment is critical as every possible dimensional modeling component needs to be consistent with this grain declaration.
Identify the Dimension Tables
Dimension tables are known and used by certain business units and need to be made consistent with the grain. This information identifies the dimension tables, which comprise who, what, where, and when.
The columns in the dimensional table comprise the attributes. For example, a customer dimension table may contain entries for customer ID, first name, last name, cell phone, email, location, etc.
Each dimension table plays an important role in directing how a data warehouse stores and retrieves contextual data. It also has a key or ID that connects to the fact table.
Identify the Fact Tables
Facts tables come from business processes, organizational operations such as taking an order or processing a purchase. They help the users read, summarize, and analyze numeric values, like balances, counts, and weights, and are captured by the columns.
Keys connect the fact table with dimension tables. For example, a sales fact will likely connect to the customer dimension through a “Customer ID.”
Importantly, a fact models the actual business event at the level of its granularity, not necessarily the reporting fields. If the grain is “subscription sale information by month per customer,” then calling up customer representatives who made the sales would be disallowed.
This would be the case even if the Marketing Department wanted it in its report for performance evaluations. Here we see another reason to get agreement about the grain with the help of Data Governance.
Implementing a Dimensional Model
Once an organization agrees to the dimensional model design and its four components, a data modeler translates it into a blueprint. Typically, this dimensional model may represent a sub-section of the total DW architecture. The modeler will either use a star or snowflake schema.
Star Schema
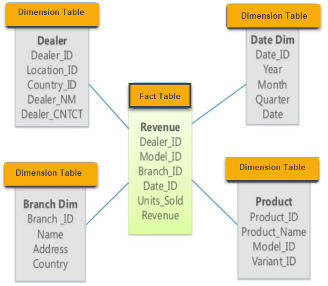
A star schema depicts the fact table in the middle. The dimension tables represent the points of the star. Relationships radiate from the foreign-primary keys – from facts to the dimension tables. The example below shows a revenue fact connected by dealer, branch, date, and product dimensions.
Dimension modelers prefer star schemas because they are easier to apply when developing or updating data warehouse components.
Snowflake Schema
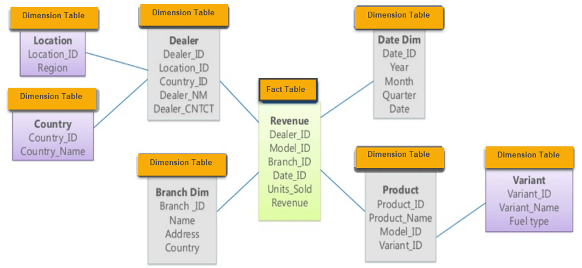
A snowflake schema provides more information about the dimensions and their attributes. For example, a company may employ dealers in different countries and regions across the world.
A snowflake schema will clarify each of these attributes that characterize the dealer’s dimension. See the example below:
Multidimensions and Cube Processing
Sometimes companies need multiple facts within their data warehouses to get business insights. So, modelers use a multidimensional approach and organize the dimensional components into a cube.
This cube considers different business roles in the data warehouse. For example, an enterprise has regional offices in Boston, New York, and Dallas that want customized sales reports. Then a modeler may put a number of sales in a cell, defined by the attributes and dimensions around it.

A cube provides a view of the entire data warehouse structure by including all the substructures.
Conclusion
Dimensional data modeling promises quick access to business insights when searching a data warehouse. Modelers provide a template to guide business conversations across various teams by selecting the business process, defining the grain, and identifying the dimensions and fact tables.
Alignment in the design requires these processes, and Data Governance plays an integral role in getting there. Once the organization is on the same page about the dimensional model’s design, it chooses the best kind of implementation.
Implementation choices include the star or snowflake schema around a fact. When organizations have multiple facts and dimensions, they use a cube. A dimensional model defines how technology needs to build a data warehouse architecture or one of its components using good design and implementation.
As the business evolves, technology can update the data warehouse, using SCD. This flexibility along with the DW structure increases the likelihood that analysts get business information with the quality and speed they need.
- SEO Powered Content & PR Distribution. Get Amplified Today.
- PlatoData.Network Vertical Generative Ai. Empower Yourself. Access Here.
- PlatoAiStream. Web3 Intelligence. Knowledge Amplified. Access Here.
- PlatoESG. Carbon, CleanTech, Energy, Environment, Solar, Waste Management. Access Here.
- PlatoHealth. Biotech and Clinical Trials Intelligence. Access Here.
- Source: https://www.dataversity.net/fundamentals-of-dimensional-data-modeling/

