Heterogeneous fibroblasts contribute to lizard tail regrowth
To investigate the complexity and heterogeneity of each regeneration state during tail regrowth, we performed single-cell RNA sequencing (scRNAseq) on staged tail samples of the green anole lizard, Anolis carolinensis. Utilizing the 10x Genomics scRNAseq platform, tail samples were divided into one of the four following sample groups: original tail (0 day post-amputation, DPA), inflammatory stage (1, 3, and 7 DPA), blastema stage (14 and 21 DPA), or regenerated homeostasis (28 DPA). Inflammatory and blastema stage samples included multiple sample time points to ensure consistency among sample groups considering inherent variability in tail regeneration between individuals41. In addition to tracking sample DPA, samples were assessed for morphology and characteristic regeneration stage phenotypes42, resulting in multiple time points utilized in inflammatory and blastema stages (detailed phenotypes/morphologies for each tail stage are described in Methods). Sequencing results were analyzed using the 10x Genomics Cell Ranger43 pipeline and R packages Seurat44 and Harmony45.
Unsupervised UMAP clustering of the regeneration time course revealed 14 distinct cell clusters (Fig. 1a). Clusters were analyzed for top differentially expressed genes, and key cell types were validated via in situ hybridization (ISH) and histology for corresponding tissue gene expression in regenerating tail samples (Supplementary Fig. 1). Several clusters of immune and blood cells were identified including cathepsin B (ctsb+) macrophages9, clusters delineated by high levels of CD8 subunit A (cd8a+) and CD8 subunit B (cd8b+) expression and nucleated red blood cells. Keratin type II cytoskeletal 5 (krt5+) epithelial cells, von Willebrand factor (vwf+) endothelial cells, fatty acid binding protein 7 (fabp7+) ependymal cells46, cycling cells characterized by high marker of proliferation Ki-67 (mki67) expression, creatine kinase M-type (ckm+) muscle-related cells15, premelanosome protein (pmel+) melanocytes, SRY-box transcription factor 9 (sox9+) chondrocytes47, and collagen type I alpha 1 chain (col1a1+) fibroblastic connective tissue cell (FCTC) clusters were also identified through differential gene expression analysis and mammalian ortholog identification.
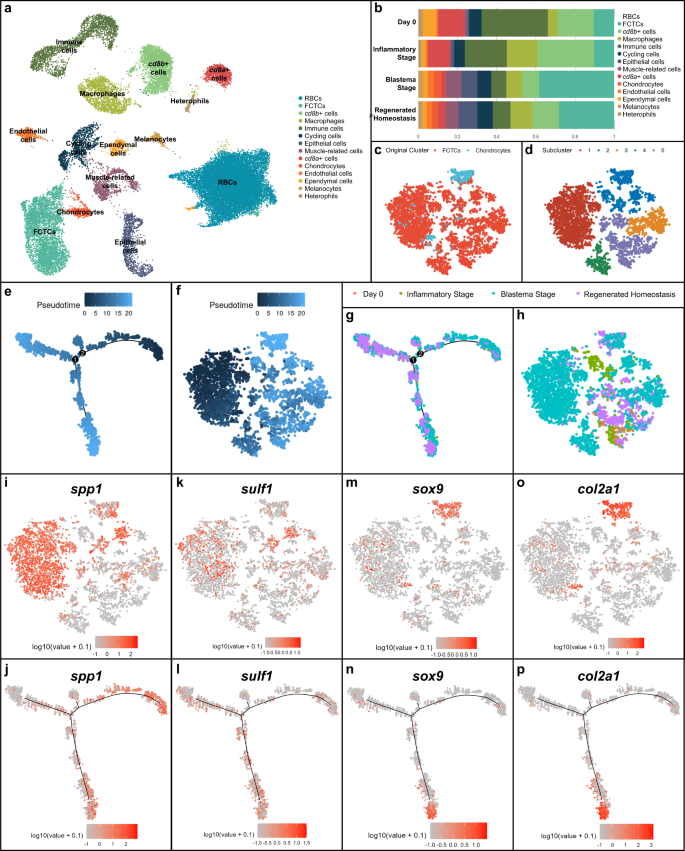
a UMAP of unsupervised clustering of single-cell RNA-sequencing (scRNAseq) results for lizard (Anolis carolinensis) tail regeneration time course comprised of uninjured day 0 lizard tail (0 days post-amputation or DPA), inflammatory stage (1, 3, and 7 DPA), blastema stage (14 and 21 DPA) and regenerated homeostasis (28 DPA) samples. b Quantification of relative cell type composition proportions per tail sample stage, excluding red blood cells. c TSNE of fibroblastic connective tissue cells (FCTCs) and chondrocytes isolated, integrated, and subclustered from scRNAseq dataset in (a). d TSNE of unsupervised clustering of FCTCs and chondrocyte cell subset. e Monocle2 pseudotime trajectory analysis for FCTCs and chondrocyte scRNAseq cell subset from (c). f Pseudotime overlayed onto TSNE FCTC/chondrocyte cell subcluster. g Regeneration time point overlayed on pseudotime trajectory for FCTC/chondrocyte subset. h FCTC/chondrocyte TSNE analyzed by regeneration time point. i, j Spp1, k, l sulf1, m, n sox9, and o, p col2a1 gene expression in FCTC/chondrocyte TSNE subcluster and FCTC/chondrocyte subcluster pseudotime trajectory, respectively.
When analyzed by regeneration stage, proportional contributions of each cell type compared to the total cells in the sample (Fig. 1b) revealed a large expansion in the FCTCs population at the blastema stage, similar to the previously mentioned axolotl scRNAseq analysis36. This FCTC cluster was closely associated with the chondrocyte cell cluster, the skeletal precursors for regenerating lizard tail. Proportional cell type contributions were validated via fluorescent ISH (FISH) using cluster-defining marker genes (Supplementary Fig. 2), depicting a significant increase in FCTCs 14 DPA compared to 0 and 7 DPA. Given the expansion of FCTCs in the blastema stage and their close clustering with chondrocytes, the FCTC cluster and chondrocyte cluster were isolated, computationally integrated, and subclustered (Fig. 1c, d) to determine if distinct fibroblast populations existed within the FCTC cluster and to reveal any possible gene signatures leading to FCTC chondrogenic potential.
Pseudotime trajectory analysis, a computational method used to infer biological transitions or cell lineage relationships based on scRNAseq gene expression profiles48, was performed on the FCTC/chondrocyte subcluster (Fig. 1e, f) using R package Monocle249,50,51 and revealed one minor and two major branch points of potential cell fate trajectory change over the course of regeneration. When analyzing by regeneration time point (Fig. 1g, h and Supplementary Fig. 3), earlier pseudotime cell populations corresponded mostly with blastema stage cell populations, while later pseudotime branch points were dominated by regenerated homeostasis and original tail cells, suggesting the blastema stage and early pseudotime represent a less terminally differentiated, more plastic cell type, while regenerated homeostatic cells in late pseudotime may have a more restricted/defined cell fate.
Further analysis of differentially expressed genes (DEGs) in the FCTC/chondrocyte subcluster revealed high levels of osteopontin, also referred to as secreted phosphoprotein 1 (spp1), expression (Fig. 1i, j), particularly in subcluster 1 of the FCTC/chondrocyte dataset, within the blastema stage sample and early pseudotime. Spp1 was first described for its role in bone mineralization and extracellular matrix deposition52, but more recent work suggests spp1 can act as a cytokine and play a role in injury response53,54,55,56. For example, spp1 has been implicated in Wnt and Hedgehog (Hh) pathway signaling modulation57,58 and may help critical cell populations survive wound environments due to anti-apoptotic activities59.
Sulfatase 1 (sulf1) expression (Fig. 1k, l) spanned blastema and regenerated time points, as well as most of pseudotime, with expression ranging early, middle, and late pseudotime. As a heparin sulfate 6-O-endosulfatase that selectively removes 6-O-sulfate groups from heparin sulfate proteoglycans (HSPGs), sulf1 enzymatic activity modulates the binding and downstream signaling of many HSPG receptors for heparin-binding growth factors and cytokines60,61. Endosulfatases have been shown to be necessary for activating Wnt and BMP signaling during mammalian and avian skeletalgenesis and to dampen FGF signaling61,62,63, while sulf1 specifically has also been shown to modulate Hh signaling by enhancing local sonic hedgehog (shh) concentrations and availability64.
Chondrocyte markers sox9 (Fig. 1m, n) and collagen type II alpha 1 chain (col2a1)15 (Fig. 1o, p) were heavily focused in subcluster 2, in regenerated homeostatic cells, and were specifically expressed in the bottom branch of late pseudotime. Thus, the right branch of the early pseudotime trajectory was dominated by spp1+ blastema stage fibroblasts and the bottom branch of late pseudotime represented more differentiated sox9+ regenerating chondrocytes and terminally differentiated col2a1+ cartilage in regenerated homeostasis. DEGs phospholipid transfer protein (pltp) and spalt like transcription factor 1 (sall1) were also analyzed via pseudotime trajectory analysis (Supplementary Fig. 4) but did not reveal distinct expression patterns correlating pseudotime with specific regeneration stages.
Taken together, pseudotime trajectory analysis suggested fibroblasts gained FCTC marker gene expression over the course of regeneration, eventually leading to potential chondrogenic capacity and chondrocyte cell fate. Many blastema FCTCs express spp1. Some, but not all, of those fibroblasts may go on to express sulf1 as they continue along the tail regeneration process, and later, can become sox9+ chondrocytes and form col2a1+ cartilage. This scRNAseq study represents a critical time course analysis of lizard tail regeneration, and through pseudotime trajectory, proposes a potential relationship between FCTC marker gene expression and blastema FCTC chondrogenesis, investigated further below.
Lizard tail blastemas consist of FCTCs
Using single-cell data analysis, several differentially upregulated fibroblast genes were identified within the FCTCs cluster, many with implications in other organisms for condensing mesenchyme, cartilage formation and bone remodeling and deposition functions52,65,66. These FCTC marker genes were stained for expression throughout tail regeneration, revealing changes in fibroblast gene expression patterns in a spatiotemporal manner (Fig. 2 and Supplementary Fig. 5). In uninjured original tails, collagen type III alpha 1 chain (co13a1+) homeostatic FCTCs lined periosteum, perichondrium, epidermis, and other connective tissues (Fig. 2a–f), with many FCTCs also expressing low levels of cadherin 11 (cdh11), (Supplementary Fig. 5a–e), as previously reported67. By 7 DPA, several additional fibroblast genes activated compared to 0 DPA and relocalized from terminal vertebrae to distal wound sites. These injury-state FCTCs exhibited elevated spp1 (Fig. 2k), as well as col3a1 (Fig. 2g), cdh11, collagen type XII alpha 1 chain (col12a1), midkine (mdk), secreted protein acidic and cysteine rich (sparc), and tenascin-like (tnl) expression (Supplementary Fig. 5f–j). Sulf1 began to localize to regions adjacent to amputated spinal cords (Fig. 2l), while phospholipid transfer protein (pltp), spalt like transcription factor 1 (sall1), and sox9 (Fig. 2h–j) exhibited little-to-no expression 7 DPA.
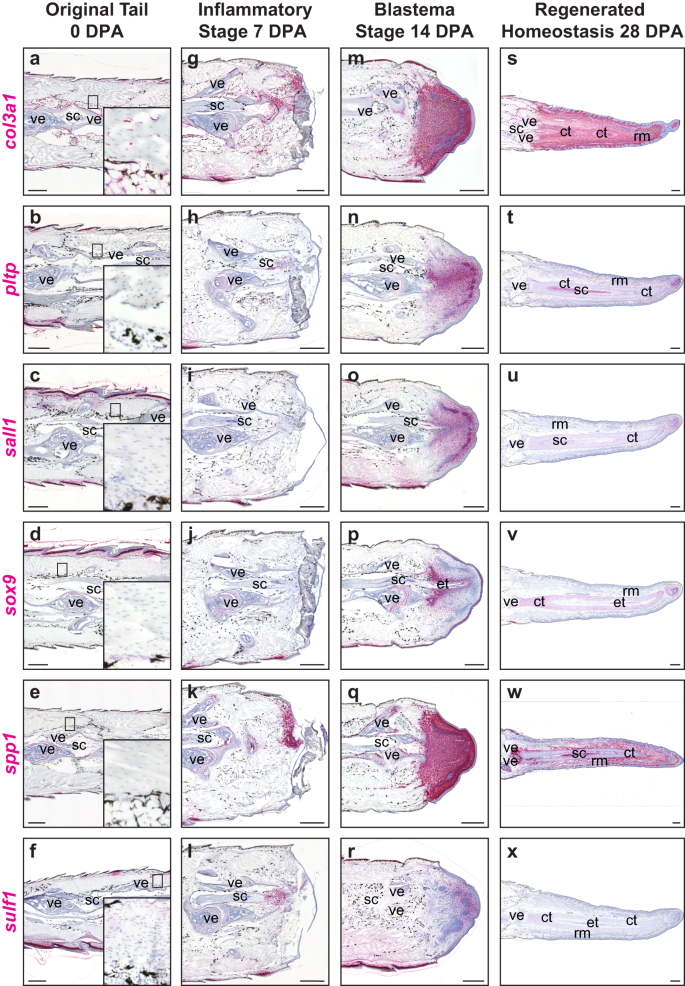
Representative sagittal sections of original and regenerating lizard (A. carolinensis) tail samples analyzed via RNAscope™ in situ hybridization. a–f Original tails (0 DPA) with magnified inset of homeostatic fibroblasts, g–l inflammatory stage tails 7 DPA, m–r blastema stage tails 14 DPA, and s–x regenerated homeostasis stage tails 28 DPA analyzed for col3a1, pltp, sall1, sox9, spp1, and sulf1. n = 5 animals/samples per time point. ct cartilage tube, et ependymal tube, rm regenerated muscle, sc spinal cord, ve vertebra. Bar = 500 µm.
During blastema formation 14 DPA, FCTCs aggregated at distal tail tips and increased expression of several marker genes. Extensive sparc expression was observed throughout blastemas, including regenerating muscle bundles (Supplementary Fig. 5n), while col3a1, spp1, col12a1, mdk, and tnl labeled all newly formed blastemal tissue, but with markedly lower expression in regenerating muscle bundles (Fig. 2m, q and Supplementary Fig. 5l, m, o). Several FCTC markers exhibited more localized expression patterns within tail blastemas. Sox9 expression, the conserved marker gene of chondrogenic potential and cartilage regeneration in lizards47, labeled pro-chondrogenic mesenchyme condensing around central regenerated spinal cords and exhibited high medial expression to low lateral expression and proximal (high) to distal (low) organizations (Fig. 2p). Condensing chondrogenic mesenchyme was also labeled by pltp, sall1, sulf1, and cdh11 expression (Fig. 2n, o, r and Supplementary Fig. 5k). Sulf1 also labeled FCTC populations at distal blastema tips, exhibiting medial to lateral and proximodistal organizations, inverse to those of sox9 (Fig. 2r).
At 28 DPA, regenerated connective tissue maintained high expression of spp1, cdh11, mdk, and tnl, but these markers were largely excluded from differentiated muscle and cartilage elements (Fig. 2w and Supplementary Fig. 5p, r, t). Col12a1 and sparc were highly expressed in connective tissues and regenerated cartilage, but specifically excluded from regenerated muscle bundles (Supplementary Fig. 5q, s). Only col3a1 maintained high expression in FCTC populations in every stage of regeneration from 0 to 28 DPA in connective tissues within the epidermis, muscle bundles, cartilage elements and interstitium (Fig. 2s). Sox9 expression specifically labeled cartilage tubes and decreased proximodistally (Fig. 2v). Pltp and sall1 were most highly expressed medially, surrounding cartilage tubes, and distally at tail tips, but were largely lost in other connective tissues (Fig. 2t, u). Sulf1 expression was notably absent 28 DPA, with only minimal expression remaining in cartilage tubes (Fig. 2x). Overall, regenerated tails 14 and 28 DPA were dominated by FCTC populations despite their relatively small and restricted niches within original tails (0 DPA), while several FCTC genes were turned on during the injury-state of tail regeneration 7 DPA.
Sulf1 + blastema FCTCs stimulated by Hh form cartilage
ScRNAseq results described above indicated distinct cartilage and blastema FCTC clusters, and previous studies from our lab have identified ependyma-contributed Hh signaling as the critical signal for inducing blastema cartilage formation14. Pharmacological agents were used to test the effects of Hh inhibition and activation on blastema cell chondrogenesis (Supplementary Fig. 6). Lizards were treated with the Hh inhibitor cyclopamine, Hh smoothened agonist (SAG), or vehicle control for 28 days. Tails were then collected and analyzed by gross morphology (Supplementary Fig. 6a–c) and histology/FISH for expression of col2a1, a marker of mature cartilage differentiation, shh, the predominant Hh signal within regenerated tails, and fabp7, an ependymal cell marker (Supplementary Fig. 6d–l).
Lizards treated with vehicle control developed typical regenerated tails with cylindrical col2a1+ cartilage tubes surrounding shh+ fabp7+ ependymal tubes (Supplementary Fig. 6a, d, g, h). Lizards treated with cyclopamine regrew tails of normal length, but completely lacked cartilage despite maintenance of shh expression by ependymal tubes (Supplementary Fig. 6b, e, i, j). Conversely, treatment with SAG resulted in stunted, bulbous tails filled with abundant col2a1+ ectopic cartilage regions in addition to endogenous cartilage tubes (Supplementary Fig. 6c, f, k, l). Neither Hh inhibition nor activation effected shh expression by fabp7+ ependymal cells (Supplementary Fig. 6h, j, l), indicating that changes in blastema FCTC chondrogenesis resulted directly from drug treatments. SAG-induced cartilage was not observed anywhere else in the lizard and was specific to blastema-derived tail regions. These results suggested that Hh signaling is necessary and sufficient for inducing chondrogenesis in blastema FCTCs and that a large portion of blastema cells are capable of cartilage differentiation. Exogenous Hh signals from SAG treatment extend pro-chondrogenic areas beyond regions that typically form cartilage in response to endogenous signaling.
Next, the effects of Hh activators/inhibitors on lizard limb and tail FCTCs gene expression and chondrogenic potential were compared. Lizard tails and limbs were collected 28 DPA from animals treated with cyclopamine, SAG, or vehicle control and analyzed by histology/ISH for col2a1, spp1, and GLI family zinc finger 1 (gli1) expression (Supplementary Fig. 7). As described above, control tails developed col2a1+ cartilage tubes. Cartilage tube development was inhibited by cyclopamine treatment and expanded by SAG treatment, resulting in extensive ectopic cartilage formation (Supplementary Fig. 7a, g, m). Tail FCTCs maintained spp1 expression 28 DPA, and expression was unaffected by cyclopamine or SAG treatment (Supplementary Fig. 7b, h, n).
In direct contrast to tail blastema cells, limb fibroblasts did not express col2a1 or undergo chondrogenesis in any of the conditions tested (Supplementary Fig. 7d–f, j–l, p–r). Specifically, ectopic cartilage did not form in SAG-treated groups (Supplementary Fig. 7p). Furthermore, limb FCTC spp1 expression was not maintained 28 DPA and was not sensitive to Hh signaling (Supplementary Fig. 7e, k, q). Gli1, a downstream reporter of the Hh signaling pathway and an established readout of Hh pathway activation68, was expressed natively in control tails (Supplementary Fig. 7c), while expression was absent in control limbs (Supplementary Fig. 7f) and in both limb and tail Hh inhibitor cyclopamine treatment samples (Supplementary Fig. 7i, l). SAG-treated tail and limb both exhibited high levels of gli1 activation (Supplementary Fig. 7o, r), validating SAG treatment as a Hh pathway activator in both tail and limb. These results indicated that, unlike tail blastemal FCTCs, amputated limb fibroblasts lacked Hh-responsive chondrogenic potential, despite evidence of sufficient Hh pathway activation with SAG treatment.
Single-cell sequencing results described above identified sulf1, pltp, sall1, and spp1 as lizard tail FCTC blastema markers. Sulf1 is reported to be regulated by Hh stimulation in other systems60,64,69, and here, we tested the effects of Hh inhibition and activation on tail blastema marker expression (Fig. 3). Amputated lizard limbs, which do not naturally form blastemas, were included in analyses to distinguish blastema-specific markers from nonspecific healing responses8,70,71,72 (Fig. 3m–x). Tail blastema and limb samples were collected 14 DPA from the same lizards treated with cyclopamine, SAG, or vehicle control and analyzed by histology/ISH for sulf1, pltp, sall1, and spp1 to provide context for any Hh signaling dependencies observed among marker expression patterns.

Representative sagittal sections of a–l tail and m–x limb samples collected from lizards (A. carolinensis) 14 DPA treated with a–d, m–p vehicle control, e–h, q–t Hedgehog inhibitor cyclopamine and i–l, u–x Hedgehog smoothened agonist, SAG, and analyzed by histology/ISH for sulf1, spp1, pltp, and sall1. n = 5 lizards per treatment condition. et ependymal tube, sc spinal cord, tb tibia, ve vertebra. Bar = 500 µm.
Control tail blastemas expressed sulf1, spp1, pltp, and sall1 (Fig. 3a–d). spp1 was expressed at high levels throughout blastemas, while pltp and sall1 were expressed at relatively lower levels (Fig. 3b–d). Sulf1 exhibited the most defined expression pattern, being localized in areas surrounding ependymal tubes, especially apical blastemas and pre-cartilage tube condensations (Fig. 3a). Cyclopamine treatment significantly reduced tail blastema sulf1 expression (Fig. 3e) but did not affect other markers tested (Fig. 3f–h). Conversely, SAG treatment resulted in increased and expanded sulf1+ blastema areas (Fig. 3i), especially in dorsal and proximal blastema areas, but did not affect spp1, pltp, or sall1 expression (Fig. 3j–l).
Amputated limb FCTCs expressed high levels of spp1 (Fig. 3n), but sulf1, pltp, and sall1 were absent from limbs under control conditions (Fig. 3m, o, p). Expression of gene markers assayed was not affected by either cyclopamine or SAG treatments in limbs (Fig. 3q–x), and, unlike tail blastema cells, amputated limb FCTCs did not increase sulf1 expression in response to SAG treatment (Fig. 3u). These results were confirmed quantitatively via real-time polymerase chain reaction (RT-PCR) analysis of tail samples 14 DPA for sulf1, spp1, pltp and sall1 (Supplementary Fig. 8). Taken together, these results identified sulf1, pltp, and sall1 as specific blastema markers. Sulf1 was the only blastema marker tested that was particularly responsive to Hh stimulation and inhibition. Spp1 was further confirmed as a general marker of injury-state FCTCs stimulated by wound healing.
Sulf1 marks blastema FCTCs with chondrogenic potential
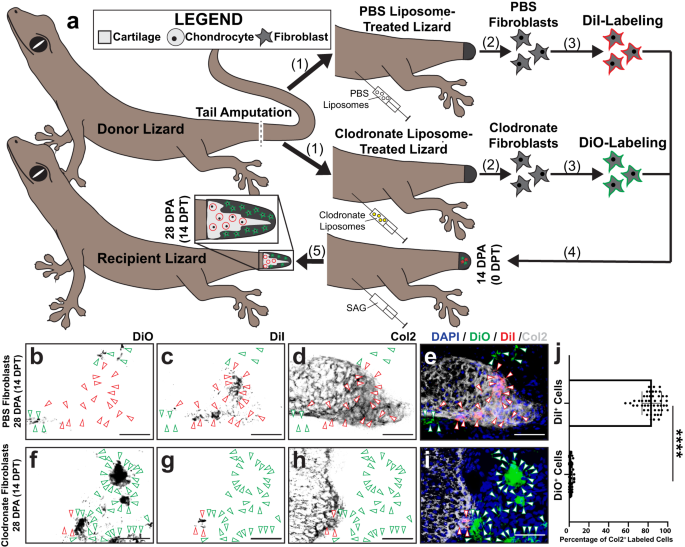
Next, we assessed the chondrogenic capacity of FCTCs from specific tail regeneration stages, to determine which FCTCs were competent to form cartilage, regardless of local tail environmental signaling in vivo, using a transplantation model previously established to trace cell fates during lizard tail regeneration73. Cells collected from the parthenogenetic lizard Lepidodactylus lugubris reconstitute regenerated structures following transplantation into amputated tail stumps of lizards belonging to the same clonal population without the need for immunosuppressant drug treatments74, previously shown to negatively impact regeneration24,75,76 (Fig. 4). Fibroblasts were isolated from donor L. lugubris original tails, blastema tails 14 DPA, and regenerated tails 28 DPA, and resulting isolated cell pools were enriched for FCTC populations using physical and enzymatic cell digestion, as well as MACS® bead treatments (Supplementary Fig. 9). Each FCTC pool was labeled with DiI and injected, separately, into SAG-treated recipient blastema tails 14 DPA. 14 days post-transplant (14 DPT, recipient lizards 28 DPA) recipient tails were analyzed for Col2 via immunofluorescence staining (IF) (Fig. 4a). Neither original nor regenerated tail fibroblasts incorporated into Col2+ cartilage by 28 DPA (Fig. 4b–d, h–k), while the majority of transplanted blastema fibroblasts co-stained DiI label and Col2 expression, incorporating into cartilage elements at a significantly higher rate than original and regenerated tail fibroblasts (Fig. 4e–g, k). This suggested that blastema fibroblasts were uniquely competent to form cartilage in response to Hh stimulation, compared to homeostatic original and regenerated tail fibroblasts.

a Experimental scheme for Lepidodactylus lugubris tail fibroblast transplantations. (1) Donor lizard tails are amputated. FCTCs are isolated from original tails (0 DPA), blastema tails (14 DPA), and regenerated tails (28 DPA). (2) Each tail FCTC pool is labeled with fluorescent DiI, separately. (3) Labeled FCTC pools are transplanted into tail blastemas (14 DPA) of SAG-treated recipient lizards, separately. (4) Following 14 days of SAG treatment post-transplantation (14 DPT), regenerated tails are analyzed via Col2 immunofluorescence staining (IF) and fluorescence microscopy. b–j Representative histological and fluorescent analysis of tails regenerated by SAG-treated lizards pre-injected with DiI-labeled tail FCTCs derived from (b–d) original tail, e–g blastema tails, or h–j regenerated tails, analyzed by Col2 IF 14 DPT/28 DPA. DiI and Col2 signals are presented separately and together to highlight co-localization or lack thereof. Green arrowheads denote DiI+ cells. Bar = 50 µm. k Quantification of DiI-labeled cells incorporated within Col2+ cartilage regions 14 DPT. n = 50 cell counts measured from five images among 10 different animals/tail samples for each condition. Data are presented as mean values +/− standard deviation. One-way Welch’s ANOVA for unequal variances and Dunnett’s T3 multiple comparisons tests was used. ****adjusted P < 0.0001 (Dunnett’s T3 multiple comparisons tests). Source data are provided as a Source Data file.
Previous work has indicated Hh signaling as regulating lizard blastema chondrogenesis14, and sulf1 is reported to be expressed in pre-condensing mesenchyme during chondrogenesis77, 78. Here, we tested co-localization of sulf1 with sox9, the transcription factor regulating chondrogenesis, within lizard tail blastemas 14 DPA in response to treatment with cyclopamine, SAG, and vehicle control. (Supplementary Fig. 10). Control tail blastemas exhibited proximodistal gradients of sulf1 and sox9 expression in FCTCs surrounding ependymal tubes (Supplementary Fig. 10a, b). Sulf1 expression localized in distal apical blastema regions and reduced proximally as it was replaced by sox9. Sox9 exhibited its strongest expression in proximal skeletal elements adjacent to original tail vertebrae at amputation planes. Cyclopamine treatment reduced both sulf1 and sox9 expression and interrupted proximodistal marker localizations (Supplementary Fig. 10c, d). In SAG-treated tails, both sulf1+ and sox9+ areas expanded peripherally into regions removed from ependymal tubes, but proximodistal expression relationships were maintained (Supplementary Fig. 10e, f).
The above results suggested a relationship between Hh signaling, sulf1 expression, and chondrogenesis. Here, we tested this relationship by comparing the abilities of sulf1+ and sulf1− lizard fibroblasts to undergo chondrogenesis in vivo using the L. lugubris transplantation model (Supplementary Fig. 11). First, donor original (0 DPA) tail and limb FCTCs were pre-labeled with the fluorescent dyes DiI and DiO, respectively. Labeled tail and limb FCTCs were mixed, and co-transplanted into recipient lizard tails at the time of recipient lizard tail amputation (0 DPA). Recipient lizards were treated with SAG, and tails were collected 14 and 28 DPT for integration assessment (Supplementary Fig. 11a). FISH and histological analysis of 14 DPT samples showed DiI+ tail and DiO+ limb-derived fibroblasts expressed sulf1 (Supplementary Fig. 11b–e, j). Similarly, both DiI+ and DiO+ fibroblasts formed Col2+ cartilage in 28 DPT samples assessed by IF (Supplementary Fig. 11f–i, k). These results suggested that both tail and limb fibroblasts possess the capacity for sulf1 expression and chondrogenesis when exposed to the blastema formation process and signaling niche.
Finally, we compared the above results with those observed when exogenous tail blastema and limb FCTCs were transplanted into recipient tails that had already formed blastemas. Fibroblasts isolated from donor L. lugubris tail blastemas and limbs 14 DPA, pre-labeled with the DiI and DiO, respectively, were co-transplanted into SAG-treated recipient lizard tail blastemas (Fig. 5). Tails were collected 1 and 14 DPT and analyzed as described above to compare percentages of exogenous tail blastema and limb fibroblasts that expressed sulf1 via FISH or Col2 via IF (Fig. 5a).
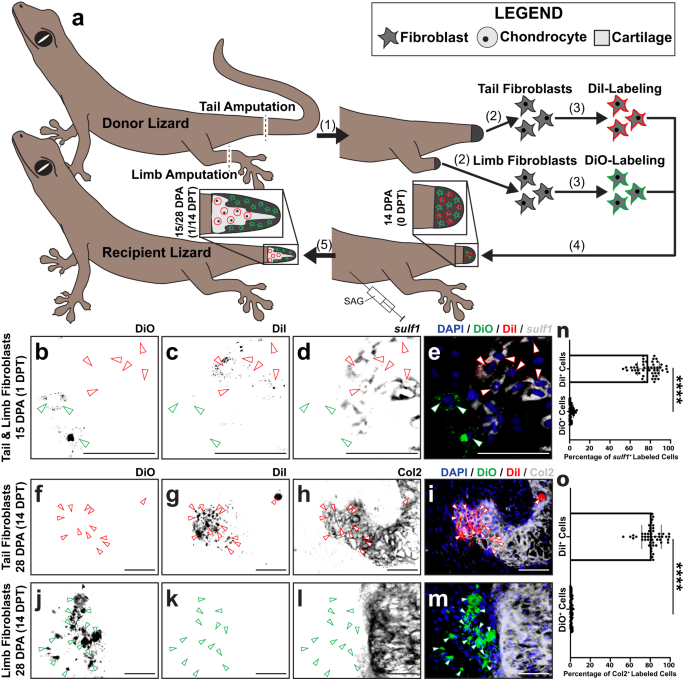
a Experimental scheme for L. lugubris tail blastema and amputated limb fibroblast transplantations. (1) Donor lizard tails and left hind limbs are amputated. (2) FCTCs are isolated from tail blastemas and limb stumps 14 DPA. (3) Tail FCTCs are labeled with DiI, while limb FCTCs are labeled with DiO. (4) Labeled FCTCs are co-transplanted into tail blastemas (14 DPA) of SAG-treated recipient lizards. (5) Following 1 and 14 days of SAG treatment post-transplantation, regenerated tails are analyzed via sulf1 FISH, Col2 IF, and fluorescence microscopy. b–m Representative histological and fluorescent analysis of tails regenerated by SAG-treated lizards pre-injected with DiI-labeled tail FCTCs and DiO-labeled limb FCTCs, analyzed by b–e sulf1 FISH 1-day post-transplantation (DPT)/15 DPA and f–m Col2 IF 14 DPT/28 DPA. DiI, DiO, and sulf1 or Col2 signals are presented separately and together to highlight co-localization or lack thereof. Red arrowheads mark DiI+ cells, and green arrowheads denote DiO+ cells. Bar = 50 µm. n, o Quantification of DiI- and DiO-labeled cells (n) co-expressing sulf1 1 DPT and o incorporated within Col2+ cartilage regions 14 DPT. n = 50 cell counts measured from five images among ten different animals/tail samples for each condition. Data are presented as mean values +/− standard deviation. Unpaired two-way t tests with Welch’s correction for unequal variances were used. ****P < 0.0001. Source data are provided as a Source Data file.
In 1 DPT samples, DiI+ tail blastema-derived fibroblasts colocalized with sulf1 expression, while DiO+ limb-derived fibroblasts did not (Fig. 5b–e, n). 14 DPT samples analyzed via IF for Col2 expression revealed significantly higher percentages of tail blastema FCTCs forming Col2+ cartilage than limb fibroblasts (Fig. 5f–o). Tail and limb fibroblasts were also transplanted separately into vehicle control- or SAG-treated recipient blastemas as controls (Supplementary Fig. 12). Only tail fibroblasts stimulated by SAG co-expressed DiI and Col2 (Supplementary Fig. 12d–f, m), while tail and limb FCTCs transplanted into vehicle control recipients and limb fibroblasts transplanted into SAG-treated recipient blastemas did not express Col2 or form cartilage (Supplementary Fig. 12a–c, g–m). Taken together, these results confirmed the abilities of sulf1+ blastema FCTCs, but not sulf1– limb FCTCs, to undergo chondrogenesis in response to Hh stimulation.
Tail regrowth involves distinct localizations of phagocytes
Further single-cell sequencing analyses of lizard tail regeneration investigated macrophages and other phagocytic cells, revealing heterogeneity and distinct cell populations delineated by differential marker gene expression and nearest-neighbor clustering (Supplementary Fig. 13a–c). Ctsb+ cathepsin K-negative (ctsk–) macrophages and ctsb+ ctsk+ osteoclasts clustered with other immune cells, as expected (Supplementary Fig. 13a, b). However, a distinct ctsb– ctsk+ population clustered with collagen type IV alpha 1 chain (col4a1+) pericytes (Supplementary Fig. 13a–d). Septoclast populations, phagocytic cells derived from a pericytic rather than myeloid lineage, have previously been shown to regulate skeletal development and healing in mammals79, and we hypothesized that ctsb– ctsk+ col4a1+ cells represented lizard septoclast-like phagocytic cells (herein, referred to as septoclasts).
Single-cell sequencing results were validated via histology/FISH in lizard tails and limbs collected 7, 14, and 21 DPA. (Fig. 6). Ctsb+ ctsk− col4a1− macrophage levels peaked in tails at 7 DPA (Fig. 6a–c, s) before diminishing by 21 DPA (Fig. 6g–i, s). Ctsb+ ctsk+ col4a1− osteoclast population numbers were highest in tails at 7 and 14 DPA before decreasing by 21 DPA (Fig. 6a–i, s). Tail osteoclasts were exclusively associated with vertebrae, occupying classic crypts along periosteal surfaces (Fig. 6a–i). Ctsb– ctsk+ col4a1+ septoclast levels peaked in tails during blastema formation at 14 DPA (Fig. 6a–i, s) and were detected among sulf1+ blastema fibroblast populations (Fig. 6a–i). In addition, tails collected 0, 1, 3, 7, and 14 DPA confirmed ctsb+ macrophage and osteoclast populations peaked at 7 DPA within the span of immune cell-active inflammatory stage time points 1–7 DPA (Supplementary Fig. 14). Unlike tail macrophage and osteoclasts, however, elevated septoclast numbers in tails persisted beyond blastema stages and, at 21 DPA, occupied sulf1+ apical regions at regenerating tail tips (Fig. 6g–i). Taken together, these results suggested a relationship between septoclasts and blastema cell state.
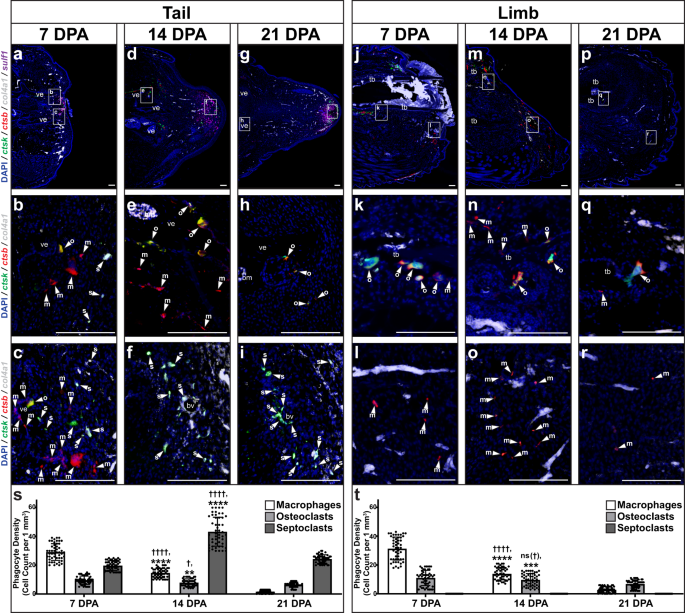
Representative sagittal sections of lizard (A. carolinensis) a–i tails and j–r limbs collected a–c, j–l 7 DPA, d–f, m–o 14 DPA, and g–i, p–r 21 DPA analyzed by histology/FISH for ctsb, ctsk, col4a1, and sulf1 expression. Higher magnification views of corresponding regions in (a, d, g, j, m, p) highlighting ctsb+ ctsk– col4a1– macrophages (m, arrowhead), ctsb+ ctsk+ col4a1− osteoclasts (o, arrowhead), and ctsb– ctsk+ col4a1+ septoclasts (s, arrowhead) in regions proximal to b, e, h vertebra, k, n, q tibia, c, f, i distal tail and l, o, r distal limb. bm bone marrow, bv blood vessel, tb tibia, ve vertebra. Bar = 100 µm. s, t Quantification of macrophage, osteoclast, and septoclast densities measured in lizard s tails and t limbs collected 7, 14, and 21 DPA. n = 50 cell densities measured from five images among 10 different animals/samples for each time point. Data are presented as mean values +/− standard deviation. One-way Welch’s ANOVA for unequal variances and Dunnett’s T3 multiple comparisons tests were used. †adjusted P = 0.0139; ††††adjusted P < 0.0001; ns (†), not significant (adjusted P = 0.4663), compared to corresponding cell type 7 DPA (Dunnett’s T3 multiple comparisons tests). **adjusted P = 0.0024; ***adjusted P = 0.0005; ****adjusted P < 0.0001, compared to corresponding cell type 21 DPA (Dunnett’s T3 multiple comparisons tests). Source data are provided as a Source Data file.
Limbs exhibited macrophage and osteoclast populations that followed similar spatiotemporal trends to time-matched tail cell populations (Fig. 6). Limb macrophages were associated with wound epidermis and, along with bone-associated osteoclasts, peaked prior to 14 DPA before diminishing further at 21 DPA (Fig. 6j–r, t). However, limbs did not exhibit identifiable septoclasts at any time points tested and did not express sulf1 (Fig. 6j–r, t). Given the lack of Hh-responsive chondrogenesis exhibited by amputated lizard limbs described above, these results further supported the links among lizard septoclasts, blastema formation, sulf1 expression, Hh sensitivity, and cartilage formation, which are investigated further below.
Blastema formation and chondrogenesis depend on phagocytes
We previously validated clodronate liposome treatments as effective methods for depleting lizard phagocyte/macrophage populations and inhibiting blastema formation in A. carolinensis9. Here, we tested the effect of clodronate liposome treatment on macrophage, osteoclast, and septoclast population levels and fibroblast marker expression during lizard tail blastema formation (Supplementary Fig. 15). Lizards were pre-treated with clodronate or vehicle control phosphate-buffered saline (PBS) liposomes 72 and 48 h prior to tail amputation, and tails were collected at the blastema stage 14 DPA for analysis.
Histology revealed clodronate liposome treatment inhibited blastema formation compared to controls (Supplementary Fig. 15a, b, f, g) and resulted in depletion of ctsb+ ctsk− macrophages, ctsb+ ctsk+ osteoclasts and ctsb− ctsk+ col4a1+ septoclasts (Supplementary Fig. 15c–e, h–j), as expected. Clodronate-treated tails also lost spp1 and sulf1 expression in FCTCs (Supplementary Fig. 15a, b, f, g). Control blastema revealed macrophages and osteoclasts localized to sulf1− areas of the blastema, while septoclasts were only detected distal to sulf1+ areas of the tail (Supplementary Fig. 15c–e). Co-staining of spp1 and sulf1 at 7 and 14 DPA in untreated blastema revealed spp1 expression at both 7 and 14 DPA, while large areas of sulf1+ blastema cells co-expressed spp1, confirming both markers are active in a subpopulation of blastema FCTC (Supplementary Fig. 16). Taken together, these results established a link between lizard phagocytic lineages and FCTC marker gene acquisition.
Next, we tested the effects of clodronate liposome pre-treatment on lizard FCTC responsiveness to Hh signaling in L. lugubris blastema fibroblast transplantation studies (Fig. 7). This model was found to be particularly applicable for testing exogenous FCTC chondrogenic potential in situ when endogenous conditions are not conducive to blastema/cartilage formation. L. lugubris lizards were pre-treated with clodronate liposomes (validated in Supplementary Fig. 17), or control PBS liposomes prior to amputation, and fibroblasts were isolated from tails 14 DPA. Fibroblasts collected from PBS and clodronate liposome-treated lizards were pre-labeled with DiI or DiO, respectively, before co-transplanting into a separate cohort of SAG-treated recipient lizard blastemas (Fig. 7a).
a Experimental scheme for applying clodronate liposome treatments and fibroblast transplantations in lizards (L. lugubris) toward investigating dependencies of blastema cell chondrogenesis on phagocyte populations. (1) Tails of PBS liposome- and clodronate liposome-treated donor lizards are amputated. (2) Tail fibroblasts are isolated from PBS liposome- and clodronate liposome-treated lizard tails 14 DPA. (3) PBS lizard-derived fibroblasts are labeled with DiI, while clodronate fibroblasts are labeled with DiO. (4) Labeled cells are co-transplanted into 14 DPA tail blastema of recipient SAG-treated lizards. (5) Following 14 days of SAG treatment post-transplantation, regenerated tails are analyzed via Col2 IF and fluorescence microscopy. b–i Representative histological analysis of tails regenerated by SAG-treated lizards pre-injected with DiI-labeled PBS liposome-treated FCTCs and DiO-labeled clodronate liposome-treated FCTCs and analyzed by histology, DiI and DiO fluorescence, and Col2 IF 14 DPT/28 DPA. Bar = 50 µm. j Quantification of DiI- and DiO-labeled cells co-expressing Col2 14 DPT. n = 50 cell counts measured from five images among ten different animals/tails for each condition. Data are presented as mean values +/− standard deviation. Unpaired two-way t test with Welch’s correction for unequal variances was used. ****P < 0.0001. Source data are provided as a Source Data file.
Tails were collected 14 DPT and analyzed for the contribution of DiO+ and DiI+ cells to cartilage formation (Fig. 7b–j). Significantly higher levels of DiI+ control tail FCTCs underwent chondrogenesis, incorporating into Col2+ areas of condensing cartilage, compared to DiO+ clodronate-treated FCTCs, suggesting that blastema fibroblasts contributed to cartilage regions while fibroblasts derived from clodronate-treated tails, lacking blastemas, did not (Fig. 7b–j). Clodronate and PBS liposome-treated fibroblasts transplanted separately into SAG- or vehicle control-treated recipient blastemas revealed similar results (Supplementary Fig. 18), with only PBS liposome-treated fibroblasts incorporating into Col2+ cartilage (Supplementary Fig. 18d–f, m), while clodronate liposome fibroblasts in SAG-treated recipients and PBS or clodronate liposome-treated fibroblasts transplanted into vehicle control blastema did not express Col2 (Supplementary Fig. 18a–c, g–m). Taken together, these results established a dependency of lizard blastema cell Hh-responsive chondrogenesis on pre-conditioning by phagocyte populations.
Phagocyte-conditioned media rescues blastema formation
We have previously established protocols for isolating and differentiating phagocyte populations from multiple lizard tissues9. Given the evidence described above linking septoclasts with pericytes, we hypothesized that pericyte-rich tail blood vessels represented effective sources of septoclasts. Caudal blood vessels were isolated from lizard tails and subjected to phagocyte isolation protocols. Lizard bone marrow were utilized as a source of macrophages, as previously validated9. Phagocytes differentiated from caudal blood vessels and bone marrow cells were analyzed by phagocytosis assays, flow cytometry and by IF/FISH for Ctsk, ctsb, integrin subunit alpha M (itgam/cd11b), and col4a1 expression (Supplementary Fig. 19).
Both caudal vessel- and bone marrow-derived cells exhibited similarly high levels of phagocytosis (Supplementary Fig. 19a–c, g) and expressed itgam/cd11b (Supplementary Fig. 19d, h), validating their identities as phagocytes. However, blood vessel and bone marrow phagocytes exhibited differential marker expressions that mirrored differences observed in vivo (Supplementary Fig. 19d–f, h–j); bone marrow phagocytes expressed macrophage marker ctsb (Supplementary Fig. 19d–f), while caudal vessel phagocytes expressed septoclast markers Ctsk and col4a1 (Supplementary Fig. 19h–j). Flow cytometry confirmed the purity of respective macrophage and septoclast populations, with an average of 94.5% of cells within the bone marrow phagocyte pools expressing Ctsb+ Ctsk− macrophage signatures and more than 98% of caudal vessel phagocyte cells expressed Ctsb− Ctsk+ septoclast signatures (Supplementary Fig. 19k–p). Taken together, these results validated ctsb− ctsk+ col4a1+ caudal blood vessel-derived phagocyte cultures as septoclasts and ctsb+ ctsk− col4a1− bone marrow-derived phagocyte cultures as macrophages.
Next, we tested the abilities of septoclast populations to rescue the lizard tail blastema cell chondrogenic-potential state, defined by Hh-responsive sulf1 expression, following clodronate liposome treatment (Fig. 8 and Supplementary Fig. 20). Macrophage-conditioned media (M-CM) and septoclast-conditioned media (S-CM) were collected from bone marrow- and caudal vessel-derived phagocytes, respectively, and concentrated. Alginate beads soaked in concentrated M-CM and/or S-CM were implanted into amputated tails of lizards co-treated with clodronate liposomes and either SAG (Fig. 8a) or vehicle control (Supplementary Fig. 20a). Tails were collected 14 days post-implantation and analyzed by histology/ISH/FISH for sulf1 and spp1 expression and phagocytic cell markers (Fig. 8b–q and Supplementary Fig. 20b–q).
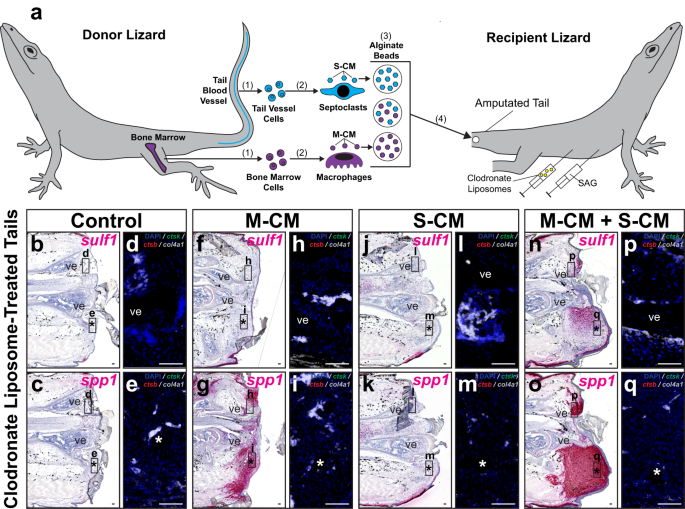
a Experimental scheme for testing effects of biomolecules secreted by macrophage and septoclast populations on FCTC gene expression in clodronate liposome-treated lizard (A. carolinensis) tails. (1) Bone marrow and tail blood vessel cells are isolated from donor lizards and (2) differentiated into macrophages and septoclasts in vitro, respectively. (3) Macrophage- and septoclast-conditioned media (M-CM and S-CM, respectively) are collected, concentrated, and absorbed by alginate beads, both separately and together. (4) Alginate beads are implanted into amputated tails of lizards (0 DPA) co-treated with clodronate liposomes and SAG. b–q Representative sagittal sections of lizard tails 14 DPA co-treated with SAG and clodronate liposomes, implanted with M-CM and/or S-CM beads, and analyzed via histology/ISH/FISH for sulf1, spp1, ctsk, ctsb, and col4a1 expression. Higher magnification fluorescent views of (b, c, f, g, j, k, n, o), respectively, depict indicated regions around d, h, l, p vertebra and e, i, m, q implanted beads. n = 8 lizards/samples per treatment condition tested. *, location of implanted bead; ve, vertebra. Bar = 50 µm.
Spp1 signal was detected in M-CM-treated tails regardless of SAG/vehicle control treatment (Fig. 8g, o and Supplementary Fig. 20g, o), but was absent in S-CM-only treated conditions (Fig. 8k and Supplementary Fig. 20k). Sulf1 expression was only detected in tails co-treated with SAG and both M-CM and S-CM (Fig. 8n and Supplementary Fig. 20n). Spp1+ and sulf1+ tail regions concentrated around implanted beads in M-CM and S-CM-treated samples (Fig. 8g, n, o). Endogenous ctsb+ ctsk− col4a1− macrophages, ctsb+ ctsk+ col4a1− osteoclasts, and ctsb− ctsk+ col4a1+ septoclasts were not detected in any of the conditions tested, as expected due to clodronate liposome treatment (Fig. 8 and Supplementary Fig. 20).
Unconditioned culture media-soaked beads were utilized as a control and implanted into clodronate liposome-treated tails (Supplementary Fig. 21), revealing no changes in spp1 or sulf1 expression in vehicle control or SAG-treated recipient tails (Supplementary Fig. 21a–d), signifying phagocyte-conditioned media treatments were responsible for changes in gene expression rather than bead implantation or culture media alone. Taken together, these results suggested that biomolecules secreted by lizard septoclasts were necessary for rescuing hallmarks of blastema formation including sulf1 expression in response to Hh stimulation even when endogenous septoclast populations had been depleted. While macrophage-secreted factors were sufficient for inducing FCTC spp1 expression, sulf1 was only detected in tails treated with both macrophage- and septoclast-conditioned media, indicating a sequential addition of FCTC marker gene expression during blastema establishment.
Septoclast-CM induces cartilage formation in amputated limbs
Above comparisons of amputated lizard tail and limb healing suggested a link between FCTC chondrogenesis and septoclast populations, and, here, the effects of S-CM on lizard limb sulf1, spp1, and sox9 expression were tested (Fig. 9 and Supplementary Fig. 22). Beads soaked in S-CM and/or M-CM were implanted in lizard limbs 7 DPA. After 21 days of treatment with SAG (Fig. 9) or vehicle control (Supplementary Fig. 22), limbs were collected and analyzed via histology/ISH for FCTC and chondrogenesis marker expression and via FISH for phagocyte markers (Fig. 9a and Supplementary Fig. 22a).
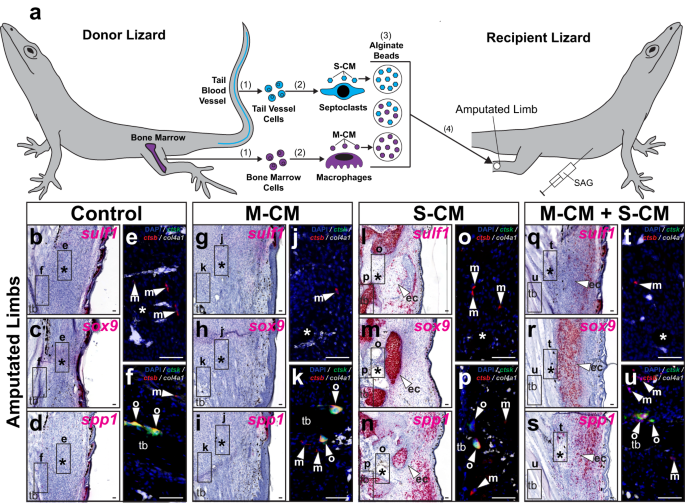
a Experimental scheme for testing effects of macrophage- and septoclast-conditioned media on native fibroblasts in lizard (A. carolinensis) limbs. (1) Bone marrow and tail blood vessel cells are isolated and (2) used to derive macrophages and septoclasts in vitro, respectively. (3) Media conditioned by macrophages and septoclasts (M-CM and S-CM) are collected, concentrated, and absorbed by alginate beads, both separately and together. (4) Alginate beads are implanted into amputated limbs of SAG-treated lizards 7 DPA. b–u Representative sagittal sections of lizard limbs 28 DPA treated with SAG, implanted with M-CM and/or S-CM beads, and analyzed via histology/ISH/FISH for sulf1, sox9, spp1, ctsk, ctsb, and col4a1 expression. Higher magnification fluorescent views of (b–d, g–i, l–n, q–s), respectively, depict indicated regions around e, j, o, t implanted beads and f, k, p, u tibia. n = 8 lizards/samples per treatment condition tested. *, location of implanted bead; ec (arrowhead), ectopic cartilage; m (arrowhead), macrophage; o (arrowhead), osteoclast; tb, tibia. Bar = 50 µm.
FCTCs in control limbs and limbs implanted with M-CM beads without S-CM did not express sulf1, sox9, or spp1 regardless of SAG/vehicle control treatments (Fig. 9b–d, g–i and Supplementary Fig. 22b–d, g–i). Implanted S-CM beads, with and without M-CM, induced FCTC sulf1 and sox9 expression around bead implantation sites, but only in response to co-treatment with SAG (Fig. 9l, m, q, r and Supplementary Fig. 22l, m, q, r). S-CM beads, again, regardless of M-CM addition, induced spp1 expression in limbs of both SAG- and vehicle control-treated lizards (Fig. 9n, s and Supplementary Fig. 22n, s). Endogenous macrophages and osteoclasts, but not septoclasts, were detected in all conditions tested and levels were unaffected by drug or bead treatment regardless of conditioned media type (Fig. 9 and Supplementary Fig. 22).
Unconditioned media treatment did not induce gene expression changes or chondrogenesis in vehicle control or SAG-treated recipient limbs (Supplementary Fig. 21e–j). These results suggested that exogenous septoclast-derived signals were necessary and sufficient for supplementing the naturally septoclast-deficient amputated limb environment, introducing Hh-responsive chondrogenesis to amputated lizard limbs. Lizard septoclast cell factors also maintained spp1 expression in lizard limbs until at least 28 DPA. (Fig. 9n, s and Supplementary Fig. 22n, s). Since loss of spp1 expression by lizard limb FCTCs 28 DPA coincides with scar formation by 28 DPA (Supplementary Fig. 7k), these results suggest a role for lizard septoclast populations in the inhibition of fibrosis.
In summary, the results described above suggest the following mechanisms of sequential fibroblast marker gene acquisition during lizard tail blastemal formation (Fig. 10). Col3a1+ resting fibroblasts in both tail and limb respond to amputation injury with expression of spp1, along with other injury-state FCTC marker genes such as col12a1 and mdk. Injury-state FCTCs migrate to amputation sites following infiltration of macrophage populations and signaling from macrophage-secreted factors. Lizard tails, but not limbs, exhibit septoclast cell populations following amputation injuries that induce increased FCTC Hh sensitivity. FCTCs exposed to septoclast-secreted factors maintain spp1 and express sulf1 and sox9 following stimulation by shh, produced by ependymal cells. This spatial patterning results in cartilage forming around blastema ependymal tubes. Without septoclasts, amputated limb FCTCs do not maintain spp1 expression and remain unresponsive to Hh signaling. Limb FCTCs do not express sulf1 or undergo chondrogenesis, even when treated with exogenous Hh signals, ultimately forming scars instead of cartilage.
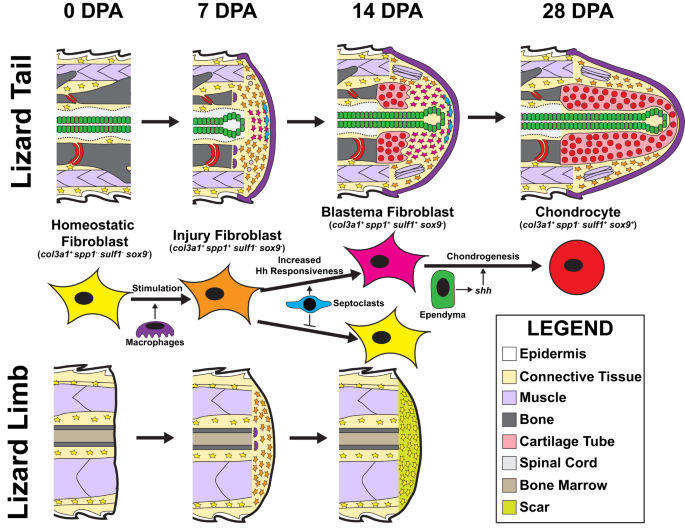
Col3a1+ homeostatic original tail FCTCs (0 DPA) are stimulated by macrophage paracrine signals and express spp1 in response to injury by 7 DPA. Factors secreted by tail septoclasts maintain spp1 expression in FCTCs and enhance FCTC sensitivity to Hedgehog (Hh) signals contributed by blastema ependymal tubes. Hh stimulation induces sulf1 expression in septoclast-stimulated blastema FCTCs by 14 DPA. Sulf1+ FCTCs enter a chondrogenic program in response to Hh signals and express sox9 and col2a1, differentiating into chondrocytes by 28 DPA. Amputated lizard limbs provide context for tail blastema formation and regrowth as non-regenerative appendages that exhibit FCTC mobilization and state changes, but not chondrogenesis. Col3a1+ homeostatic limb fibroblasts express spp1 at 7 DPA in response to macrophage infiltration following amputation. However, spp1 expression is not maintained without stimulation from septoclasts, which are absent in amputated lizard limbs. Without exposure to septoclast-secreted factors, limb FCTCs lose spp1 expression by 14 DPA, remain unresponsive to Hh signaling, and do not express sulf1 or undergo chondrogenesis. Instead, amputated lizard limbs form scars.
- SEO Powered Content & PR Distribution. Get Amplified Today.
- PlatoData.Network Vertical Generative Ai. Empower Yourself. Access Here.
- PlatoAiStream. Web3 Intelligence. Knowledge Amplified. Access Here.
- PlatoESG. Automotive / EVs, Carbon, CleanTech, Energy, Environment, Solar, Waste Management. Access Here.
- PlatoHealth. Biotech and Clinical Trials Intelligence. Access Here.
- ChartPrime. Elevate your Trading Game with ChartPrime. Access Here.
- BlockOffsets. Modernizing Environmental Offset Ownership. Access Here.
- Source: https://www.nature.com/articles/s41467-023-40206-z

