Acute platelet depletion rapidly recruits quiescent HSCs into proliferation
In line with previous studies9, administration of a single dose of anti-GPIbα antibody to Vwf-GFP mice, to mimic the thrombocytopenia observed in patients with immune thrombocytopenia purpura (ITP), rapidly and efficiently depleted platelets in the course of 1 day without significantly affecting other blood cell lineages (Fig. 1a). This was accompanied by a rapid (within 1 day) cell cycle activation of Lin–Sca1+c-Kit+ (LSK) Flt3–CD48–CD150+ HSCs. Recruitment into active cell cycle was preferentially observed within the Vwf-GFP+ (Vwf+) HSC compartment (Fig. 1b–d), which is enriched in platelet-biased HSCs but predominantly contains multilineage reconstituting HSCs9,18. While over 60% of Vwf+ LSKFlt3–CD48–CD150+ HSCs entered the S-G2-M phase of cell cycle, only a small fraction of Vwf-GFP– (Vwf–) HSCs entered S-G2-M. Nevertheless, most Vwf– HSCs moved from a quiescent (G0) to a more activated G1 stage (Fig. 1c, d).
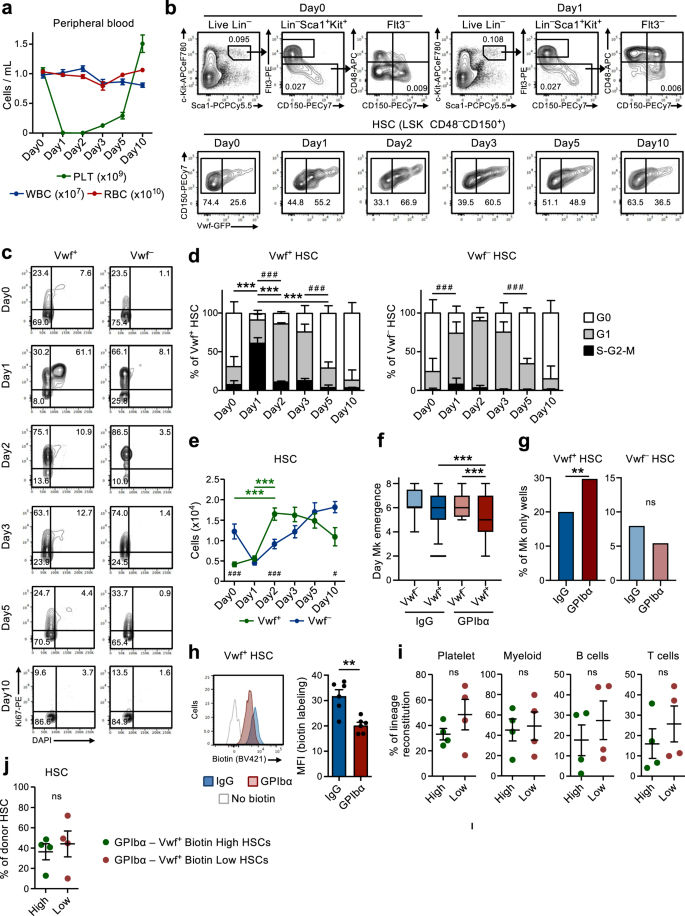
(Related to Supplementary Figs. 1 and 2). a Kinetics analysis of peripheral blood cell parameters post administration of anti-GPIbα antibody. Day 0 mice were treated with IgG isotype control antibody. Data represent mean ± SEM of 10 (Day0), 13 (Day1), 10 (Day2), 9 (Day3), 8 (Day5) and 7 (Day10) mice from 14 independent experiments. PLT platelets, WBC white blood cells, RBC red blood cells. b Representative FACS profiles and gating strategy of Vwf-GFP+ (Vwf+) and Vwf-GFP– (Vwf–) LSKFlt3–CD150+CD48– HSCs at the indicated time points after platelet depletion. Numbers in gates/quadrants indicate the frequency (average of all mice analyzed) of the gated cell population among total live cells (upper panels) or among HSCs (lower panels). c, d Cell cycle analysis of Vwf+ and Vwf– LSKFlt3–CD150+CD48– HSCs at the indicated time points post platelet depletion. c Representative cell cycle FACS profiles of Vwf+ (left) and Vwf– (right) HSCs in G0 (DAPI–Ki67–) G1 (DAPI–Ki67+) or S-G2-M (DAPI+Ki67+) phases of cell cycle. Numbers in gates represent frequencies (average of all mice analyzed) of total HSCs. d Mean ± SD cell cycle phase distribution of Vwf+ (left) and Vwf– (right) HSCs. Data from 5 (Day0), 5 (Day1), 3 (Day2), 5 (Day3), 5 (Day5) and 4 (Day10) mice from 6 independent experiments. ***p < 0.001; **p < 0.01 for the S-G2-M cell cycle fraction; # # #p < 0.001 for the G1 cell cycle fraction (both using 2-way ANOVA with Tukey’s multiple comparisons); e Absolute numbers of Vwf+ and Vwf– HSCs (per 2 legs, see methods). Mean ± SEM data of 8 (Day0), 8 (Day1), 7 (Day2), 5 (Day3), 6 (Day5) and 5 (Day10) mice from 9 independent experiments. ***p < 0.001 for Vwf+ HSC (2-way ANOVA with Tukey’s multiple comparisons); #p < 0.05 and ###p < 0.001 for the comparison of Vwf+ vs. Vwf– HSCs (2-way ANOVA with Sidak’s multiple comparisons). Time of appearance of the first Mk (f) and frequency of colonies with only Mk cells (g) in cultured single Vwf–or Vwf+ HSCs isolated from mice 16 hrs post IgG or GPIbα treatment. Data from 138, 364, 147 and 451 single cell-derived colonies analyzed, respectively, from 5 biological replicates in 4 independent experiments. f Middle line represents median, box limits represent the 25–75 percentiles, whiskers mark the 5–95 percentiles. Cells outside the 5–95 percentiles are marked as outliers. P values calculated with Kruskal–Wallis test with Dunn’s multiple comparisons. g P value calculated with two-sided Fisher’s exact test. ***p < 0.001; **p < 0.01; *p < 0.05; ns, non-significant (p > 0.05). h Biotin proliferation analysis of Vwf-GFP+ HSCs 2 days post IgG or GPIbα treatment. Representative plot (left) and mean ± SD MFI (normalized for MFI of No biotin labeling control; right) from 6 mice per group in 3 independent experiments. **p < 0.01; calculated with two-sided t-test. Long-term reconstitution (16 weeks) of platelet, myeloid and lymphoid cell lineages in blood (i) and of the BM HSC compartment (j) by biotin high and biotin low Vwf-GFP+ HSC fractions 2 days post platelet depletion. 50 cells transplanted per mouse. Data represent mean ± SEM of 4 donors in 2 independent experiments. Each dot represents the mean of 2 recipient mice transplanted per donor. ns, non-significant (p > 0.05); calculated with two-sided t-tests. See also Supplementary Figs. 1 and 2.
We next sought to further explore the mechanistic basis for the HSCs activation observed after platelet depletion. The anti-GPIbα antibody binds to GPIbα (CD42b), the receptor for thrombin and VWF19, leading to platelet activation, desialylation and subsequent clearance in an Fc-receptor independent manner20. GPIbα is specifically expressed in the megakaryocytic (Mk)-platelet lineage, including on MkPs, but importantly for our studies and as previously reported by others21, GPIbα expression is virtually undetectable on HSCs (Supplementary Fig. 1a). Following the initial platelet depletion, platelet numbers slowly recovered, with normal platelet counts being re-established between day 5 and 10 post-depletion (Fig. 1a). Notably, this platelet depletion led to a 4-fold increase in the number of Vwf+ LSKFlt3–CD48–CD150+ HSCs by 2 days, while Vwf– HSCs increased with slower kinetics following an initial reduction (Fig. 1e). Subsequently, the Vwf+/Vwf– HSC ratio and absolute numbers gradually returned back to normal, concomitantly with the normalization of platelet counts (Fig. 1a, e). The increase in Vwf+ HSCs was also accompanied by a selective increase in the numbers of the LSK Flt3–CD48+CD150+ subset of MPPs (Fig. 1b and Supplementary Fig. 1b) shown to be Mk-biased22. Furthermore, MkPs23 were also significantly increased a few days after the increase in Vwf+ HSCs, whereas erythroid (Pre-CFU-E) and myeloid (GMP) progenitors were not significantly affected (Supplementary Fig. 1c, d). Of note, despite their robust GPIbα expression and in agreement with the Fc-independent mechanism by which the antibody leads to platelet depletion20, MkPs were initially slightly (although not significantly) reduced whereas Mks were not depleted in BM by antibody administration (Supplementary Fig. 1d–g). Following the rapid initial activation, HSCs quickly returned back to quiescence with a normalized cell cycle phase distribution being observed already 5 days post platelet depletion (Fig. 1c, d). An alternative monoclonal antibody (NIT E)20 depleted platelets and activated Vwf+ and Vwf– HSC cell cycle in a similar manner as the anti-GPIbα antibody (Supplementary Fig. 2a, b). GPIbα antibody treatment was accompanied by a mild and transient splenomegaly with increased numbers of Vwf+ but not Vwf– HSCs in the spleen (Supplementary Fig. 2c, d).
The recruitment of quiescent LSKFlt3–CD48–CD150+ BM cells into proliferation upon acute platelet activation and depletion implicate the existence of a feedback mechanism by which quiescent HSCs are recruited to re-establish Mk and platelet homeostasis. In order to investigate if HSCs from platelet-depleted mice are more efficient in generating Mks, we used a single-cell Mk/GM in vitro differentiation assay. Clonogenicity of single Vwf+ or Vwf– LSKFlt3–CD48–CD150+ HSCs isolated from mice in homeostasis (IgG) or after platelet depletion (GPIbα) was similar (~80%; Supplementary Fig. 2e). However, single Vwf+ HSCs isolated from platelet-depleted mice differentiated faster into Mks than Vwf– HSCs from platelet-depleted mice or Vwf+ HSCs isolated from mice in homeostasis (Fig. 1f) and also generated a higher number of colonies exclusively consisting of Mks (Fig. 1g and Supplementary Fig. 2f, g). Stem-like Mk-committed progenitors phenotypically resembling HSCs have been previously shown to proliferate in response to poly(I:C)-induced thrombocytopenia24. Therefore, to more definitively establish that LSKFlt3–CD48–CD150+ BM cells induced to proliferate in response to anti-GPIbα induced platelet depletion include true long-term repopulating HSCs, we used doxycycline-inducible (tet-ON) H2B-mCherry mice6,25. In this system, a pulse of doxycycline treatment results in incorporation of mCherry-labeled histones into nucleosomes, which divide equally between daughter cells when cells proliferate. In agreement with the cell cycle analysis (Fig. 1c, d), anti-GPIbα induced platelet depletion resulted in increased proliferation of HSCs, as evidenced by the increased dilution of the mCherry labeling after 3 days (Supplementary Fig. 2h). Importantly, FACS sorted mCherrylo (proliferative) LSKFlt3–CD48–CD150+ cells sorted from platelet-depleted mice had in vivo long-term (LT; 16 weeks) multilineage reconstitution potential (Supplementary Fig. 2i), demonstrating that anti-GPIbα induced platelet depletion recruits potent LT-HSCs into proliferation. To more directly compare Vwf+ HSCs that become activated or that remain in a non-proliferating state following platelet depletion we used a non-invasive labeling method based on the injection of the N-hydroxilsulfosuccinimide biotin derivative (Biotin), which efficiently labels the membrane proteins of all BM cells26. When cells divide, labeled membrane proteins are equally distributed among daughter cells allowing the analysis of cell division history in vivo. Similarly, to the H2B-mCherry model, platelet depletion resulted in reduced biotin-labeling of Vwf+ HSCs (Fig. 1h) and also of Vwf– HSCs (Supplementary Fig. 2j). The differences observed in the cell cycle and proliferation analyses of Vwf– HSCs might potentially reflect the previously described hierarchical relationship between Vwf+ and Vwf– HSCs9. Thus, proliferating Vwf+ HSCs may differentiate into Vwf– HCS, which carry over the history of biotin label dilution. Importantly, FACS sorted Vwf+Biotinlo (proliferative) LSKFlt3–CD48–CD150+ cells sorted from platelet-depleted mice (Supplementary Fig. 2k, l) had in vivo long-term (LT; 16 weeks) multilineage reconstitution potential (Fig. 1i), demonstrating that anti-GPIbα induced platelet depletion recruits potent LT-HSCs into proliferation. While potently replenishing platelets, no significant platelet bias was observed of the Vwf+ HSCs proliferating in response to platelet depletion, in comparison to non-proliferative (BiotinHi) Vwf+ HSCs (Fig. 1i). Regardless, both biotin fractions of Vwf+ HSCs demonstrated similar LT-HSC reconstitution (Fig. 1j) and were overall equally efficient at generating the Vwf+ and Vwf– HSC compartments (Supplementary Fig. 2m). This is in line with functionally defined LT-HSCs being recruited into proliferation and with the fact that the relative proportions of Vwf+ and Vwf– HSCs largely return to normal once homeostasis has been re-established (Fig. 1b, e).
Transcriptional reprogramming of the HSC niche in response to acute platelet depletion
The existence of a feedback mechanism by which quiescent HSCs are recruited into proliferation in response to platelet depletion implies that HSCs in the BM must be able to sense the demand for platelet production. We hypothesized that stromal niche cells in the bone marrow might be involved in this process. In fact, changes in the BM niche after platelet depletion have been previously suggested16,17 but the involvement of specific niche cells in regulating HSC function in this context has not been directly demonstrated. Therefore, we used global RNA-sequencing analysis of previously characterized BM niche cell populations as well as HSCs to investigate possible molecular interactions between these cells, involved in the HSC response to platelet depletion. For this, non-hematopoietic cells were isolated from two described27,28,29 distinct anatomical regions in BM: the central BM (CBM) cells and the bone lining (BL) cells (Supplementary Fig. 3a). Within the CD45–Ter119– non-hematopoietic cells in both BL and CBM fractions, distinct niche cell populations are defined as CD31Hi endothelial cells (EC) and CD31–Lepr+ perivascular cells (PV). In the BL fraction we further defined CD31–Alcam–Pdgfrα+Sca1+ (PαS) mesenchymal progenitors, as well as CD31–Alcam–Sca1–Osx-GFP+ osteoblast progenitors (OBP) and CD31–Alcam+Sca1– osteoblasts (OB) (Fig. 2a, b). Flow cytometric analysis of these cells isolated from mice in homeostasis and 1 day after platelet depletion did not reveal major changes in cellular composition, besides a small but significant increase in CBM-PV cells (Fig. 2a, b). RNA-sequencing analysis showed distinct clustering of the different endothelial, mesenchymal and HSC populations (Supplementary Fig. 3b). The expression of known markers defining the distinct niche cell populations (Fig. 2c and Supplementary Data 1) and, of different hematopoietic regulators clustered by pattern of gene expression (Supplementary Fig. 3c and Supplementary Data 1), further confirmed their distinct cell identities. Additionally, principal component analysis (PCA) of the niche cell populations showed the separation of the endothelial and mesenchymal lineage cells along principal component (PC)1 axis and, a further separation of mesenchymal populations along PC2 axis based on stage of differentiation (Fig. 2d). Differential gene expression analysis, comparing niche cells isolated from mice in homeostasis and 1 day post platelet depletion, showed a high number of differentially expressed (DE) genes in CBM-EC (266 genes) and CBM-PV (249 genes) cells (Fig. 2e, f and Supplementary Data 2, 3). In contrast, a much lower number of DE genes were detected in other niche populations, including the corresponding bone-associated BL-EC and BL-PV) (Fig. 2e, f, Supplementary Fig. 3d, e and Supplementary Data 2–4), suggesting a preferential CBM niche involvement in the response to thrombocytopenia. Gene ontology (GO) analysis performed on the DE genes from CBM-EC highlighted biological processes associated with platelet activation/coagulation (Pf4, Clec1b, P2ry12), response to stress (Iftm3, Litaf, S100a4) and cell adhesion (Vcam1, Ctgf) (Fig. 2g and Supplementary Data 5). GO analysis on CBM-PV DE genes revealed biological processes associated with inflammation and in particular with the cellular response to the pro-inflammatory Interleukin-1 (IL-1) (Fig. 2g and Supplementary Data 5). Other biological processes highlighted in CBM-PV cells were Toll-like receptor (TLR)-4 signaling, for which signaling pathways downstream of the receptor are partially shared with IL-1 signaling, and also mesenchymal differentiation and TGFβ signaling (Vasn, Fst, Wisp2, Cyr61) (Fig. 2f, g).
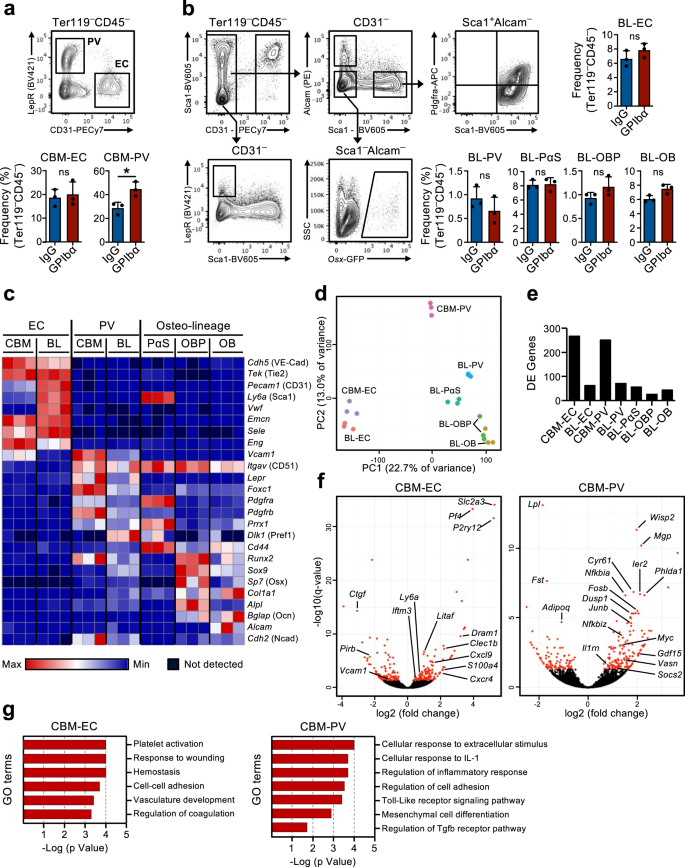
(Related to Supplementary Fig. 3). FACS analysis and gating strategies for sorting of endothelial and stromal cells in the central bone marrow (CBM; a) and bone lining (BL; b) cell compartments of mice 1 day post platelet depletion (GPIbα antibody treatment). Control mice received isotype (IgG) control antibody. Bar diagrams represent mean ± SD frequencies (%) of each cell population among total non-hematopoietic CD45–Ter119– cells. Data are from 3 mice per group in 3 (a) and 2 (b) independent experiments. *p < 0.05; ns non-significant (p > 0.05); assessed by two-sided t-test. c–g RNA-sequencing analysis of the endothelial/stromal cell compartments of mice 1 day post platelet depletion. c Expression (FPKM) of genes characterizing the different niche cell populations. d Principal component analysis of normalized gene expression of the different cell populations investigated. e Number of differentially expressed (DE) genes between IgG and GPIbα treated mice (adjusted p value (q)<0.05), in each niche cell population investigated. f Volcano plots and g gene ontology (GO) terms analysis of genes differentially expressed in CBM endothelial cells (EC) and Lepr+ perivascular (PV) cells. In f, red dots indicate significantly DE genes (q < 0.05. For all panels data represent mean ± SD FPKM of 3 biological replicates from 2 independent experiments. OB osteoblasts, OBP osteoblast progenitors, PαS Pdfgrα+Sca1+ mesenchymal progenitors. See also Supplementary Fig. 3.
IL-1 signaling in non-hematopoietic cells is critical for the HSC response to platelet depletion
Gene set enrichment analysis (GSEA) confirmed the enrichment of genes linked with inflammatory response and IL-1 receptor signaling observed in CBM-PV cells isolated from GPIbα-treated mice (Fig. 3a). These genes included Il1rn (IL-1 target gene and IL-1 signaling pathway antagonist), Socs3 and Dusp1 (regulators of the IL-1 signaling pathway) and Fosb, Junb and Nfkbia (components of pathways activated downstream of the IL-1 signaling cascade) (Fig. 3b). To further investigate a role for sterile inflammation in this process we analyzed the levels of different pro-inflammatory cytokines in the BM extracellular fluid of GPIbα-treated mice. This analysis revealed significantly increased levels of both IL-1α and IL-1β post platelet depletion (Fig. 3c), with kinetics paralleling the expansion and subsequent normalization of Vwf+ HSC (Fig. 1e). A similar initial increase was also seen for TNFα although this was sustained beyond the time at which Vwf+ HSC cell cycle status had normalized (Supplementary Fig. 4a). Other inflammatory cytokines were largely unchanged (IL-6 and IL-12) or decreased at later stages (INFγ) post platelet depletion (Supplementary Fig. 4a). In steady-state, IL-1 has been shown to mainly be produced by circulating T cells (IL-1α) and granulocytes (IL-1β)30. In our datasets analyzing for IL-1 expression both Il1a and Il1b were mostly undetectable in the different niche cell populations as well as in HSCs (Supplementary Fig. 4b), whereas primary Mks (Supplementary Fig. 4c, d) showed high expression, in particular of Il1a (Supplementary Fig. 4b).
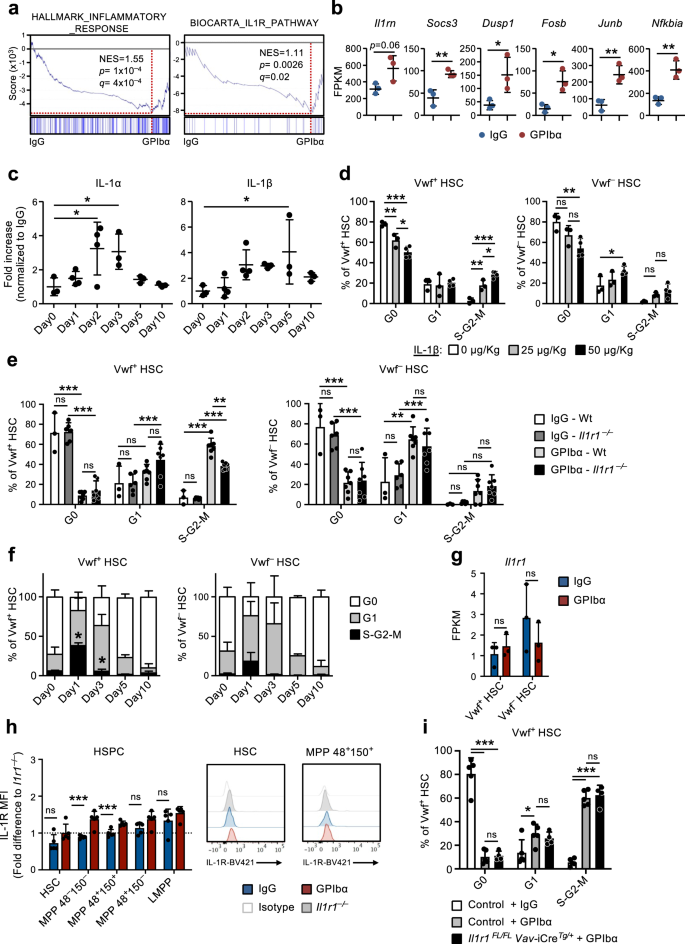
(Related to Supplementary Fig. 5). a Gene set enrichment analysis (GSEA) of global gene expression data from CBM-PV cells for the indicated gene sets. NES, normalized enrichment score (or scaled score). b Expression of IL-1 signaling pathway affiliated genes in CBM-PV cells 1 day post-platelet depletion. Data represent mean ± SD FPKM of 3 biological replicates from 2 independent experiments. **p < 0.01; *p < 0.05 (two-sided t-test). c Mean ± SD levels of IL-1α and IL-1β in bone marrow extracellular fluid isolated from mice at the indicated time points post platelet depletion (GPIbα antibody treatment). Control mice (Day 0) received isotype (IgG) control antibody. Data are from 3 (Day0), 4 (Day1), 4 (Day2), 3 (Day3), 3 (Day5) and 3 (Day10) mice from 4 independent experiments. *p < 0.05 (1-way ANOVA with Dunnett’s multiple comparisons). d Cell cycle analysis of Vwf+ (left) and Vwf– (right) HSCs from mice 1 day post intravenous administration of the indicated amounts of IL-1β. Data are mean ± SD of 3 mice receiving 0 or 25 μg/Kg, and 4 mice receiving 50 μg/Kg IL-1β, in 2 independent experiments. Cell cycle analysis of Vwf+ (left) and Vwf– (right) HSCs from Wt and Il1r1–/– mice 1 day (e) or for HSCs from Il1r1–/– mice at the indicated time points (f) post platelet depletion. e Mean ± SD data from 3 (IgG-Wt), 6 (IgG-Il1r1–/–) 7 (GPIbα -Wt) and 7 (GPIbα –Il1r1–/–) mice from 5 independent experiments. f Mean ± SD frequencies from 6 (Day0), 7 (Day1), 3 (Day3), 3 (Day5) and 3 (Day10) mice in 4 independent experiments. *p < 0.05 (in comparison to same analysis of Wt Vwf+ and Vwf– HSCs in Fig. 1d). g, h Il1r1/IL-1R expression analysis (h) at RNA level by RNA-sequencing (FPKM) in Vwf+ and Vwf– HSCs and (i) at protein level by flow cytometry in HSPCs subsets, isolated from mice in homeostasis or 1 day post platelet depletion. h Mean ± SD FPKM data of 3 biological replicates per condition. i Mean ± SD data of Mean fluorescence intensity (MFI) normalized to the MFI of the equivalent cell population in Il1r1–/– mice analyzed within the same experiment. Data are from 5 mice per condition, in 2 independent experiments. i Cell cycle analysis of Vwf-tdTomato+ HSCs from mice with conditional deletion of Il1r1 in all hematopoietic cells (Il1r1FL/FL Vav-CreTg/+) 1 day post platelet depletion. Controls include Vwf-tdTomato+ HSCs from Il1r1FL/+ Vav-CreTg/+, Il1r1+/+ Vav-CreTg/+ and Vav-Cre+/+ mice (representing genotypes without an IL-1R loss of function). Data represent mean ± SD frequencies of 5 (control-IgG), 5 (control-GPIbα) and 4 (Il1r1FL/FL Vav-CreTg/+-GPIbα) mice from 3 independent experiments. ***p < 0.001; **p < 0.01; *p < 0.05; ns non-significant (p > 0.05); using two-sided t-test (b, g, h) or 2-way ANOVA with Tukey’s multiple comparisons (d–f, i). See also Supplementary Fig. 4.
Administration of recombinant IL-1 to mice resulted in the cell cycle activation of Vwf+ and Vwf– HSCs (Fig. 3d), with Vwf+ HSCs being recruited at a higher extent into the S-G2-M phase of cell cycle (Supplementary Fig. 4e), compatible with IL-1 mediating the HSC activation in response to anti-GPIbα-induced thrombocytopenia. To more specifically investigate this hypothesis, we induced platelet depletion in IL-1R deficient mice (Il1r1–/–), which have a normal HSC compartment30 and normal platelet numbers. Importantly, Il1r1–/– mice showed a significant reduction in the frequency of actively cycling (S-G2-M) Vwf+ HSCs after platelet depletion (Fig. 3e, f), in comparison to GPIbα-treated wildtype (Wt) mice. The fact that Il1r1 deficiency did not completely abrogate cell cycle activation of HSCs in response to GPIbα-treatment suggests that other (IL-1 independent) mechanisms are involved. In agreement with this we previously showed increased levels of THPO in serum 1 day post platelet depletion9. To identify other signals potentially synergizing with IL-1 in the activation of HSCs post platelet depletion we analyzed the expression of known HSC regulators, including Tgfb1 and Pf4, previously implicated in HSC quiescence31,32; and Fgf1, previously associated with HSC proliferation32. RNA-sequencing analysis of distinct niche cell populations revealed a > 20-fold up-regulation of Pf4 in CBM-EC (Supplementary Fig. 4f), while no change in the expression of Tgfb1 and Fgf1 was observed. We further investigated the protein levels of these regulators in the BM extracellular fluid post platelet depletion. In line with the gene expression analysis, TGFβ1 and FGF1 levels were not altered, but PF4 was significantly increased 1 day post GPIbα-mediated platelet depletion (Supplementary Fig. 4g). Given the previously described role of PF4 in inducing HSC quiescence31,33, the observed increased levels of PF4 in BM extracellular fluid are unlikely to explain the activation of HSC proliferation post platelet depletion.
RNA-sequencing revealed very low levels (≈1 FPKM) of Il1r1 transcripts in HSCs (Fig. 3g). Flow cytometric analysis showed undetectable levels of IL-1R protein on HSCs and low levels on several MPP subsets (Fig. 3h and Supplementary Fig. 5a). In addition to the lack of detectable IL-1R expression, none of the IL-1 signaling associated genes upregulated in CBM-PV were found to be upregulated in Vwf+ or Vwf– HSC post GPIbα-treatment (Supplementary Fig. 5b). While we did not observe detectable IL-1R expression in phenotypically defined HSCs, IL-1 has been previously suggested to activate HSCs30. Therefore, to investigate if IL-1 may directly mediate the activation of HSCs post anti-GPIbα-induced thrombocytopenia we induced platelet depletion in Il1r1FL/FL Vav-iCreTg/+ mice which targets deletion of Il1r1 to all hematopoietic cells, including HSCs. Droplet digital PCR analysis of Vwf+ and Vwf– HSCs confirmed >99% deletion efficiency of the Il1r1 floxed alleles by Vav-iCre in both Vwf+ and Vwf– HSC subsets (Supplementary Fig. 5c). Contrary to what we observed in germline Il1r1–/– mice (Fig. 3e, f), Il1r1FL/FL Vav-iCreTg/+ mice showed equally efficient anti-GPIbα-induced cell cycle activation of Vwf+ HSC as in Wt mice (Fig. 3i). Together, these results demonstrate that direct IL-1R signaling through HSCs or other hematopoietic cells is not involved in the distinct cell cycle activation of HSCs in response to platelet depletion and rather implicate a role for non-hematopoietic IL-1 signaling in this process.
Platelet depletion results in activation of IL-1 signaling in perivascular cells
Our studies in Il1r1FL/FLVav-iCreTg/+mice and RNA-sequencing analysis of BM niche cells suggested that IL-1 signaling in niche cells, rather than HSCs or other hematopoietic cells, might play a role in the feedback activation of HSCs after platelet depletion. Among niche cells, CBM-PV cells showed the highest transcriptional levels of Il1r1 expression (Fig. 4a) and also showed distinct IL-1R protein expression, whereas all other stromal/endothelial cell populations were virtually negative for detectable IL-1R cell surface expression (Fig. 4b). In fact, almost all IL-1R expression in CBM could be assigned to Lepr+ PV cells (Fig. 4c), which expressed higher levels of critical HSC regulators such as Cxcl12 and Kitl, in comparison with endosteal IL-1R–/Lo BL-PV cells (Supplementary Fig. 3c). Importantly, the comparison of DE genes in CBM-PV cells from Wt and Il1r1–/– mice in homeostasis and after GPIbα-treatment revealed that the majority of DE genes identified in Wt mice following platelet depletion (Figs. 2f and 3b) were not differentially expressed in CBM-PV cells from platelet-depleted Il1r1–/– mice (Fig. 4d), including the genes directly associated with the activation of the IL-1 signaling pathway (Fig. 4e). In addition to IL-1 signaling related genes, we found evidence for IL-1R-dependent DE of pathways implicated in extrinsic regulation of HSC proliferation, including the TGFβ signaling pathway (Figs. 2g and 4d, f, g)34. This included up-regulation of Vasn (Vasorin), a direct inhibitor of TGFβ signaling35 previously implicated in HSC activation36. Other IL-1R-dependent DE genes included Fst (Folistatin), a direct inhibitor of BMP/Activin signaling37 and previously shown to inhibit Mk differentiation from hematopoietic progenitor cells38, and genes associated with cell adhesion and integrin binding/regulation (Figs. 2f, g and 4d–g).
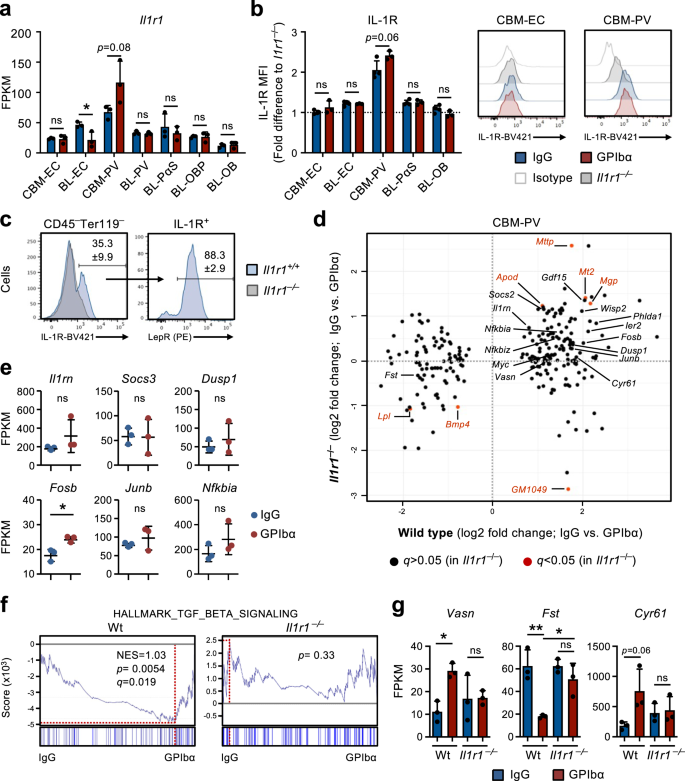
a RNA-sequencing analysis of Il1r1 gene expression (FPKM) in different niche cells isolated from mice in homeostasis (IgG treated) or 1 day post platelet depletion (GPIbα treated). Mean ± SD FPKM data of 3 biological replicates from 2 independent experiments. b, c Flow cytometric analysis of IL-1R expression in different endothelial/stromal cell populations isolated from mice in homeostasis or 1 day post platelet depletion. Mean ± SD data of Mean fluorescence intensity (MFI) normalized to the MFI of the equivalent cell population in Il1r1–/– mice analyzed within the same experiment (b). c Frequency of Lepr+ PV cells in total IL-1R+ CBM non-hematopoietic cells isolated from mice in homeostasis. Data from 4 (IgG) and 3 (GPIbα) mice in 2 independent experiments. d RNA-sequencing analysis of CBM-PV cells isolated from Il1r1+/+ and Il1r1–/– mice in homeostasis and after platelet depletion, for the expression of CBM-PV-GPIbα treatment responsive genes. Data from 3 biological replicates per condition. e Expression of IL-1 signaling pathway affiliated genes in CBM-PV cells isolated from Il1r1–/– mice 1 day post platelet depletion. Mean ± SD FPKM data of 3 biological replicates per condition. GSEA of global gene expression data for the indicated gene set (f) and expression (FPKM; Mean ± SD) of the indicated genes (g), in CBM-PV cells from wild type and Il1r1–/– mice in homeostasis and after platelet depletion. Data from 3 mice per condition. NES, normalized enrichment score (or scaled score). *p < 0.05; **p < 0.01; ns, non-significant (p > 0.05); using two-sided t-test (a, b, e) and 2-way ANOVA with Tukey’a multiple comparisons (g).
IL-1 signaling in perivascular cells is critical for optimal activation of Vwf+ HSC
To more directly investigate the role of IL-1 signaling in CBM-PV cells in the activation of Vwf+ HSCs in response to thrombocytopenia, we induced platelet depletion in mice with conditional deletion of Il1r1 specifically in Lepr+ PV cells (Supplementary Fig. 5d). Il1r1FL/FLLepr-CreTg/+ mice showed a significant reduction in actively cycling (S-G2-M) Vwf+ HSCs, in comparison to anti-GPIbα-treated control mice (Fig. 5a). The reduction in cell cycle activation was comparable to the one observed in germ-line deleted Il1r1–/– mice (Fig. 3e, f), supporting that Lepr+ CBM-PV cells are the main cells involved in IL-1R-dependent activation of Vwf+ HSCs in response to anti-GPIbα-induced thrombocytopenia. Corroborating these findings, administration of recombinant IL-1 to Il1r1FL/FLLepr-CreTg/+ mice resulted in reduced recruitment of Vwf+ HSCs into active S-G2-M (Fig. 5b). Moreover, specific deletion of Il1r1 in Lepr+ PV cells resulted in a small but significant delay in platelet recovery post platelet depletion (Fig. 5c).
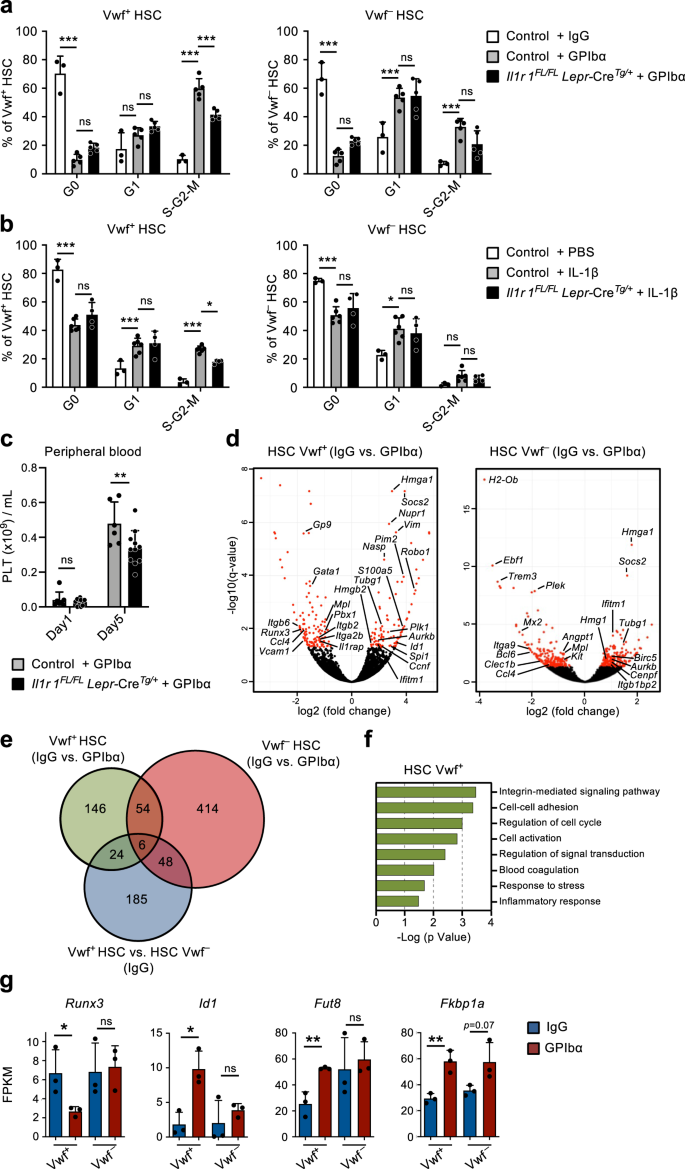
(Related to Supplementary Fig. 6). a–c Analysis of mice with conditional deletion of Il1r1 in Lepr+ perivascular cells (Il1r1FL/FL Lepr-CreTg/+) mice after platelet depletion. Controls include Il1r1FL/+ Lepr-CreTg/+, Il1r1+/+ Lepr-CreTg/+, Il1r1FL/FL Lepr-CreTg/+ (IgG only) and Lepr-Cre+/+ mice. a Cell cycle analysis of Vwf+ and VWF– HSCs 1 day post platelet depletion. Data represent mean ± SD frequencies of 3 (control-IgG), 5 (control-GPIbα) and 5 (Il1r1FL/FL Lepr-CreTg/+-GPIbα) mice from 3 independent experiments. b Cell cycle analysis of Vwf+ and VWF– HSCs from mice 1 day post intravenous administration of 50ug/Kg of IL-1β. Data are mean ± SD of 3 (control-IgG), 6 (control-GPIbα) and 4 (Il1r1FL/FL Lepr-CreTg/+-GPIbα) mice from 3 independent experiments. c Peripheral blood analysis of platelet recovery at the indicated time points post platelet depletion. Mean ± SD platelet numbers from 6 (control) and 11 (Il1r1FL/FL Lepr-CreTg/+) mice in 3 independent experiments. d–g Differential gene expression analysis in Vwf+ and Vwf– HSCs isolated from wild type mice 1 day post platelet depletion (GPIbα treatment). d Volcano plots of genes differentially expressed in Vwf+ and Vwf– HSCs. Red dots indicate genes with significant expression differences (adjusted p value (q)<0.05). e Venn diagram showing number of differentially expressed genes in Vwf+ and Vwf– HSCs post platelet depletion and between these HSC subsets in homeostasis (IgG). f GO terms analysis of biological processes/pathways up-regulated in Vwf+ HSCs after platelet depletion. g Expression (FPKM) of genes associated with Activin/BMP signaling in Vwf+ and Vwf– HSCs from Wt mice in homeostasis and 1 day post platelet depletion. All data (d–g) represent mean ± SD FPKM data of 3 biological replicates per genotype and condition. *p < 0.05; **p < 0.01; ***p < 0.001; ns non-significant (p > 0.05); using 2-way ANOVA with Tukey’s multiple comparisons (a, b), 2-way ANOVA with Sidak’s multiple comparisons (c) and two-sided t-test (g). See also Supplementary Fig. 5.
To gain further insight into how Vwf+ HSCs are recruited into proliferation in response to anti-GPIbα-induced platelet depletion we performed RNA-sequencing of Vwf+ and Vwf– HSCs. RNA-sequencing of Vwf+ HSCs identified 230 differentially expressed genes after platelet depletion, of which 170 were exclusively differentially expressed in Vwf+ and not Vwf– HSCs, and 24 of these already distinguished Vwf+ and Vwf– HSCs in homeostasis, including platelet/Mk lineage associated genes (Fig. 5d, e, Supplementary Fig. 5e, f and Supplementary Data 6, 7). Comparison of Vwf+ and Vwf– HSCs from platelet-depleted mice revealed enrichment of cell cycle activation genes in Vwf+ HSCs, confirming at the molecular level the preferential activation of Vwf+ HSCs in response to platelet depletion (Supplementary Fig. 5g and Supplementary Data 8). Genes differentially expressed in Vwf+ HSCs after platelet activation and depletion are mainly associated with integrin signaling and cell adhesion, known to be regulated by TGFβ signaling39, but also cell cycle, blood coagulation and response to stress/inflammation (Fig. 5d–f). While we cannot exclude the involvement of other signaling pathways in the regulation of these genes, in line with the down-regulation of Fst in CBM-PV cells (Fig. 4g), the candidate Activin/BMP target genes Runx3 and Id140 were respectively down- and up-regulated in Vwf+ but not Vwf– HSCs post platelet depletion (Fig. 5g). Of note, the gene for the α1,6-fucosyltransferase (Fut8) which differentially regulates the activity of the TGFβ and Activin receptors41 and is also a regulator of integrin signaling42 was found up-regulated specifically in Vwf+ HSCs post platelet depletion. In addition, in response to anti-GPIbα-induced platelet depletion Vwf+ HSCs but not Vwf- HSCs up-regulated Fkbp1a, an intracellular regulator of Smad signaling that modulates the intensity and duration of the signals downstream of the TGFβ, Activin and BMP receptors43,44 (Fig. 5g). Together with the down-regulation of Fst in CBM-PV cells (Fig. 4g), these data suggest that a shift from quiescence-reinforcing TGFβ signaling to activating Activin/BMP signaling may lead to alterations in integrin activity, cell adhesion and cell cycle status of HSCs in response to acute platelet activation and depletion.
Platelet activation is essential for the HSC response to platelet depletion
The gene expression analysis of CBM-ECs revealed several genes up-regulated upon platelet depletion that are associated with platelet activation and coagulation (Fig. 2f, g). This is in line with the mechanism by which platelets are frequently consumed45, here mimicked by GPIbα-mediated platelet depletion, which functions by inducing Fc-independent platelet activation, leading to platelet sialidase neuraminidase-1 (NEU) translocation to the membrane, desialylation and subsequent clearance in the liver20. Moreover, platelets are recognized as important mediators of inflammation46,47 and rapidly upregulate IL-1 protein expression upon activation (Fig. 6a), as previously shown by others48,49,50. This supports a role for platelet activation and subsequent consumption in mediating the herein observed IL-1-dependet activation of Vwf+ HSCs in response to thrombocytopenia. To further investigate this possibility we treated mice with NEU51, which similarly to the GPIbα-treatment (Fig. 1a) leads to efficient platelet depletion (Fig. 6b) but bypasses platelet activation20. While GPIbα-treatment efficiently activated platelets in vitro, as measured by surface P-Selectin (CD62P) staining, in vitro NEU treatment resulted only in a very mild platelet activation, and only at high concentrations (Fig. 6c). In vitro NEU activity was however confirmed by Ricinus communis agglutinin I (RCA-1) labeling (Fig. 6d), which specifically binds to desialylated proteins20. Despite depleting platelets in vivo with the same efficiency, unlike anti-GPIbα treatment NEU treatment did not result in HSC cell cycle activation (Fig. 6e) nor did it significantly increase the numbers of Vwf+ or Vwf– HSCs (Fig. 6f), LSK Flt3–CD48+CD150+ MPPs, pre-MegE and MkPs in BM (Supplementary Fig. 6a, b). Of note, in NEU treated mice the levels of IL-1α and IL-1β in BM remained largely unchanged (Fig. 6g). These results suggest that rather than the mere loss of platelets, anti-GPIbα activation-induced depletion of platelets is involved in the observed IL-1-dependent activation of HSCs. Previous studies implicated a role for Mks and their secreted factors in the regulation of HSC quiescence/proliferation31,32,33,52. Since Mks also express GPIbα, to more specifically demonstrate a role of platelets in the observed HSC activation in response to anti-GPIbα antibody treatment, independently of Mks, we administered the anti-GPIbα antibody to mice in which platelets had been efficiently depleted with NEU-treatment (Fig. 6b), which does not alter the number of Mks33. This sequential NEU-GPIbα treatment resulted in reduced cell cycle activation of Vwf+ HSCs, when compared to GPIbα treatment alone (Fig. 6h), confirming the involvement of platelets in this process. However, the fact that some HSC activation was observed in mice with NEU-depleted platelets, when compared to control mice with normal platelet numbers (Figs. 1d and 3e), also supports a role of Mks in the observed HSC activation in response to anti-GPIbα antibody treatment.
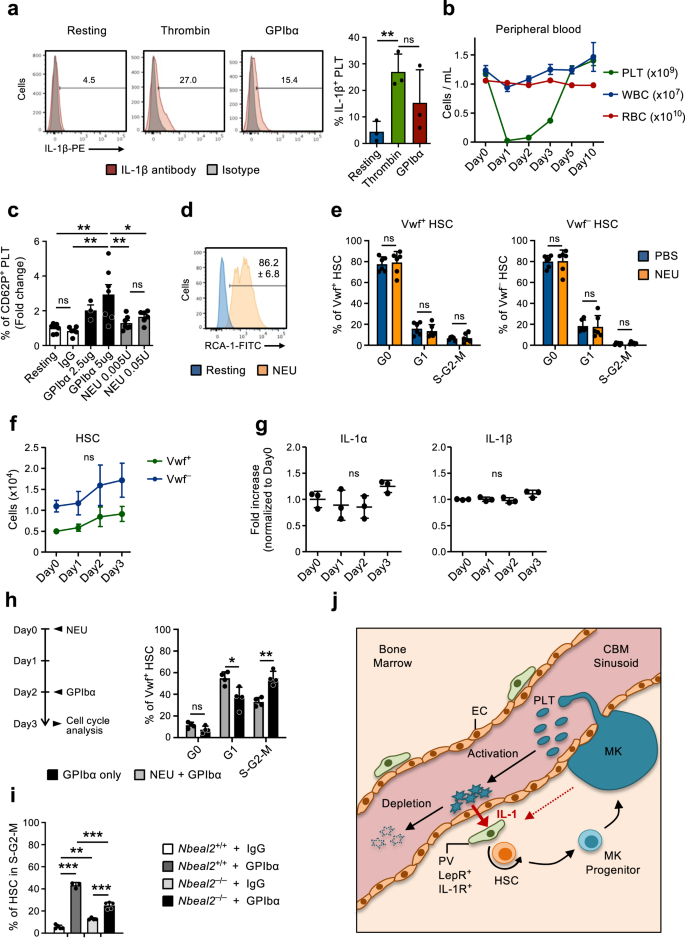
(Related to Supplementary Fig. 4). a Expression of IL-1β in platelets resting or after in vitro activation (3hrs) with thrombin or GPIbα antibody. (Left), representative FACS profiles. Numbers in plots are average frequencies from 3 independent experiments. (Right) Frequency of IL-1β+ platelets; mean ± SD of 3 biological replicates per condition in 3 independent experiments. Each biological replicate consists of platelets pooled from 2-3 mice. b Kinetics analysis of peripheral blood cell lineages following in vivo Neuraminidase (NEU) administration. Data represent mean ± SEM of 10 (Day0), 7 (Day1), 8 (Day2), 9 (Day3), 6 (Day5) and 3 (Day10) mice from 6 independent experiments. PLT platelets, WBC white blood cells, RBC red blood cells. c Expression of surface P-selectin (CD62P) on platelets measured by flow cytometry after in vitro incubation with GPIbα antibody or NEU, at the indicated concentrations. Data represent mean ± SD fold changes of % CD62P+ cells in each condition in relation to untreated (resting) platelets, of 7 (Resting), 6 (IgG), 3 (GPIbα-2,5ug), 7 (GPIbα-5ug), 7 (NEU 0.005U) and 6 (NEU 0.05U) mice in 3 independent experiments. d In vitro neuraminidase (NEU) activity in resting platelets or after 30 min treatment with NEU, analyzed by RCA-1 binding. Representative profile from 1 out of 3 biological replicates. Numbers indicate mean ± SD % RCA-1+ platelets. e Mean ± SD cell cycle phase distribution of Vwf+ (left) and Vwf– (right) HSCs 1 day post platelet depletion with NEU. Data from 6 mice per condition, in 3 independent experiments. f FACS-based assessment of the HSC compartment in bone marrow of mice at the indicated time points after platelet depletion with NEU. Data represent absolute numbers of Vwf-GFP+ (Vwf+) or Vwf-GFP– (Vwf–) HSCs (average ±SEM) at the indicated time points after platelet depletion. Data are from 5 (Day0), 4 (Day1), 5 (Day2) and 6 (Day3) mice in 4 independent experiments. No significant changes were observed in numbers of Vwf+ or Vwf– HSCs at any time point. g Mean ± SD levels (fold-increase relative to Day0) of the indicated cytokines in bone marrow extracellular fluid isolated from mice at the indicated time points post platelet depletion with Neuraminidase. Data from 3 mice per time point in 2 independent experiments. h Mice were treated with NEU at day 0, followed by GPIbα antibody administration at day 2 and analyzed at day 3 (left) for cell cycle phase distribution in Vwf+ HSCs (right). Control mice were treated only with GPIbα antibody and analyzed 1 day later. Data represent mean ± SD frequencies of 4 mice per group in 2 independent experiments. i HSCs in S-G2-M in Nbeal2–/– mice 1 day post platelet depletion (GPIbα). Data represent mean ± SD cell frequencies of 5 (Wt-IgG), 3 (Wt-GPIbα), 4 (Nbeal2–/–-IgG) and 5 (Nbeal2–/–-GPIbα) mice per condition from 3 independent experiments. j Scheme depicting the feedback mechanism proposed. While being consumed activated platelets secrete IL-1, which activates IL-1R expressing PV cells to induce HSC proliferation and differentiation toward the platelet lineage. As indicated, Mks may also contribute to the described recruitment of HSCs into proliferation in response to treatment with the anti-GPIbα antibody resulting in activation-dependent platelet depletion. For all data ***p < 0.001; **p < 0.01; *p < 0.05 (Only indicated for significant differences) using 1-way ANOVA with Tukey’s multiple comparisons (a, c, f, i), 2-way ANOVA with Sidak’s multiple comparisons (e, h) or Dunnett’s multiple comparisons (g); ns non-significant. See also Supplementary Fig. 6.
Platelets store multiple inflammatory modulators in platelet granules, which are released upon platelet activation53,54. To further investigate if the release of platelet granule contents is required for GPIbα-mediated HSC activation we induced platelet depletion (GPIbα treatment) in mice deficient for Nbeal2 (Nbeal2–/–), which lack platelet α-granules55. Nbeal2–/– mice have overall normal hematopoiesis despite a small decrease in platelet numbers and a slight increase in HSCs (Supplementary Fig. 6c–e). One day following anti-GPIbα-treatment Nbeal2–/– mice had a significantly reduced frequency of actively cycling HSCs when compared to Wt mice, despite of a higher frequency of HSCs being in cycle prior to treatment (Fig. 6i). Together, these findings suggested that IL-1 and other regulators secreted upon platelet activation may play a role in regulating the activation of HSCs in response to thrombocytopenia.
- SEO Powered Content & PR Distribution. Get Amplified Today.
- PlatoData.Network Vertical Generative Ai. Empower Yourself. Access Here.
- PlatoAiStream. Web3 Intelligence. Knowledge Amplified. Access Here.
- PlatoESG. Carbon, CleanTech, Energy, Environment, Solar, Waste Management. Access Here.
- PlatoHealth. Biotech and Clinical Trials Intelligence. Access Here.
- Source: https://www.nature.com/articles/s41467-023-41691-y

