CITE-seq provides a comprehensive representation of EHT
To define factors in the endothelium that prime cells towards a hemogenic phenotype, we performed CITE-seq on CD31+ FACS-isolated cells from the AGM of E10.5 wildtype (WT) embryos to isolate all EC and IAHC cells, rather than risk potential loss with additional pre-selected markers. Antibodies against CD44, CD117, CD41, CD43, CD27, and CD45 were used to identify populations of EC, HE, and pre-HSPC at various stages of the EHT process1,3,4,5,6,16. Unsupervised clustering of single-cell transcriptomes showed distinct populations of EC (expressing Cdh5 (VE-Cadherin) and Eng (CD105, Endoglin)), cells undergoing EHT that expressed both endothelial and hematopoietic genes (ie: Runx1, Gfi1, Spi1), and mature hematopoietic cells (expressing Ptprc (CD45) and other lineage markers) (Fig. 1A, B). These mature hematopoietic cells, including erythro-myeloid progenitors (EMPs), are likely derived from early hematopoiesis in the yolk sac but may also represent a few mature cells generated at this stage from the EHT process. Multiple subpopulations of EC were present in the dataset and these were further classified based on expression of venous (vEC) and arterial (aEC) markers (Supplementary Fig. 1A, B).
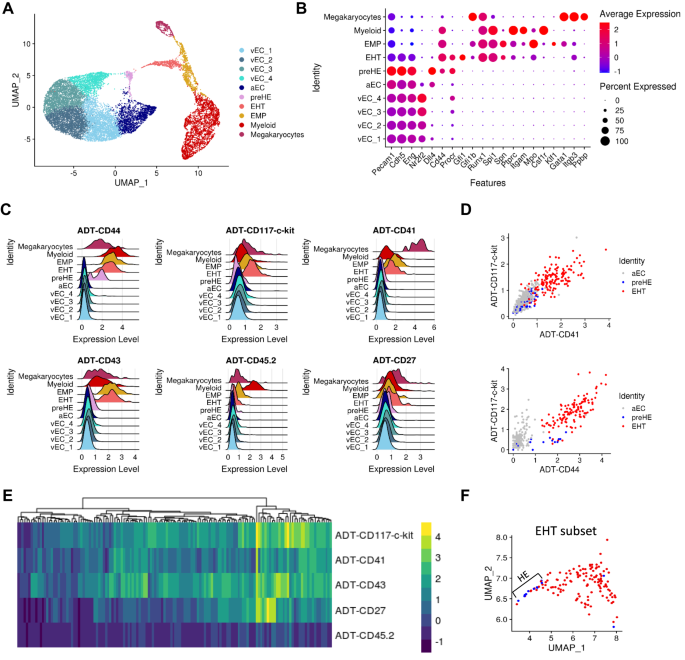
A UMAP representation of single-cell unsupervised clustering based on transcriptome data. B Genes associated with each cluster in (A) that identify cell types. C, D Expression of antibody-derived tag (ADT) for (C) each cluster previously identified represented by ridge plots and D scatter plots of the relevant subpopulations. E Heatmap of surface expression, based on ADT, of the selected markers on cells forming the EHT cluster. F Identification of phenotypic HE within the “EHT’ subcluster on a UMAP projection. Cells labeled in blue are negative for CD117, CD41, CD43, and CD45 based on ADT expression and red cells expressed at least one of the EHT markers.
In addition to EC and EHT clusters, the CITE-seq data revealed a small population of pre-hemogenic EC (pre-HE) similar to those recently described by Zhu et al.18. (Supplementary Fig. 1C, D). These cells followed a pseudotime trajectory towards EHT (Supplementary Fig. 1E), and had high expression of endothelial markers but additionally expressed Cd44, a marker recently associated with hemogenic potential16, along with higher levels of Procr (CD201)17 compared to other EC subsets (Fig. 1B and Supplementary Fig. 1F). Pre-HE cells lacked the prototypic HE markers Runx1 and Gfi1, thus distinguishing these two populations (Fig. 1B and Supplementary Fig. 1G).
The additional immunophenotypic information provided by CITE-seq confirmed the expected subpopulations of EC, expressing negligible to no level of the selected surface markers, as well as cells undergoing EHT, which showed variable expression of CD117 and CD41 while upregulating CD43 and CD45 (Fig. 1C–E and Supplementary Fig. 1H). Phenotypic HE cells expressing CD31+CD117−CD41−CD43−CD45− and both Runx1 and Gfi1 were located at the extremity of the EHT cluster closest to pre-HE cells in UMAP space (Fig. 1F and Supplementary Fig. 1I). Of note, the presence of these HE cells represented a small fraction of the EHT cluster (13 out of 140 EHT cells), consistent with a potentially rapid transition to a pro-/pre-HSPC phenotype18. Most cells forming the EHT cluster were therefore IAHC, expressing both Runx1 and Gfi1 at the transcriptomic level and at least one phenotypic surface marker, CD117 or CD41 (Fig. 1E). In addition, we observed that the pre-HE cells of interest are indistinguishable from the remaining endothelium by surface protein expression of the typical phenotypic markers CD117 and CD41 (Fig. 1C, D). However, the addition of CD44 antibody showed selective enrichment for this small subset of pre-HE cells that we can now define as being CD31+CD44+CD117−CD41−CD43−CD45− (Fig. 1C, D), and which represent an intermediate stage between the bulk population of aEC and cells undergoing EHT, as supported by in silico trajectory analysis (Supplementary Fig. 1E). Thus, CITE-seq identified distinct subsets of the endothelial and hematopoietic populations relevant to EHT together with single-cell gene expression data.
Meis1 is upregulated in early pre-HE cells prior to EHT
Compared to aEC, 425 and 317 genes were upregulated and downregulated respectively in pre-HE (adjusted p-value < 0.1; Fig. 2A). The signature of upregulated genes was enriched for several pathways previously reported to be important for EHT such as TGF-β and Notch pathways, and inflammatory signaling (Supplementary Fig. 2A). In addition, gene ontology (GO) analysis identified the enrichment of genes related to hematopoiesis which further highlighted the hemogenic potential of these cells as compared to the aEC cluster (Supplementary Fig. 2A). Consistent with the pre-hemogenic nature of these cells, pre-HE maintained a high expression score of genes related to angiogenesis, compared to EHT cells and also showed a progressive upregulation of the definitive hemopoiesis gene signature (Supplementary Fig. 2B).
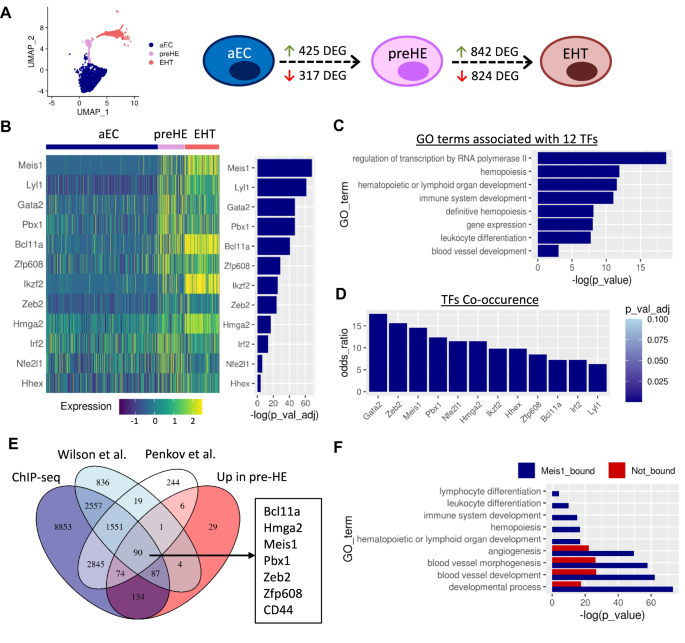
A UMAP representation of the aEC, preHE, and EHT clusters only and schematic showing the number of DEG between each cell population along the transition. B Heatmap showing expression of the 12 TFs enriched in pre-HE cells compared to aEC, ranked by significance (Wilcoxon rank sum test (two-sided) with Bonferroni correction for adjusted p-values). C Selected GO terms associated with the 12 TFs identified in B (hypergeometric p-value with g:SCS correction using the default settings in gprofiler2). D Co-occurrence of the 12 TFs in B with the 425 pre-HE enriched genes, based on EnrichR analysis (p-values based one-sided Fisher’s exact test with Benjamini-Hochberg correction). E Overlapping genes between our Meis1 ChIP-seq dataset, published ChIP-seq datasets, and genes enriched in pre-HE vs aEC in the CITE-seq data. F Selected GO terms associated with pre-HE enriched genes categorized based on the presence of Meis1 binding sites in ChIP-seq data (hypergeometric p-value with g:SCS correction using the default settings in gprofiler2).
To look for drivers of cell fate, we focused on transcription factors (TFs). Of the 425 upregulated genes, 12 TFs were identified as being significantly enriched in pre-HE vs aEC and persisting through EHT (Fig. 2B). GO term analysis showed enrichment of these 12 TFs for biological processes associated with transcription and hematopoiesis (Fig. 2C). Therefore, we hypothesized that early expression of these TFs might govern the endothelial switch associated with hemogenic potency. Of the 12 TFs, Meis1 ranked as being the most significantly enriched, with its binding partner Pbx1 ranked fourth (Fig. 2B).
Separately, we performed bulk RNA-seq to identify upstream TFs present in the HE based on the rationale that these TFs might be important for driving pre-HE cells into the HE state. To this end, we used the Runx1+23GFP reporter mouse as a well-established tools to enrich for HE cells in the AGM9. A total of 228 transcription factors (TFs) were specifically enriched in CD31+CD117−CD45−Runx1+23GFP+ HE cells compared to vascular EC in the mouse AGM at E10.5. To find candidate upstream regulators that potentially drive the expression pattern observed in HE cells, Distant Regulatory Element (DiRE)28 analysis was performed on the HE-enriched TFs, which resulted in a list of 9 enriched TFs that bind regulatory elements associated with co-expressed HE genes. These 9 TFs included Meis1 and its binding partners Pbx1 and Hoxa9 (Supplementary Fig. 3). Therefore, two different approaches identified Meis1 as enriched in the early stage of pre-HE/HE specification.
Meis1 binds genes associated with hemogenic specification
Given the prediction that Meis1 can regulate the expression of other HE-enriched TFs in our dataset, we hypothesized that Meis1 may be required to drive early hemogenic specification. Co-expression data from the EnrichR webserver29 revealed that both Meis1 and Pbx1 were among the top TFs to co-occur with the 425 pre-HE-enriched genes (Fig. 2D), overlapping with 64 and 57 genes respectively.
We next performed ChIP-seq in primitive EPCR+CD150+CD48−lin− adult hematopoietic cells transduced with a Meis1-YFP vector to identify direct Meis1 targets, resulting in binding peaks mapping to 16,198 nearby genes based on sequence proximity. We compared the list of genes associated with Meis1 binding sites to two publicly available ChIP-seq datasets based on endogenous Meis1 expression: one performed in HPC7 mouse hematopoietic progenitor cells30 and the other in E11.5 mouse embryos31. Genes were considered bound by Meis1 if they were found in common between at least two of the three datasets. Over 59% (252/425) of the genes upregulated in pre-HE cells compared to aEC were associated with Meis1 binding sites (Fig. 2E). These genes included 11 of the 12 hemogenic TFs that we previously identified in pre-HE compared to aEC, placing Meis1 as a major candidate upstream regulator. Promoters of 52 of the 64 genes frequently co-expressed with Meis1 based on EnrichR analysis were bound by Meis1 based on ChIP-seq, supporting a role for Meis1 in driving aEC towards a hemogenic fate.
Compared to aEC, the pre-HE gene signature was enriched for GO terms related to hematopoiesis (Supplementary Fig. 2A). Interestingly, GO term analysis showed an association of biological processes related to the development of the hematopoietic system only in the fraction of pre-HE genes that are predicted to be bound by Meis1 (Fig. 2F). On the other hand, genes related to angiogenesis and developmental processes were more broadly distributed between the Meis1-bound and unbound fractions (Fig. 2F). Thus, genes related to the development of the hematopoietic system that are expressed in pre-HE cells are also direct Meis1 targets, suggesting that Meis1 primes aEC for hemogenic commitment by acting as an upstream regulator of hematopoietic gene expression. Several genes downregulated during the transition to pre-HE are also found in proximity to Meis1 binding sites (Supplementary Fig. 4). While these genes enriched for more generalized biological GO terms, the list included angiogenic and Wnt-related genes that need to be downregulated for EHT to proceed (Supplementary Fig. 4). Meis1 may also have a potential repressive role on endothelial fate through a few key genes.
Meis1 is highly expressed in IAHC and the surrounding endothelium in vivo
To validate the role of Meis1 in hemogenic EC specification, we used a Meis1 GFP-reporter mouse model (Fig. 3A) where a GFP-P2A-HA tag is inserted upstream of the Meis1 transcriptional start site32. GFP faithfully recapitulates Meis1 expression without altering its function due to a 2A-self-cleavage reaction during translation (Supplementary Fig. 5A, ref. 32). In the E10.5 AGM, GFP was highly expressed in all IAHC and in a subset of EC of the dorsal aorta, as well as in the subaortic mesenchyme (Fig. 3B). Consistent with a role in IAHC emergence, GFP+ EC were enriched in sections of the dorsal aorta underlying IAHC as opposed to GFP− EC that could be seen on long sections devoid of IAHC (Fig. 3B). Similarly, analysis by flow cytometry confirmed ubiquitous high expression of Meis1 in phenotypic pre-HSPC (CD31+CD41lowCD45−/+) (Fig. 3C, D), as observed in the CITE-seq data (Fig. 3E). Consistent with the immunostaining, most EC (CD31+CD41−CD45−) were GFP− by flow cytometry with a distinct smaller subset of GFP+ EC (Fig. 3C). Within the bulk EC compartment, GFP was almost exclusively expressed in CD44+ EC confirming that Meis1 labeled the CD44+ pre-HE fraction of the endothelium at E10.5 (Fig. 3F), thus validating at the protein level in vivo the Meis1 expression pattern observed at the transcript level in the CITE-seq data at E10.5 (Fig. 3E).
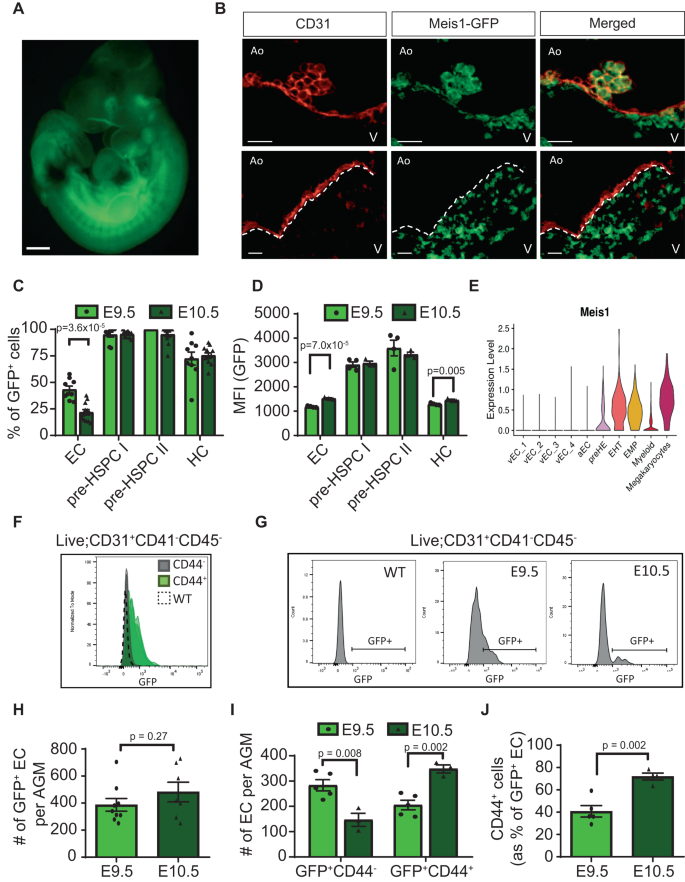
A Representative image of more than 50 Meis1-GFP embryos dissected at E10.5 (scale bar = 500 µm). B Immunostaining of cross-sections of the dorsal aorta at E10.5 showing the expression of CD31 (red) and Meis1-GFP (green). The dotted line in the lower panels demarcates the endothelial layer from the subaortic mesenchyme. (Ao: Aorta, V: Ventral, scale bar = 20 µm). N = 7 embryos over 4 independent experiments. C Percentage of cells expressing Meis1 in defined cell populations based on GFP fluorescence by flow cytomerty (n = 9 at E9.5 and n = 12 at E10.5) and (D) associated GFP MFI values (n = 4 at E9.5 and n = 3 at E10.5 from the same experiment). Viable cells were gated as follows: EC: CD31+CD41−CD45−, pre-HSPC I: CD31+CD41lowCD45−, pre-HSPC II: CD31+CD41lowCD45+, hematopoietic cells (HC): CD31−CD45+. Data are presented as mean ± SEM and each data point represents a different embryo. E Violin plot depicting Meis1 mRNA expression in various CITE-seq subpopulations. Meis1 expression was detected at low level in 9.9% of all EC. F Histograms showing Meis1-GFP expression by flow cytometry in CD44− and CD44+ EC (n = 4 for each group). WT represents a wildtype (GFP−) embryo. G Representative histograms of GFP fluoresence by flow cytometry in AGM EC at various time points. H Total number of GFP+ EC per AGM at E9.5 (n = 9) and E10.5 (n = 7) and (I) EC numbers subdivided according to CD44 co-expression (n = 5 at E9.5, n = 3 at E10.5) based on counting beads by flow cytometry. For the absolute cell number, one E10.5 data point was removed based on the Grubb test to identify outliers. J Proportion of GFP+ EC co-expressing CD44 at E9.5 (n = 5) and E10.5 (n = 4). Data are presented as mean ± SEM and each data point represents a different embryo. All indicated p-values were calculated using a two-sided t-test comparing two groups. Source data are provided as a Source Data file.
While IAHC are prominent in the E10.5 dorsal aorta, specification of the HE precedes cluster formation. Tracking Meis1 expression at an earlier time point showed a relatively higher proportion of GFP+ cells at E9.5 compared to E10.5 specifically within the EC compartment (Fig. 3C, G). Although, no difference was observed in absolute GFP+ EC number between the two time points (Fig. 3H), E10.5 GFP+ EC showed increased Meis1 expression with the initiation of EHT (Fig. 3D, G). CD44 expression temporally followed Meis1 expression in GFP+ EC as suggested by the increased numbers of CD44+ cells in the GFP+ EC from E9.5 to E10.5 (40% vs 72%, Fig. 3I, J). This temporal increase in frequency of CD44+ cells implicates a progression from an early GFP+CD44− precursor at E9.5 to GFP+CD44+ pre-HE cells at E10.5, given that the absolute number of GFP+ EC between the two time points is similar. Supporting this point, E9.5 GFP+CD44− cells have already upregulated pre-HE genes, that are also Meis1 targets, as compared to GFP−CD44− EC but do not yet express HE genes (Supplementary Fig. 5B, C). These findings suggest that Meis1 is an early driver of hemogenic specification.
Runx1 + HE cells emerge from Meis1 + endothelium in vivo
The observed expression pattern argues that only the Meis1-GFP+ EC have hemogenic potential and that Meis1 might be important in the early specification of CD44+ pre-HE cells. To investigate this, GFP− EC and GFP+ EC were FACS-isolated from dissociated E10.5 AGM to further characterize these two populations (Fig. 4A and Supplementary Fig. 8A). Consistent with our hypothesis, expression of the EHT-related genes Runx1, Gfi1, and Spi1 was exclusively detected in GFP+ EC (Fig. 4B), indicative of the presence of HE cells only within the Meis1-expressing population. While Runx1 expression was entirely contained within Meis1-GFP+ EC (Fig. 4B), Meis1 was more broadly expressed and detected at lower levels in Runx1+23GFP− EC from the AGM at E10.5 (Fig. 4C). This observation was consistent with the CITE-seq data (Fig. 4D) and reinforces the fact that Meis1-expressing EC include both pre-HE and HE cells, and precede Runx1 expression (Fig. 4D). Fluorescent imaging confirmed that Meis1 expression was detected in all emerging Runx1+ HE in vivo, but also in Runx1− EC in an extended region flanking Runx1+ HE (Fig. 4E and Supplementary Fig. 6), consistent with the idea that HE cells arise from a Meis1-expressing EC precursor in vivo.
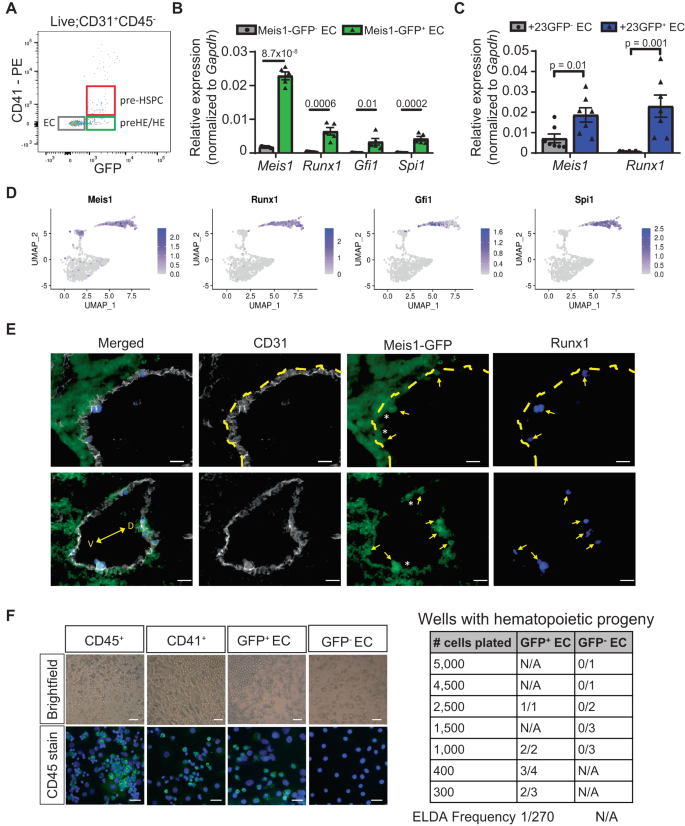
A Representative flow cytometry scatterplot gated for relevant subsets within the viable CD31+CD45− population. B, C mRNA expression of selected EHT-related genes in FACS-isolated GFP− and GFP+ EC from E10.5 AGM of (B) Meis1-GFP embryos (n = 5 pools of 4 embryos each from the same litter) and (C) Runx1+23GFP embryos (n = 7 pools of 3 embryos each). Quantification was performed by ddPCR and normalized to Gapdh. Bar-plots are showing the mean ± SEM. Indicated p-values were calculated using a two-sided t-test comparing two groups. D UMAP projections of the aEC, pre-HE, and EHT clusters showing the expression of selected genes in the CITE-seq data. E Immunostaining of the dorsal aorta from E10.5 Meis1-GFP embryos (gray: CD31, green: GFP, blue: Runx1, V: ventral, D: dorsal). Arrows point to Runx1+ cells and asterix (*) denotes adjacent Meis1-GFP+Runx1− EC. The dotted line delineates the endothelial layer from the subaortic mesenchyme in upper panels. Scale bar = 20 µm. Staining was reproduced in 2 independent experiments. F Ex vivo differentiation assay on an OP9 stromal layer to assess hematopoietic colony formation from FACS-isolated GFP+ and GFP− EC. Representative brightfield images (above, scale bar = 50 µm) of hematopoietic colonies formed and confirmation of CD45 expression by immunofluorescence staining (below, scale bar = 25 µm). The table on the right shows the number of colony-positive replicates at the endpoint for the various initial cell inputs tested. The frequency of HE cells was assessed using extreme limiting dilution assay (ELDA) calculation. Source data are provided as a Source Data file.
Neither Meis1-GFP nor CD44 individually are able to separate pre-HE cells from HE cells. Ideally, a combination of surface markers would distinguish between and facilitate the isolation of pre-HE from HE. Based on our CITE-seq data and a published dataset18, we identified two potential candidate surface molecules, CD200 and Notch4, that are expressed in EC and pre-HE but not in HE and EHT cells (Supplementary Fig. 7A). Compared to E10.5 CD44− EC, cells co-expressing CD44 and either CD200 or Notch4 showed higher levels of genes upregulated in the CITE-seq pre-HE population (Supplementary Fig. 7B–E and Supplementary Fig 5C). On the other hand, HE genes were upregulated in CD44+CD200− and CD44+Notch4− cells and more strongly expressed in pre-HSPC (Supplementary Fig. 7F, G). Unlike Runx1, Meis1 is strongly expressed in both CD44+CD200− or CD44+Notch4− and CD44+CD200+ or CD44+Notch4+ cell fractions, consistent with a requirement for Meis1 in pre-HE prior to Runx1 upregulation during early EHT.
To demonstrate functionally that only Meis1-GFP+ cells have the potential to undergo EHT, E10.5 GFP+ and GFP− EC were co-cultured ex vivo on OP9 feeder cells in media with cytokines supportive of hematopoiesis (Fig. 4F and Supplementary Fig. 8B). CD41+ pre-HSPC and CD45+ hematopoietic cells were included as controls (Supplementary Fig. 8A, B) to confirm that this culture system can promote differentiation of CD31+CD41lowCD45− cells into CD45+ cells and maintain them in culture. Colonies of round CD45+ hematopoietic cells emerged from CD31+CD41−CD45−GFP+ EC at 5 days, but were totally absent in wells containing GFP− EC (Fig. 4F) regardless of the initial number of cells plated, implying that expression of Meis1 is required to generate functional HE cells. Importantly, the Meis1 gene locus is genetically unaltered in this model, therefore GFP− cells still have the potential to spontaneously upregulate Meis1 expression if required at a later stage during the culture. The fact that none of the GFP− EC subsequently formed hematopoietic colonies ex vivo in differentiation-permissive medium supports the contention that Meis1 activation is required at early stages of EHT, prior to the formation of pre-HSPCs.
Meis1 expression is required for pre-HE/HE formation
To investigate a functional requirement for Meis1 in EC, we conditionally deleted Meis1 using a Cre recombinase driven by the VE-Cadherin (VEC) promoter33 to generate Meis1flox/flox;Cre (Mf/f;Cre) embryos (Supplementary Fig. 9) and littermates lacking Cre expression hereafter referred to as “WT”. To quantify the frequency of HE cells, we co-cultured with OP9 FACS-isolated EC from single embryos into multiple wells of a 96-well plate, at a limiting dilution of 100 cells per well (Fig. 5A). Significantly fewer cells from E9.5 Mf/f;Cre embryos produced hematopoietic colonies compared to WT littermates (Fig. 5B), supporting a requirement for Meis1 in emergence of functional HE. Confirming that the defect in Meis1-null EC was present at the HE level, gene expression analysis performed on FACS-isolated EC showed a significant reduction in key markers of HE cells (Runx1, Gfi1, and Spi1) (Fig. 5C), expressed exclusively in Meis1-GFP+ EC (Fig. 4B).
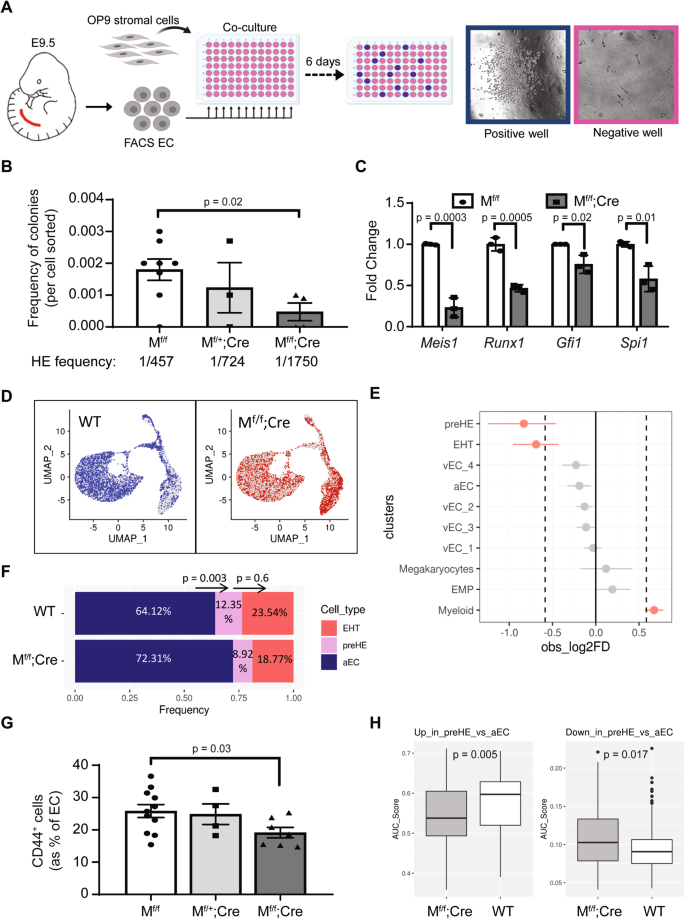
A Schematic representation of the ex vivo co-culture assay used to quantify the frequency of HE cells (created with BioRender.com) and B frequency of functional HE cells in E9.5 AGM (n = 8 Mf/f, 3 Mf/+;Cre, 4 Mf/f;Cre). Each dot in B represents the outcome of 1 embryo and the average frequency of HE cells was approximated using the Extreme Limiting Dilution Assay (ELDA) software48. C mRNA expression of selected EHT-related genes in FACS-isolated viable EC (CD31+CD41−CD45−) from E10.5 AGM. Quantification was performed by ddPCR and normalized to Gapdh (n = 3 independent replicates per genotype). In B and C, data are presented as mean ± SEM and p-values were calculated using a two-sided t-test comparing two groups. D Representation of WT (blue) and Mf/f;Cre (red) cells in UMAP space based on unsupervised clustering. Cells from the opposite genotype are represented in gray. E Analysis of the difference between the proportion of WT and Mf/f;Cre cells found in each cluster of the CITE-seq data, using scProportionTest package (permutation test; n = 1000). The populations were considered over-/under-represented at a cutoff fold-difference > |1.5| (log2FD > |0.58|; dotted line) and significant based on FDR < 0.05 (red dots). Data are presented as mean ±95% confidence interval (n = 8423 WT cells from five independent samples and n = 6745 Mf/f;Cre cells from three independent samples). F Relative proportions of aEC, pre-HE, and EHT cells in WT and Mf/f;Cre samples. A two-proportion Z-test (two-sided) was performed comparing the cell ratio in adjacent clusters to assess the difference between genotypes in cells transitioning from aEC to pre-HE and pre-HE to EHT (p-values are displayed above the bars). G Quantification of CD44+ pre-HE cells in E9.5 AGM by flow cytometry (n = 11 WT, 4 Mf/+;Cre, and 7 Mf/f;Cre). Data are presented as mean ± SEM and each data point represents a different embryo (p-value based on two-sided t-test). H Gene expression scores for pre-HE gene signatures (up (left panel) or down (right panel)) in individual pre-HE cells from WT and Mf/f;Cre samples, calculated using AUCell. Box-plots display the median (center line), the 25th and 75th percentiles (box limits), and ±1.5*interquartile range (whiskers). n = 171 WT cells from five independent samples and n = 77 Mf/f;Cre cells from three independent samples. P-values were calculated using two-sided t-test. Source data are provided as a Source Data file.
To better characterize the origin of the defect at the single cell level, CITE-seq was performed on E10.5 Mf/f;Cre embryos to compare the different subpopulations to their WT counterpart. A total of 6745 Mf/f;Cre cells and 8423 WT cells (Supplementary Table 2) were integrated and visualized by dimensional reduction of transcriptomes on UMAP plots (Fig. 5D). Significant differences in sample distribution were observed with Mf/f;Cre cells being significantly under-represented in both the pre-HE and EHT subsets (Fig. 5E and Supplementary Table 2). Focusing on the subpopulations of interest confirmed that the proportion of pre-HE and EHT cells were significantly reduced compared to aEC in Mf/f;Cre samples (Fig. 5F). Interestingly, the relative proportion of pre-HE progressing to EHT cells was not significantly different from what was observed in WT samples (Fig. 5F). Therefore, the reduction observed in the number of cells undergoing EHT resulted from the initial early decrease in the pre-HE population, with a concomitant increase in aEC, and not a blockade in the pre-HE to EHT transition per se. Consistent with the observation of a defect in the generation of pre-HE, Mf/f;Cre embryos showed a reduction in the proportion of EC that expressed CD44 at E9.5 (Fig. 5G), corroborating the findings that Meis1 contributes to the specification of early pre-HE cells.
Interestingly, while some pre-HE cells are formed in the absence of Meis1, they appeared to be less transdifferentiated. We used the gene signatures of aEC and pre-HE populations, based on differential analysis between these two clusters in WT cells (Fig. 2A), to compute an expression score for each WT and Mf/f;Cre cell contained in the pre-HE cluster. Overall, WT pre-HE cells had higher expression of genes upregulated in pre-HE vs aEC whereas Mf/f;Cre cells scored higher for genes that would be expected to be downregulated in that cluster (Fig. 5H). Therefore, Meis1 plays a critical role in the acquisition of a pre-HE transcriptional program in cells that would otherwise become aEC.
Aberrant pre-HE formation impairs the emergence of pre-HSPCs
Consequent to the loss of Meis1 expression, the reduced hemogenic potential of Mf/f;Cre EC from the dorsal aorta impaired the emergence of pre-HSPC. Flow cytometry showed a lower number of immunophenotypic CD31+CD41lowCD45− pre-HSPC in the AGM of Mf/f;Cre embryos both as a proportion of EC and by absolute cell counts at E10.5 (Fig. 6A, B). Similarly, fewer immunophenotypic pre-HSPC were detected in E9.5 Mf/f;Cre AGM compared to WT littermates (Fig. 6C). While the number of WT pre-HSPC strongly increased between E9.5 and E10.5, the fold reduction observed in Mf/f;Cre embryos compared to WT was maintained over the two time points (2.23-fold vs 2.37-fold reduction at E9.5 and E10.5, respectively). The EHT defect thus originates early in development and is maintained and propagated over the developmental process. As the defect is not amplified over time, this suggests that Meis1 is essential for early pre-HE specification, but not for promoting hematopoietic transdifferentiation to early pre-HSPC.
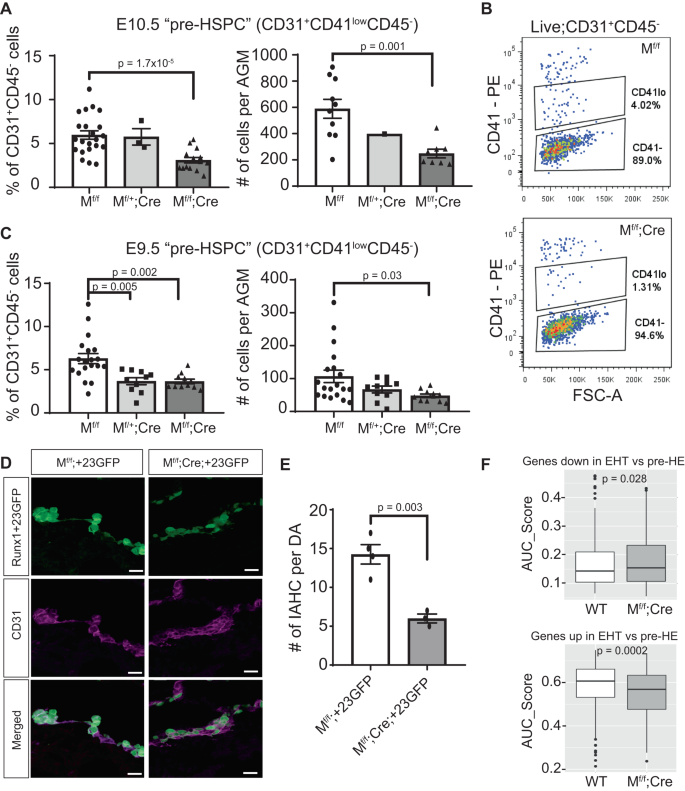
A, C Quantification of viable immunophenotypic pre-HSPC (CD31+CD41lowCD45−) by flow cytometry in (A) E10.5 embryos (n = 22 Mf/f, 3 Mf/+;Cre, and 15 Mf/f;Cre) and (C) E9.5 (n = 19 Mf/f, 10 Mf/+;Cre, and 11 Mf/f;Cre). In A, counting beads were used only on a subset of samples (right panel, n = 10 Mf/f, 1 Mf/+;Cre, and 8 Mf/f;Cre). Data are presented as mean ± SEM and each data point represents a different embryo. B Representative flow cytometry scatterplots of CD41 expression on CD31+CD45− cells at E10.5. D Immunostaining of E10.5 IAHC based on GFP (green) and CD31 (purple) expression in Runx1+23GFP embryos expressing Meis1 (Mf/f;+23GFP) and littermates lacking endothelial expression of Meis1 (Mf/f;Cre;+23GFP). Scale bar = 20 µm. E Quantification of large IAHC (>4 cells) per dorsal aorta (n = 4 Mf/f;+23GFP and 3 Mf/f;Cre;+23GFP embryos). Data are presented as mean ± SEM. F Gene expression scores for EHT gene signatures (downregulated (upper panel) or upregulated (lower panel)) in individual EHT cells from WT and Mf/f;Cre samples in the CITE-seq dataset, calculated using AUCell. Box-plots display the median (center line), the 25th and 75th percentiles (box limits), and ±1.5*interquartile range (whiskers). n = 326 WT cells from five independent samples and n = 162 Mf/f;Cre cells from three independent samples. All p-values in this figure were calculated using a two-sided t-test comparison between two groups. Source data are provided as a Source Data file.
To further confirm that the lack of pre-HE cells in the absence of Meis1 expression reduces EHT in vivo, we backcrossed the Meis1 conditional-knockout mice with the Runx1+23GFP reporter mouse to generate transgenic embryos that expressed GFP under the spatiotemporal control of the Runx1+23-enhancer, thus marking all emerging functional pre-HSPC9, and lacking EC expression of Meis1 (Meis1flox/flox;VEC-cre;+23GFP, abbreviated Mf/f;Cre;+23GFP). Not every litter produced these triple-transgenic embryos therefore, embryos were collected to examine IAHC by immunostaining cross-sections of the dorsal aorta using the +23GFP as a marker. Some +23GFP cells were detected in both WT (Mf/f;+23GFP or Mf/+;+23GFP) and Mf/f;Cre;+23GFP dorsal aortas. However, the number of large IAHC ( > 4 cells per cluster) was significantly reduced in Mf/f;Cre;+23GFP dorsal aortas (Fig. 6D, E). Most +23GFP cells remained flat and embedded in the vascular wall of the dorsal aorta as opposed to bulging into the vascular lumen as observed in WT counterparts (Fig. 6D). Lack of Meis1 prevented pre-HE specification and Meis1-null cells appeared unable to undergo EHT despite expression of the Runx1+23GFP transgene. As with pre-HSPC numbers quantified by flow cytometry, IAHC formation in Meis1-deficient embryos was reduced by 2.38-fold secondary to the defect in specification of vascular EC to pre-HE. Even though some IAHC formed, these Mf/f;Cre EHT cells were more immature than their WT counterpart based on single-cell gene expression signatures (Fig. 6F).
Meis1 induces a pre-HE transcriptional state in adult EC
The ability of Meis1 to prime EC towards a hemogenic transcriptional program was assessed by introducing Meis1 via lentiviral transduction into aortic EC from adult C57BL/6 mice, followed by isolation of transduced cells that co-expressed CD31 and VEC to ensure that the cells maintained an EC phenotype 72 h post-transduction (Fig. 7A). An increase in surface expression of CD44 was detectable in Meis1-overexpressing cells (Meis1-OE) (Fig. 7B), compatible with the temporal upregulation of CD44 observed between E9.5 and E10.5 GFP+ EC in vivo (Fig. 3I, J), and places Meis1 as a regulator upstream of CD44.
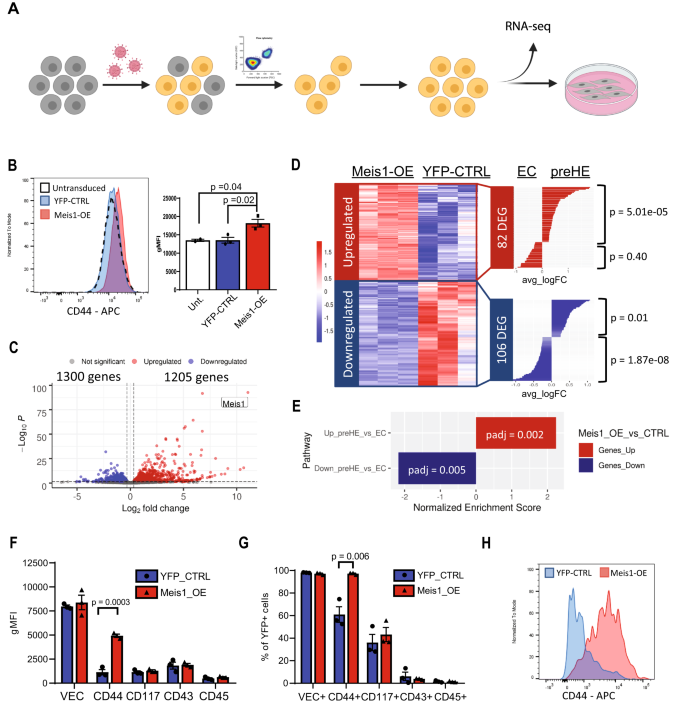
A Schematic of the workflow used to investigate the effect of Meis1 overexpression in EC (created with BioRender.com). B Mean fluorescence intensity (MFI) of CD44 immunostaining 72 h post-transduction. Transduced EC were selected (VEC+CD31+YFP+) for the experiments (n = 2 parental untransduced CTRL, 3 YFP-CTRL, and 3 Meis1-OE). Bar plot on the right shows the mean ± SEM (p-values based on two-sided t-test). C Volcano plot showing DEG in Meis1-OE EC compared to YFP-CTRL EC by RNA-sequencing (p-values based on Wald test with Benjamini–Hochberg correction). D Heatmap depicting all genes up-/down-regulated in Meis1-OE EC in common with DEG in the CITE-seq analysis of aEC vs pre-HE cells. Hypergeometric test (one-tailed) was performed to determine whether the overlap was greater than expected from random sampling. E GSEA analysis quantifying enrichment of custom pre-HE genesets (based on CITE-seq expression) in Meis1-OE EC (p-values adjusted with Benjamini-Hochberg correction). F–H Transduced cells with Meis1-OE or YFP-CTRL vector were co-cultured on OP9 cells for 6 days followed by immunophenotyping. F gMFI values for the expression of surface markers relevant to EHT subpopulations and (G) percentage of cells expressing each marker. Data are presented as mean ± SEM and each data point depicts the average of technical duplicates (n = 3 independent biological samples for each group). P-values were calculated using a two-sided t-test. H Histogram plot of CD44 expression by flow cytometry after OP9 co-culture. Source data are provided as a Source Data file.
RNA-seq of Meis1-OE cells showed 1205 upregulated and 1300 downregulated genes (Fig. 7C). As predicted, cells that overexpressed Meis1 became more similar to pre-HE. Significant overlap was observed between genes upregulated following Meis1-overexpression and genes enriched in pre-HE cells compared to aEC (Fig. 7D). Specifically, 56 of the 425 pre-HE-enriched genes were found upregulated in Meis1-OE EC, which was significantly more than expected by random sampling (p = 5.01e-05, Fig. 7D). Gene set enrichment analysis performed using custom genesets that included all the DEGs between aEC and pre-HE confirmed that Meis1-OE EC were significantly enriched in genes upregulated in pre-HE vs aEC (Fig. 7E). In addition, genes downregulated upon Meis1-OE were enriched in genes downregulated in pre-HE vs aEC (Fig. 7E). Therefore, expression of Meis1 alone in non-hematopoietic adult EC was able to trigger transcriptional changes reminiscent of the expression pattern that we observed in embryonic pre-HE, demonstrating a clear role for Meis1 in inducing a cellular program that is a prerequisite for reaching hemogenic competency.
While a clear pre-HE transcriptional program was detected in Meis1-expressing EC, adult EC that overexpressed Meis1 failed to form hematopoietic cells in vitro under the permissive OP9 co-culture conditions. After 6 days of co-culture, most cells retained VEC expression and no change in relative expression of the surface markers CD117, CD43, or CD45 could be detected when compared to YFP-CTRL cells (Fig. 7F, G and Supplementary Fig. 10). Nonetheless, the upregulation of CD44 previously observed after 72 h (Fig. 7B) was even more pronounced after an additional 6 days of co-culture in the presence of cytokines (Fig. 7F–H and Supplementary Fig. 10), further validating the positive regulation of CD44 by Meis1. While Meis1 pushes EC towards the pre-HE state, it appears to be insufficient to drive cells all the way through EHT, at least in the culture conditions used in this system. Meis1 induces a pre-HE-like program in EC, but it likely requires additional transcriptional support to facilitate EHT. Indeed, this finding provides a corollary to the results in Fig. 5, which suggest that Meis1 is not required for the initiation of EHT once a pre-HE state is achieved. Taken together, our findings imply that the main function of Meis1 in early blood development appears to coax aEC into the pre-HE state, and that it is neither necessary nor sufficient to further promote EHT in committed HE cells.
- SEO Powered Content & PR Distribution. Get Amplified Today.
- PlatoData.Network Vertical Generative Ai. Empower Yourself. Access Here.
- PlatoAiStream. Web3 Intelligence. Knowledge Amplified. Access Here.
- PlatoESG. Automotive / EVs, Carbon, CleanTech, Energy, Environment, Solar, Waste Management. Access Here.
- BlockOffsets. Modernizing Environmental Offset Ownership. Access Here.
- Source: https://www.nature.com/articles/s41467-023-40283-0

