Your gateway to successful crypto investing guided by data and research
Executive Summary
- Monthly Overview: March witnessed Bitcoin reaching a new all-time high of $73k, driven by significant ETF inflows and wealth transfers from long-term to new investors. Ethereum’s successful Dencun upgrade, poised to impact its monetary policy and network scalability, marked another key development.
- Market Momentum: Glassnode’s Composite Momentum Indicator suggests the positive trend has a high chance of continuation, despite a downtrend in on-chain activity metrics like Miner Revenue Momentum. The shifts in recent investors’ (short-term holder) behaviour and profitability indicators remain crucial for trend analysis.
- Metric Spotlight: Tracking the volume moving to exchanges, the Exchange Inflow Volume Momentum indicator provides insights into speculative market dynamics and trading activities, revealing insights into shifts in selling pressure and potential market movements.
Welcome to the latest edition of Finance Bridge, where we distil the current dynamics of the digital asset market into actionable insights.
Last month, Bitcoin not only reached a new all-time high but also achieved this milestone before the halving – an unprecedented event in Bitcoin’s 15-year history. If you would like to learn more about the market forces that have led to this result, we recommend reading our special report on trading strategies around the halving. In short, though, it is clear that the recently approved spot Bitcoin ETFs are now the primary driver of price action, with robust inflows totalling $3.6 billion in March alone. (Read more)
It is also worth mentioning that Bitcoin outshined other asset classes in March with a remarkable 17% performance, eclipsing gold’s 9%, the S&P 500’s 3%, and the Nasdaq’s 1%. This surge underscores the growing influence of and interest in digital assets within the broader financial ecosystem.
The speculative currents around the potential approval of spot Ethereum (ETH) ETFs also captured the market’s attention. Despite strong opposing views among experts and stakeholders, the path remains for a possible approval later in the year. (Read more)
As we dive deeper into this edition, we will explore the market dynamics that characterised the digital asset space in March from the on-chain perspective. We will also take a look at key Glassnode metrics related to market momentum and point to trends traders and investors should watch as we enter the next stage of the current Bitcoin investment cycle.
Monthly Market Overview
Bitcoin broke to its fourth cycle all-time high (ATH), briefly touching $73k and nearly hitting euphoria levels of key on-chain indicators. This rally was characterized by a significant transfer of wealth from long-term holders (LTH) to new investors and speculators, accompanied by a significant uptick in realized profit metrics and futures funding rates. The Realized Cap of Bitcoin also reached a new high of $504B, signalling substantial capital inflows, partly driven by the overwhelming success of the new US ETF products which played a crucial role in sustaining the positive momentum. (Read more)
As Bitcoin crossed its previous cycle’s ATH, market participants locked in over $2.6B in realized profit before the sheer magnitude of profit-taking – related to accelerated distribution by longer-term investors – overwhelmed the demand. Interestingly, the distribution phase initiated by LTHs and the ensuing capital injection are reminiscent of patterns observed in previous cycles and suggest that a large number of LTHs are still waiting for higher prices before offloading. (Read more)
Ethereum’s Upgrade and Its Market Implications
A major development in Ethereum’s landscape last was impacted by the successful activation of the Dencun upgrade, designed to enhance Layer-2 scaling solutions and introduce a new staking model. This upgrade aimed at reducing transaction costs and increasing network throughput, which is a step towards achieving Ethereum’s long-held scalability goals. Notably, the upgrade has potential ramifications for Ethereum’s monetary policy, possibly slowing the rate of new ETH issuance and thus affecting the asset’s supply dynamics. (Read more)
Rising Liquidity, Rising Volatility
The liquidity in the market saw a remarkable rise, driven by LTHs entering a distribution phase and the reawakening of dormant supply. This liquidity surge is instrumental in maintaining the market’s buoyancy and facilitating new demand. Concurrently, the market’s volatility spiked, with Bitcoin’s 90-day realized volatility doubling since October 2023.
Interestingly, Bitcoin’s correction -15.4% pullback from the $73k ATH and consolidation above $61K mirrored previous cycles’ patterns, such as retesting the neutral level of Net Realized Profit and Loss before another leg up. Therefore, from the perspective of on-chain data, this cycle’s profit-taking and redistribution align closely with historical behaviours observed during similar ATH breakouts. For momentum and trend traders, the cyclical nature of investor behaviour as observed through key on-chain metrics remains a crucial tool for assessing entry and exit points as well as the underlying level of risk. (Read more)
Glassnode’s proprietary Composite Momentum Indicator, which is an exploratory framework our analysts created to help momentum and trend traders assess current market conditions, is currently pointing towards the continuation of the positive momentum we have seen over the past few months. As a reminder, the Indicator tracks key on-chain metrics across 4 different categories of investor activity:
- On-Chain Activity: Using network activity and adoption to identify periods of growth and user-base expansion.
- Market Profitability: Identifying periods where the unrealized profit held by investors is improving.
- Spending Behavior: Spotting periods when there is a sufficient inflow of demand to absorb profit taking by existing holders.
- Wealth Distribution: Considering the balance and transfer of wealth between old and new holders.
At the moment, the only category that doesn’t meet the criteria indicating positive momentum is On-Chain Activity. The base metrics for this category include Miner Revenue Momentum and Exchange Inflow Volume Momentum.

Looking at the chart below, we can see that Miner Revenue is currently in a downtrend phase. This is primarily due to the normalization of revenue levels following the “ordinals mania” period, which had unusually high monetary and inscription fees. As the Z-score adapts to these peaks by incorporating them into its calculations, the current lower fee pressure appears diminished by comparison.
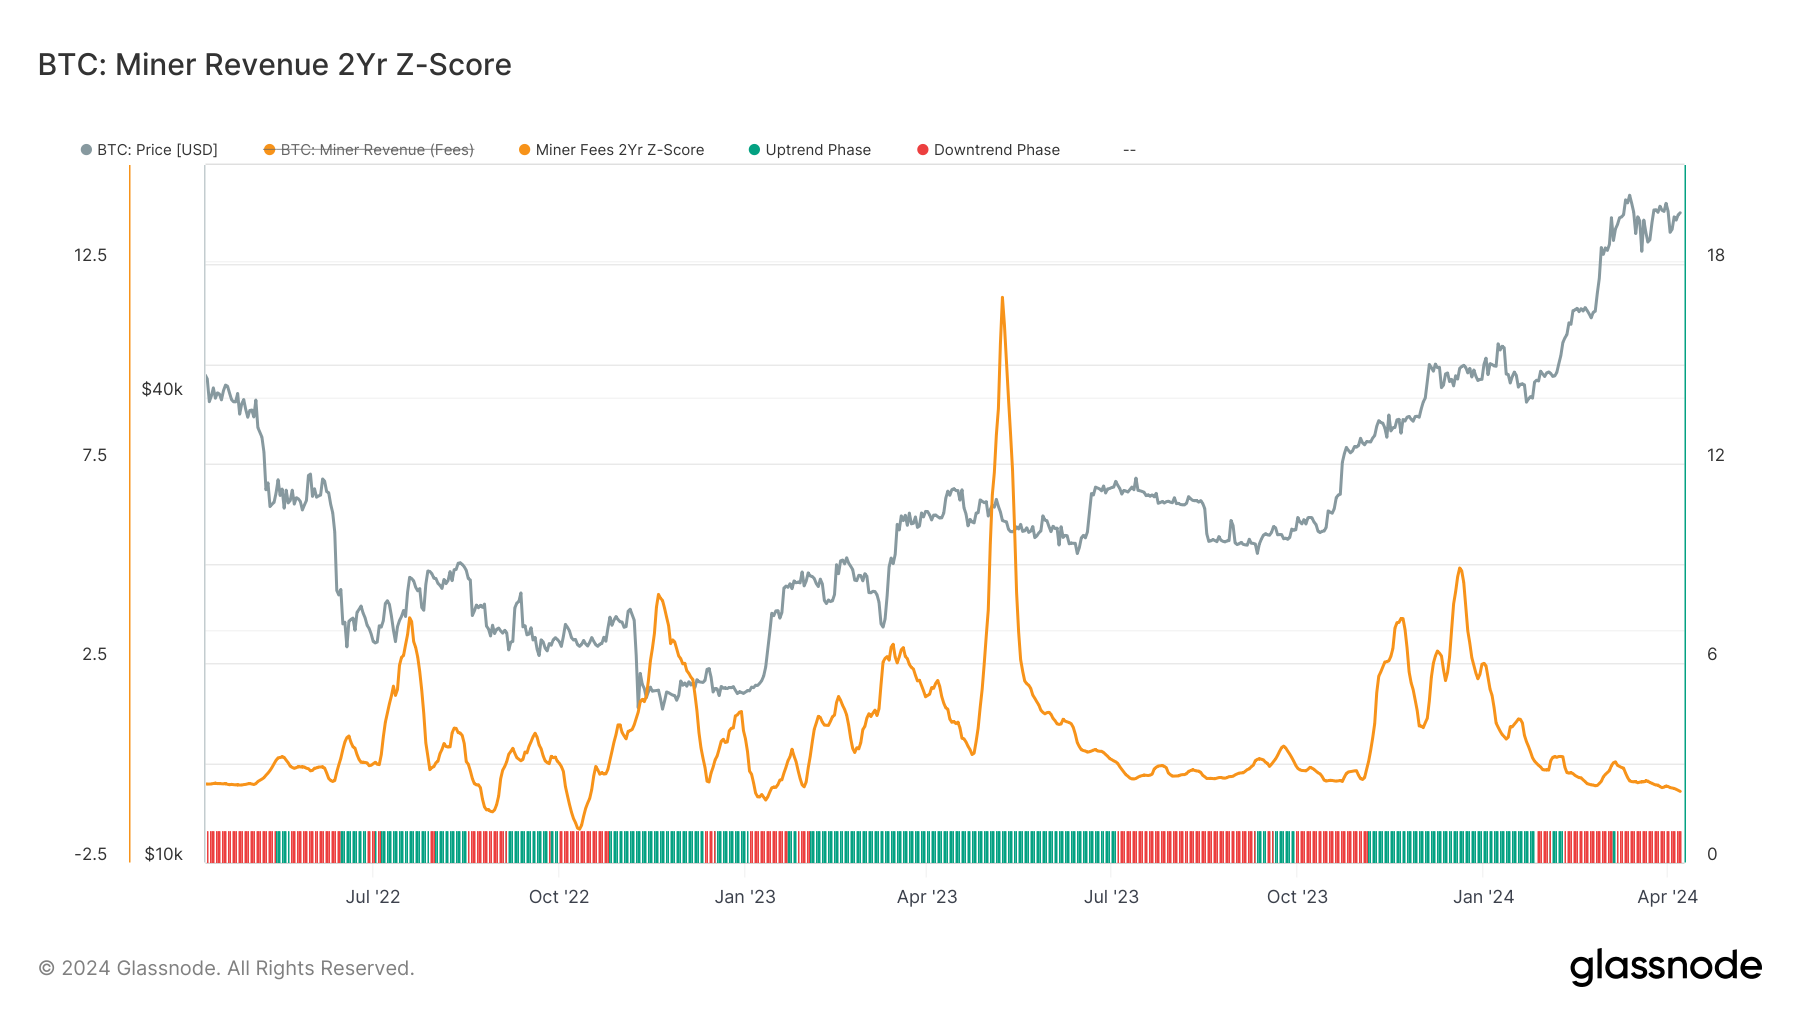
Moreover, the current transaction count, although still quite high, is significantly lower than last year’s, contributing to the reduced fee pressure. Essentially, the current levels of miner revenue and transaction activity, while still robust, are less exceptional relative to the elevated benchmarks set in the previous months, leading to a drop in the Z-score value.
The other of the two indicators within the on-chain activity category is the Exchange Inflow Volume Momentum, which compares the monthly to the yearly average of Bitcoin inflows to exchanges.

This indicator still very much points towards a positive market trend, although we can see that monthly inflows seem to have peaked. Momentum and trend trades should monitor this metric to see whether this is a temporary slowdown or a more sustained trend.
Apart from these two metrics, it may also be worthwhile to focus on profit and pricing indicators, especially those that focus on short-term trends. One such metric is the Short-term Holder (STH) Market Value to Realized Value (MVRV) Momentum Indicator. This indicator offers insights into the unrealized profit or loss of recent market entrants. By comparing the STH cost-basis to the current spot price, traders can gauge the pressure new participants face, highlighting potential moments for capitulation or profit-taking.
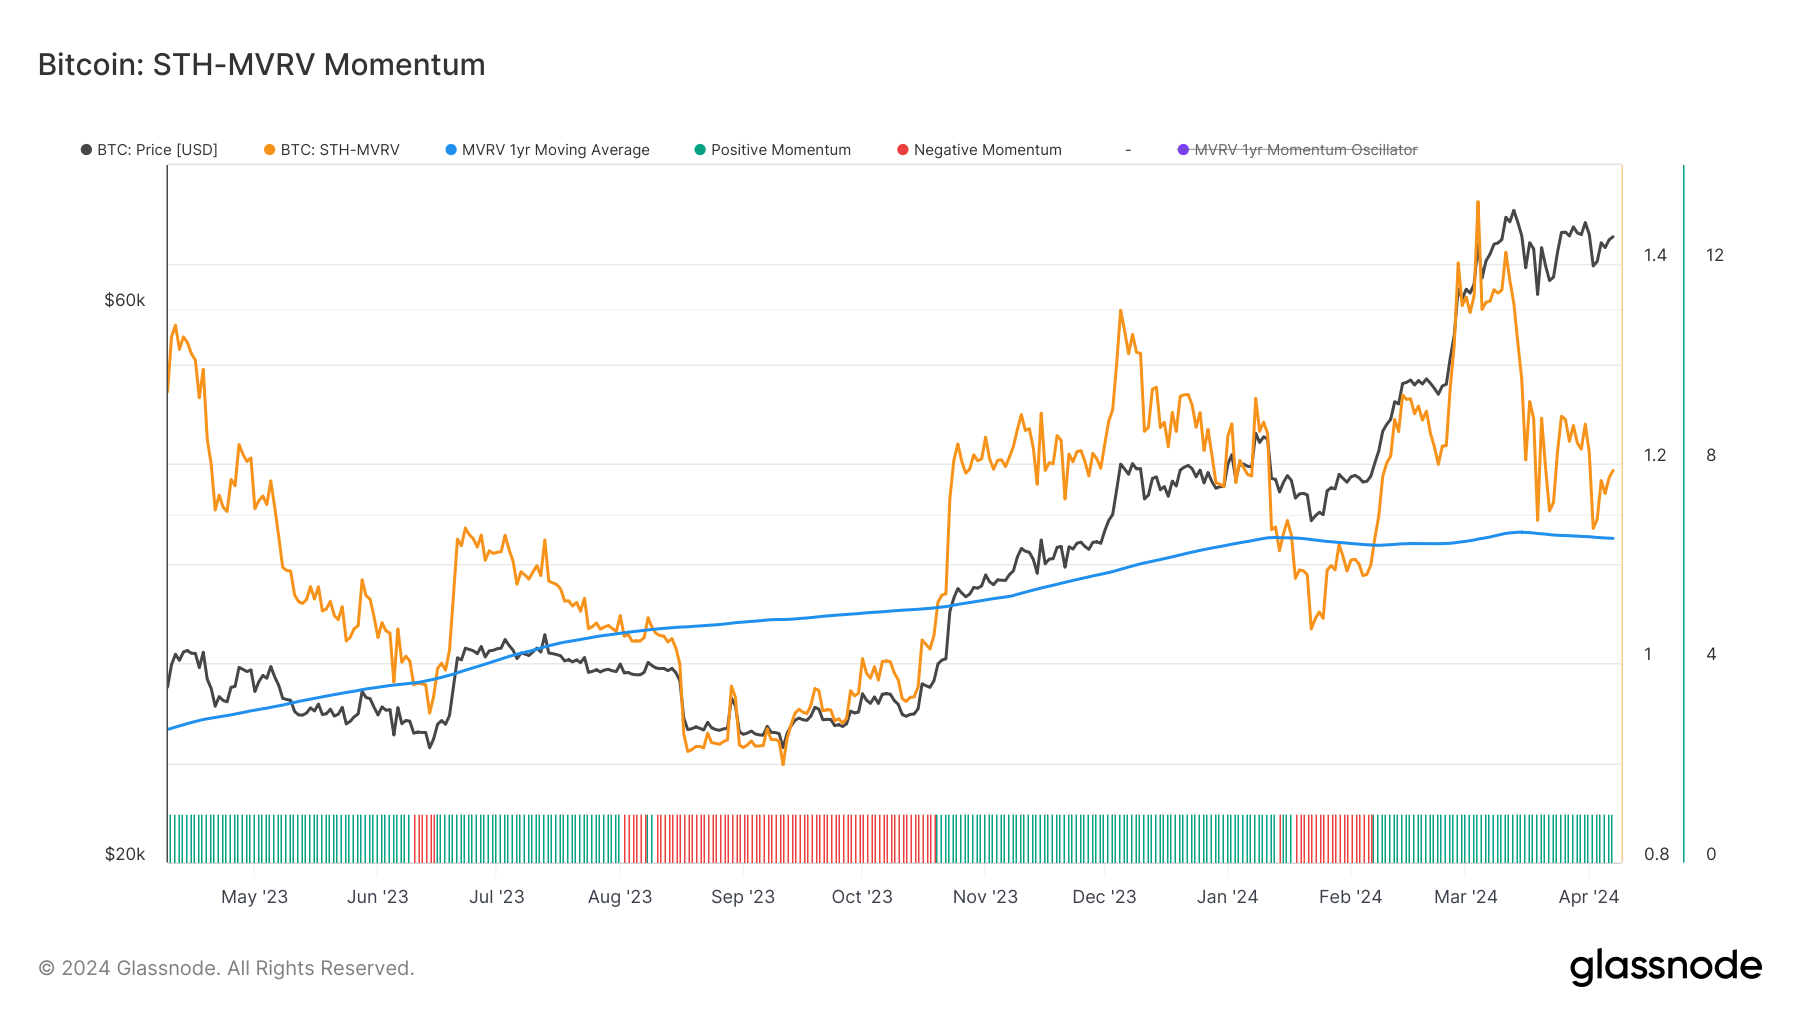
Since early February, STH-MVRV has indicated positive market momentum, but we can also see that it peaked in early March and approached the one-year average twice thereafter. Following the recent sell-off and during the ongoing consolidation phase, the indicator has begun to rise once more, signalling a resurgence in positive momentum. This suggests that despite short-term volatility, the market retains underlying strength, with STHs potentially gearing up for another wave of activity influenced by recent gains and the market’s current positioning.
Metric Spotlight: Exchange Inflow Volume Momentum
In our analysis of the market momentum trends above, we have used the Exchange Inflow Volume Momentum. This indicator tracks the monthly and yearly averages of volume transferred to all exchanges, serving as a refined gauge for spot trading activity. Enhanced by Glassnode’s entity-adjustment heuristics, this metric offers a direct insight into the market’s speculative dynamics during periods of network growth.
By examining the deviation and gradient between these moving averages, analysts can unearth advanced indications and divergences, providing a deeper understanding of the market’s appetite for speculation. This tool is particular useful for identifying shifts in trading activity that precede market movements, making it a useful component for momentum traders and analysts aiming to anticipate market trends.
Exchange Inflow Volume Momentum – Interactive Breakdown
- Trend to Look For: High inflows can indicate potential selling pressure, while decreasing inflows may signal holding behaviour, often seen in bullish phases.
- Historical Example: Sudden spikes in exchange inflows often market major bottoms in the Bitcoin market. We can see examples of this in March 2020, May 2021, and June 2022. Additionally, the crossover between the monthly and the yearly averages of exchange inflows often precede major uptrends and can serve as a promising entry point. Examples include April 2019 and June 2023
- Metric Variations: Get a more granular view of volume data with metrics such as Transfer Volume from Whale Entities to Exchanges, Net Transfer Volume from/to Exchanges Breakdown by Size
Get Personalised Insights
We hope that Finance Bridge continues to provide valuable insights and helps you navigate the crypto landscape more effectively.
If you have an idea about how we could improve this newsletter to make it more practical for you, we invite you to engage with us. Do you have any questions about the content of this issue or any other queries? Would you like to connect directly with our team of analysts? Or are you interested in discovering how you can leverage Glassnode’s full potential?
Don’t hesitate to reach out. Your thoughts and insights will help us continue to improve the quality of our services and this newsletter, so we’re genuinely excited to hear from you. Schedule a call with a dedicated member of our Institutional sales team to begin the conversation.
Disclaimer: This report does not provide any investment advice. All data is provided for information and educational purposes only. No investment decision shall be based on the information provided here and you are solely responsible for your own investment decisions.

- SEO Powered Content & PR Distribution. Get Amplified Today.
- PlatoData.Network Vertical Generative Ai. Empower Yourself. Access Here.
- PlatoAiStream. Web3 Intelligence. Knowledge Amplified. Access Here.
- PlatoESG. Carbon, CleanTech, Energy, Environment, Solar, Waste Management. Access Here.
- PlatoHealth. Biotech and Clinical Trials Intelligence. Access Here.
- Source: https://insights.glassnode.com/finance-bridge-approaching-the-halving/

