Executive Summary
- Despite chaotic price action, investor profitability remains robust, with the average coin holding an unrealized profit of around 120%.
- The demand side has been sufficient to absorb sell-side pressure and HODLer divestment but insufficient to promote further upward growth.
- The cash-and-carry trade continues, with a particular uptick by institutional traders, reinforcing an expectation of range-bound trading for the time being.
Market Profitability Remains Robust
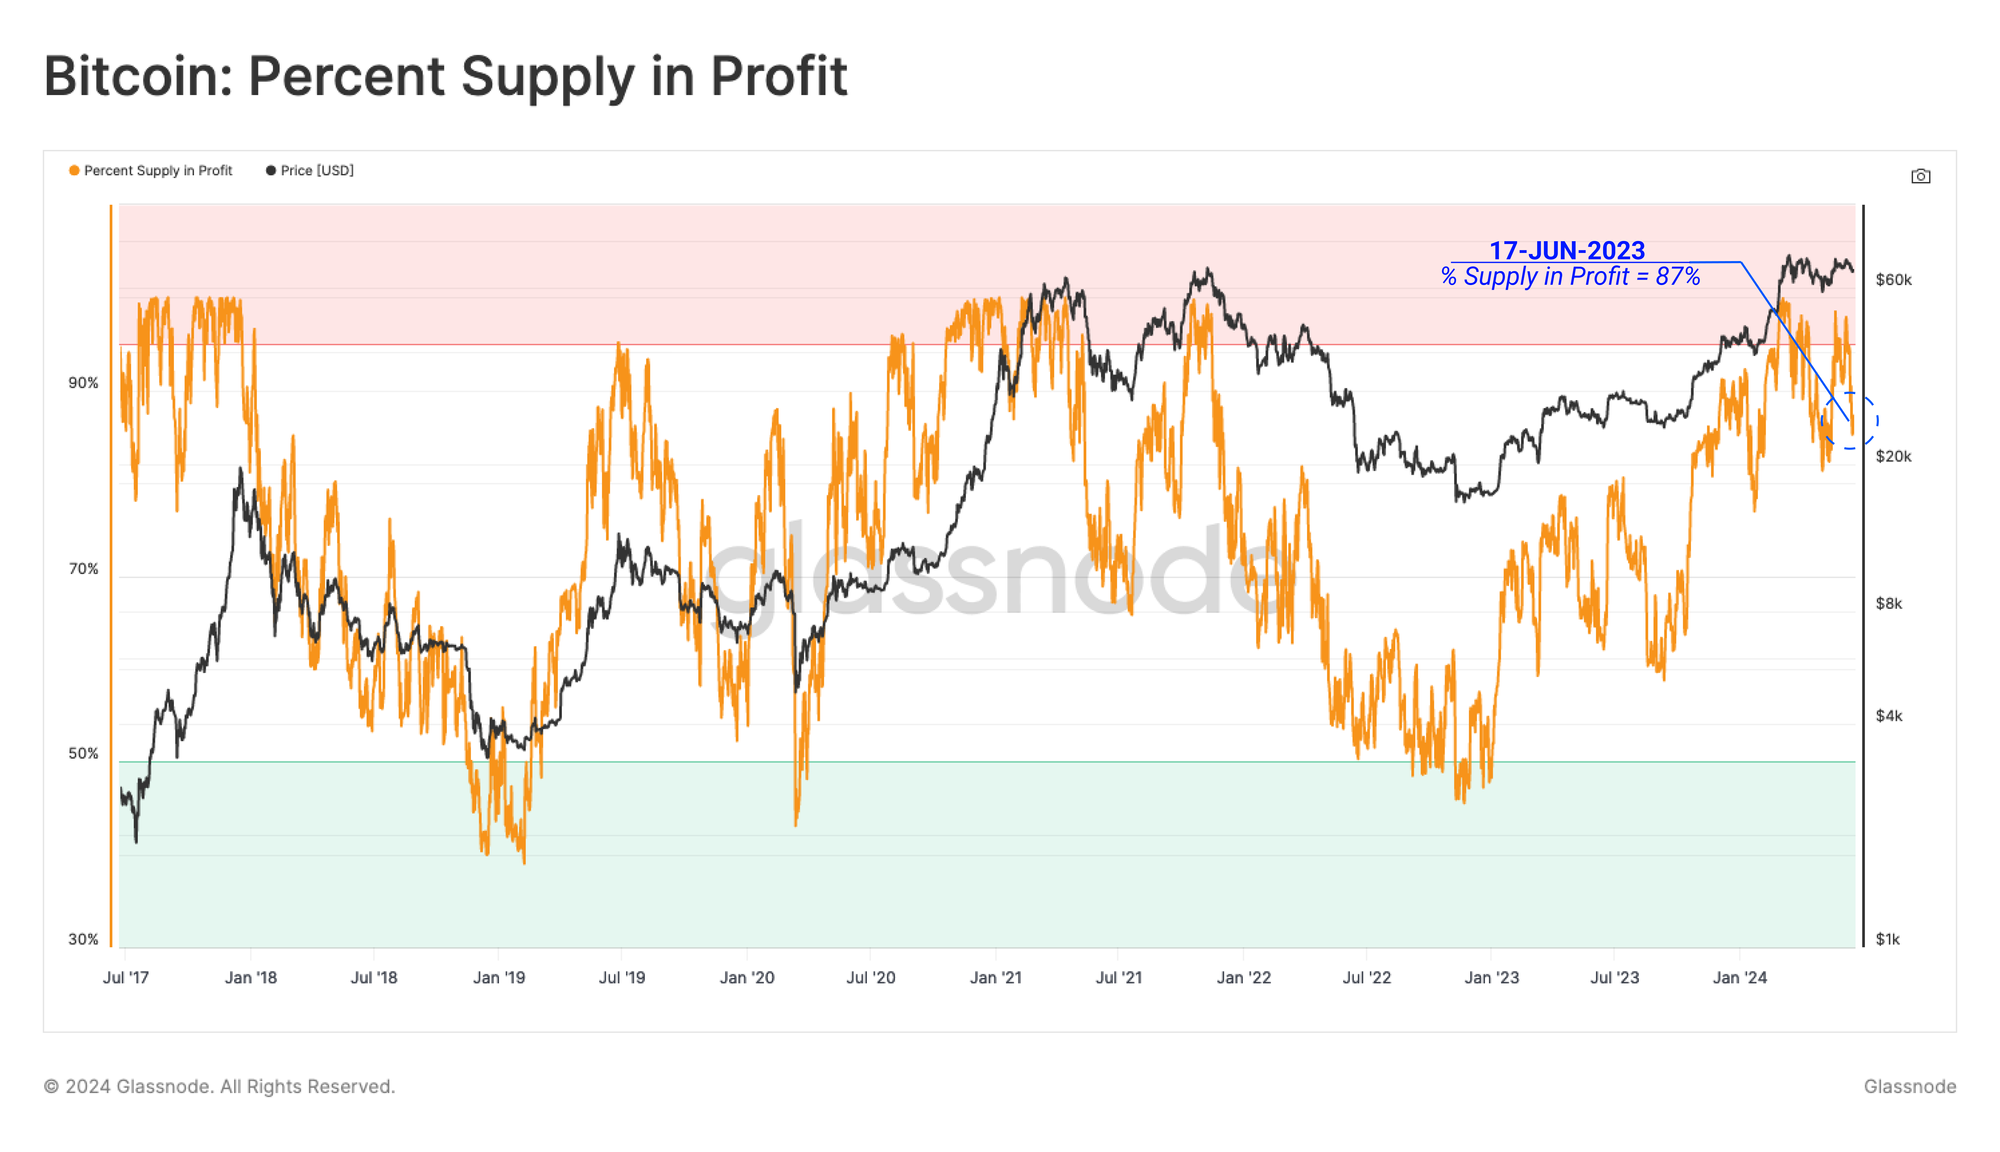
Sideways price movement tends to manifest as investor boredom and apathy, which appears to be the dominant response across all Bitcoin markets. BTC prices are consolidating within a well-established trade range. Investors remain in a generally favourable position, with over 87% of the circulating supply held in profit, with a cost basis below the spot price.
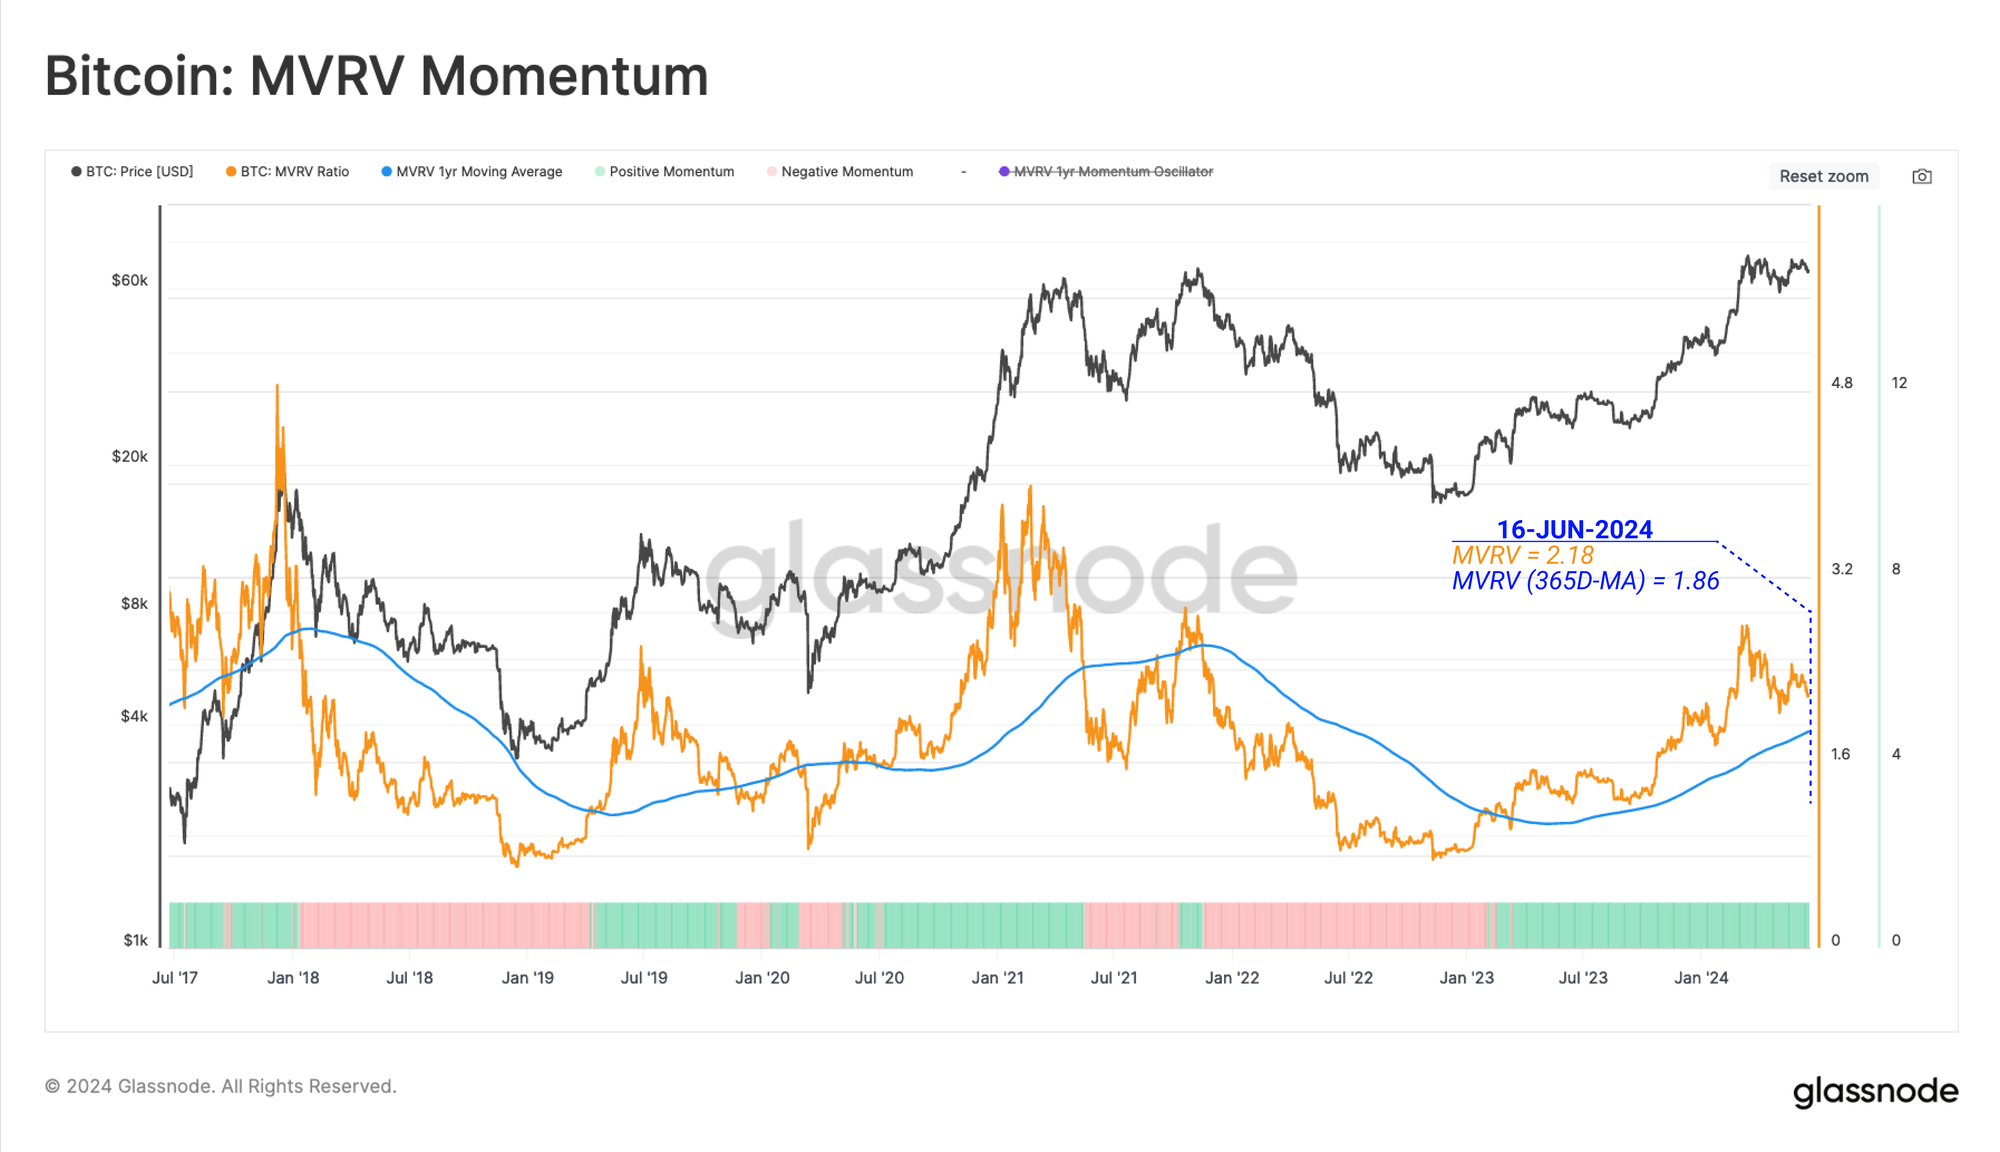
Employing the MVRV metric, we can assess the magnitude of unrealized profit the average investor is holding.
Currently, the average coin holds an unrealized profit of around +120%, typical of previous markets trading around the previous cycle ATH. The MVRV Ratio remains above its yearly baseline, suggesting that the macro uptrend remains intact.
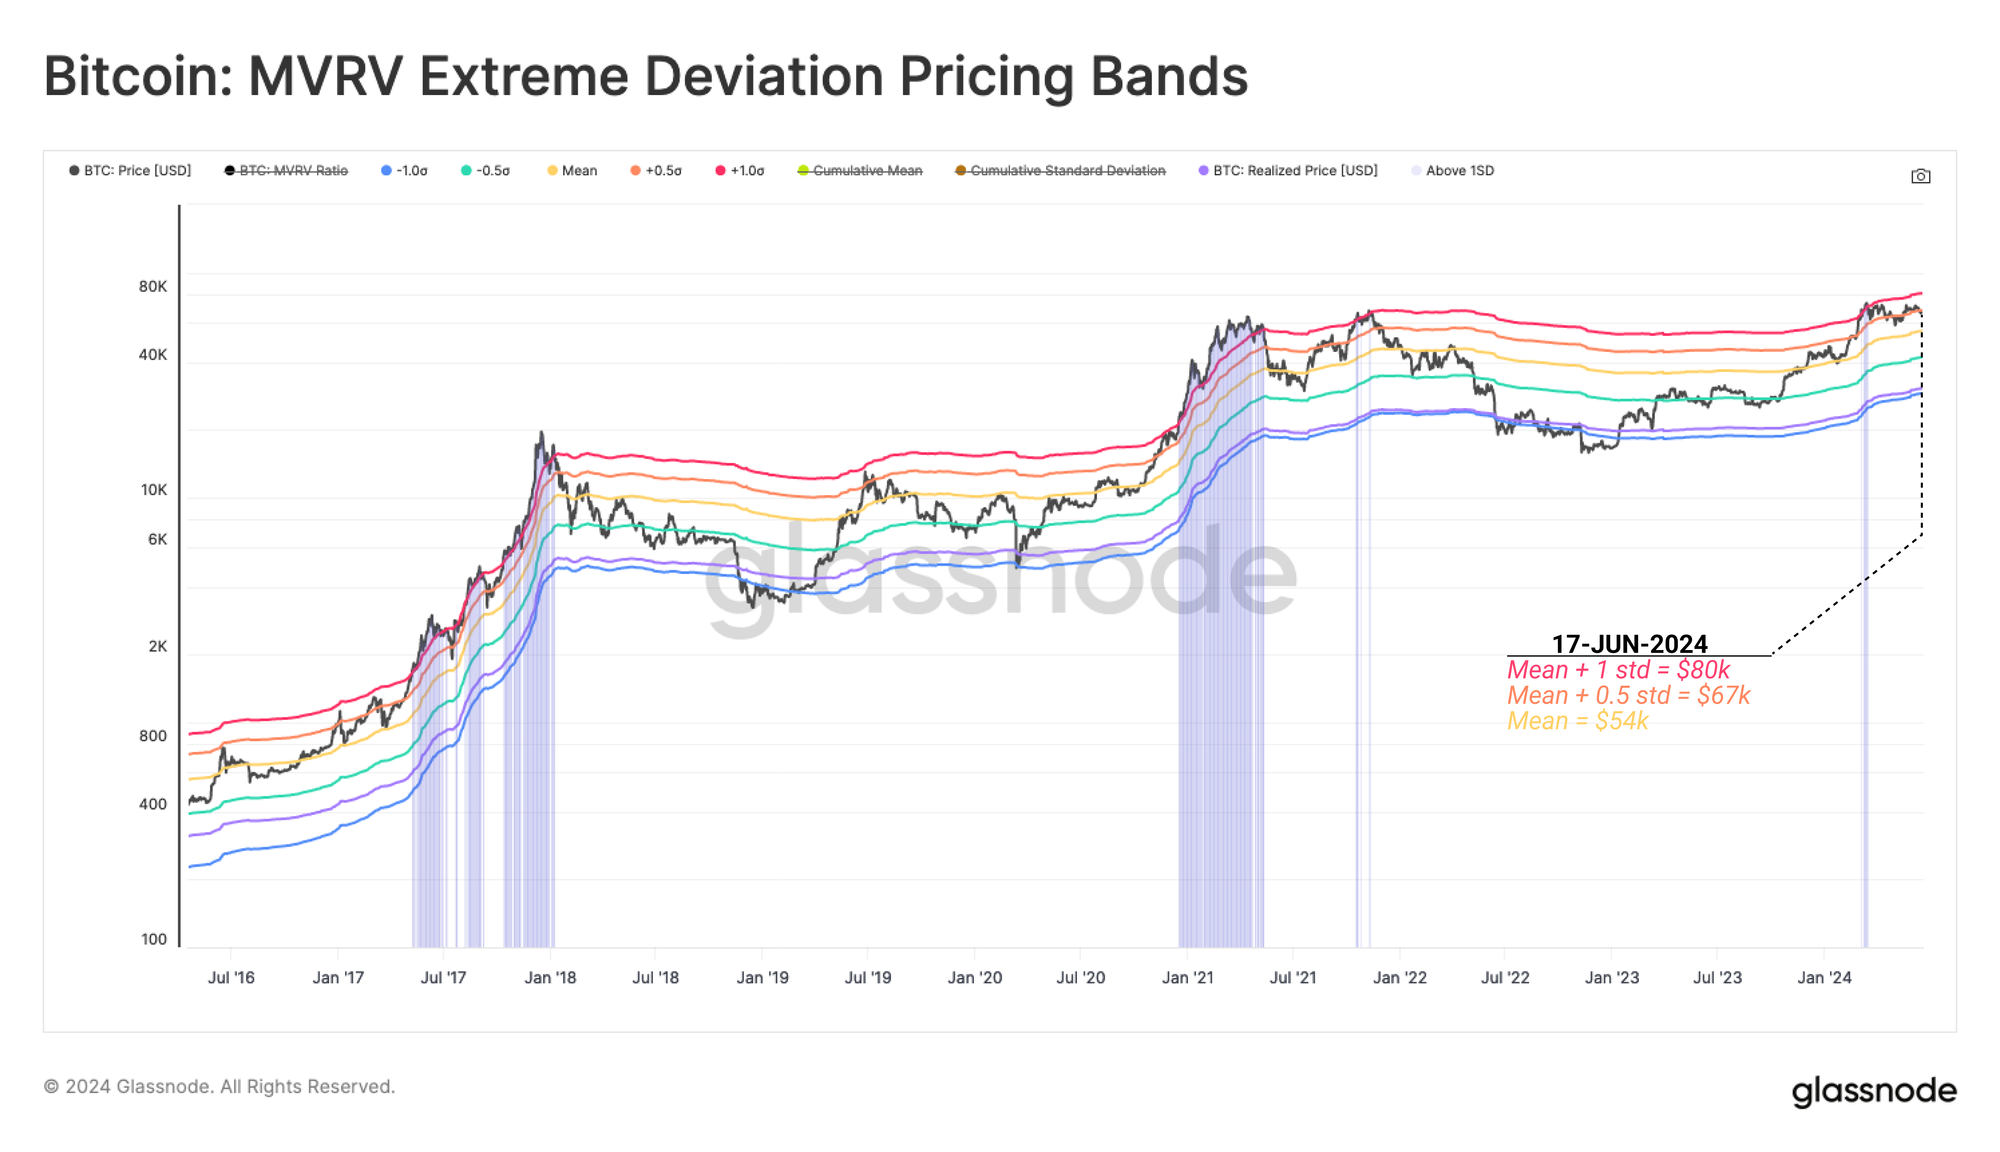
We can use the MVRV Ratio to define pricing bands which assess points of extreme deviations in investor profitability relative to the long-term mean. Historically, breakouts above 1 standard deviation have aligned with longer-term macro topping formations.
Currently, the BTC price is stabilizing and consolidating between the 0.5 and 1 standard deviation range. This again highlights the statistically high profit the average investor is holding despite the recent choppy market conditions.
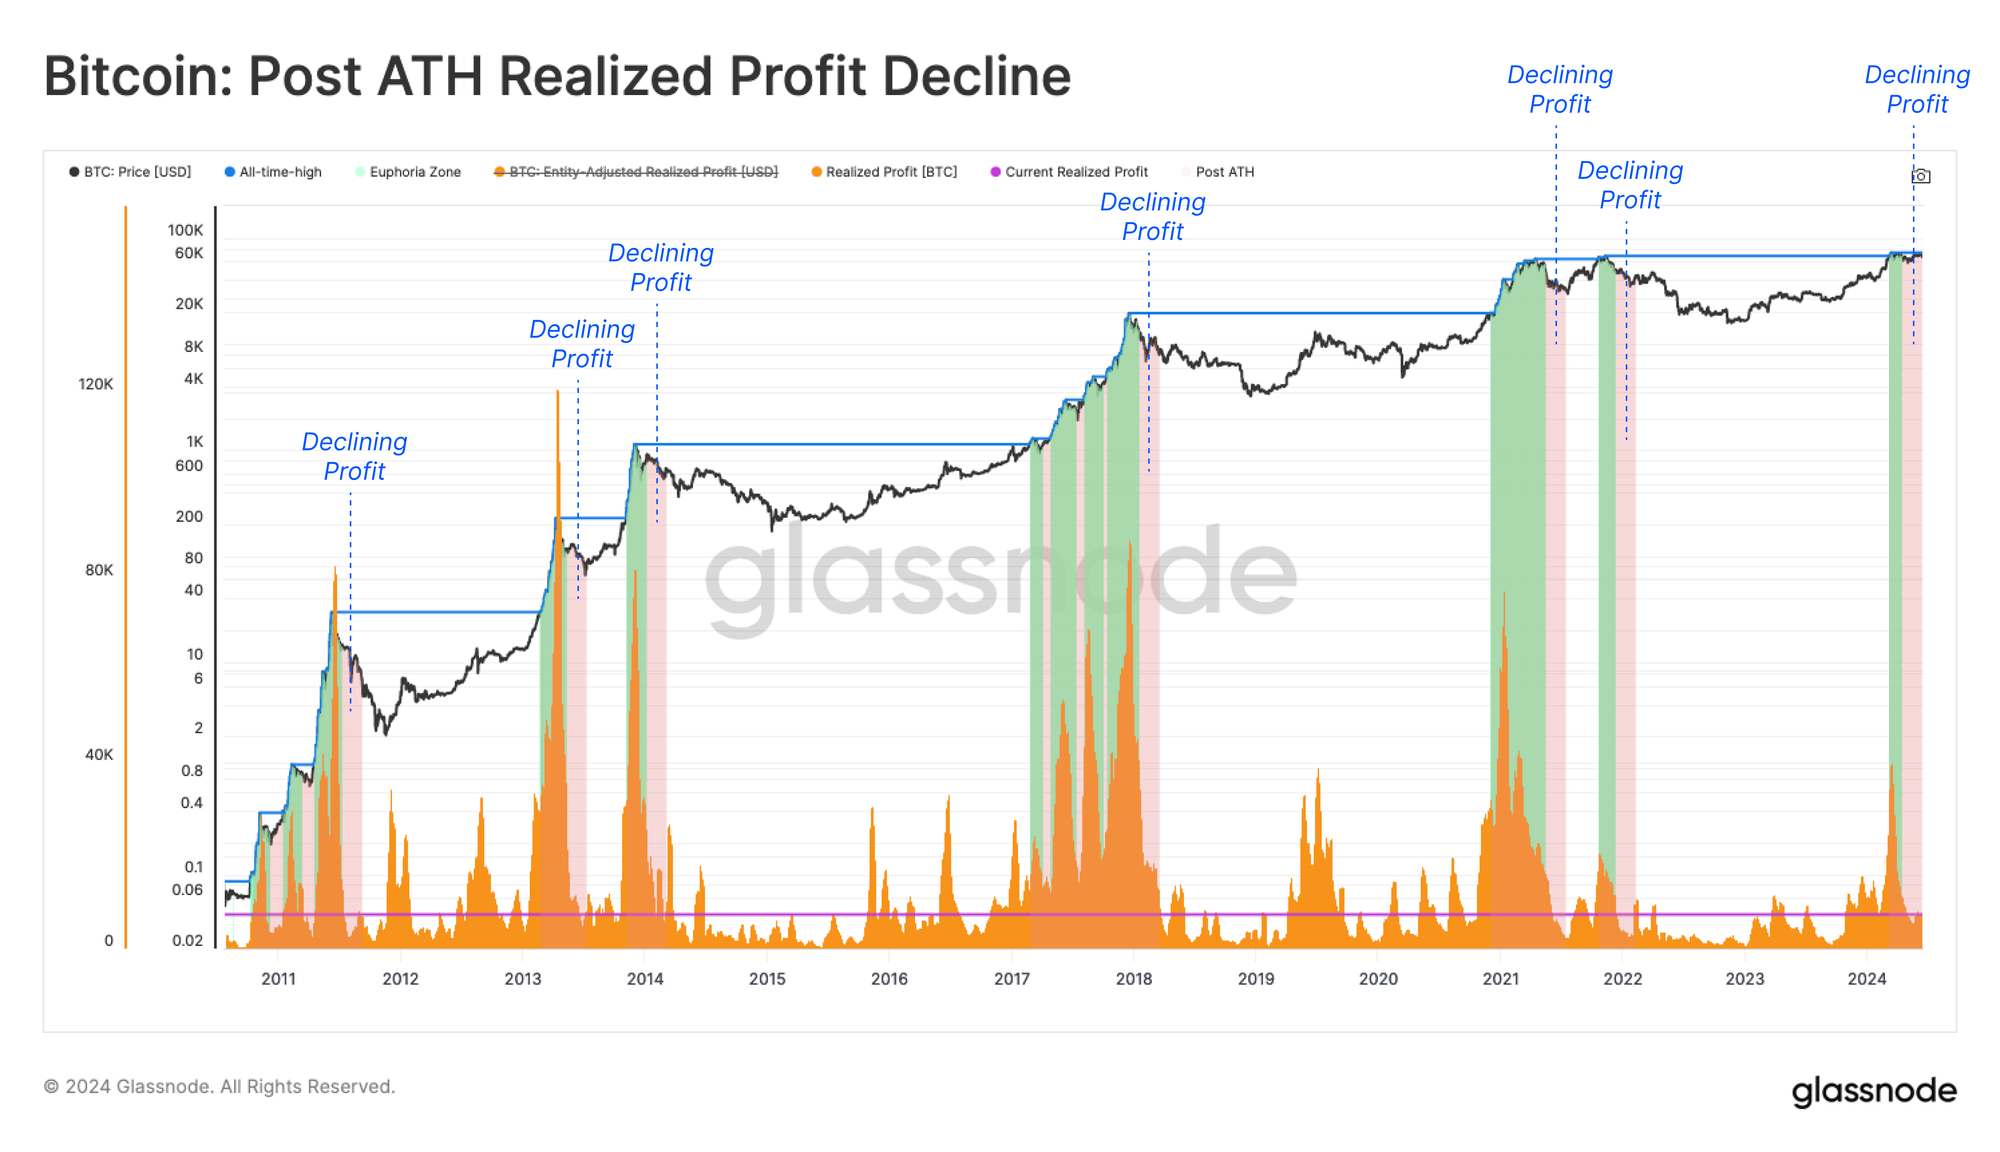
When the market decisively punched above the 2021 ATH, significant investor distribution occurred, driven largely by the Long-Term Holder cohort. This reflected a substantial profit being made, which acts to increase the actively traded and liquid supply.
Typically, in the immediate aftermath of a new ATH, the market needs ample time to consolidate and digest the introduced supply overhang. As an equilibrium is established, this leads to a decline in both realized profits and sell-side pressure.
This reduction in sell-side pressure and profit-taking naturally reduces overhead market resistance. Nevertheless, the BTC price has been unable to sustain a palpable upward rally since the March ATH. This demonstrates that while the demand side is stable enough to keep the market range bound, it is ultimately not increasing sufficiently to reestablish upward momentum.
Lackluster Volume
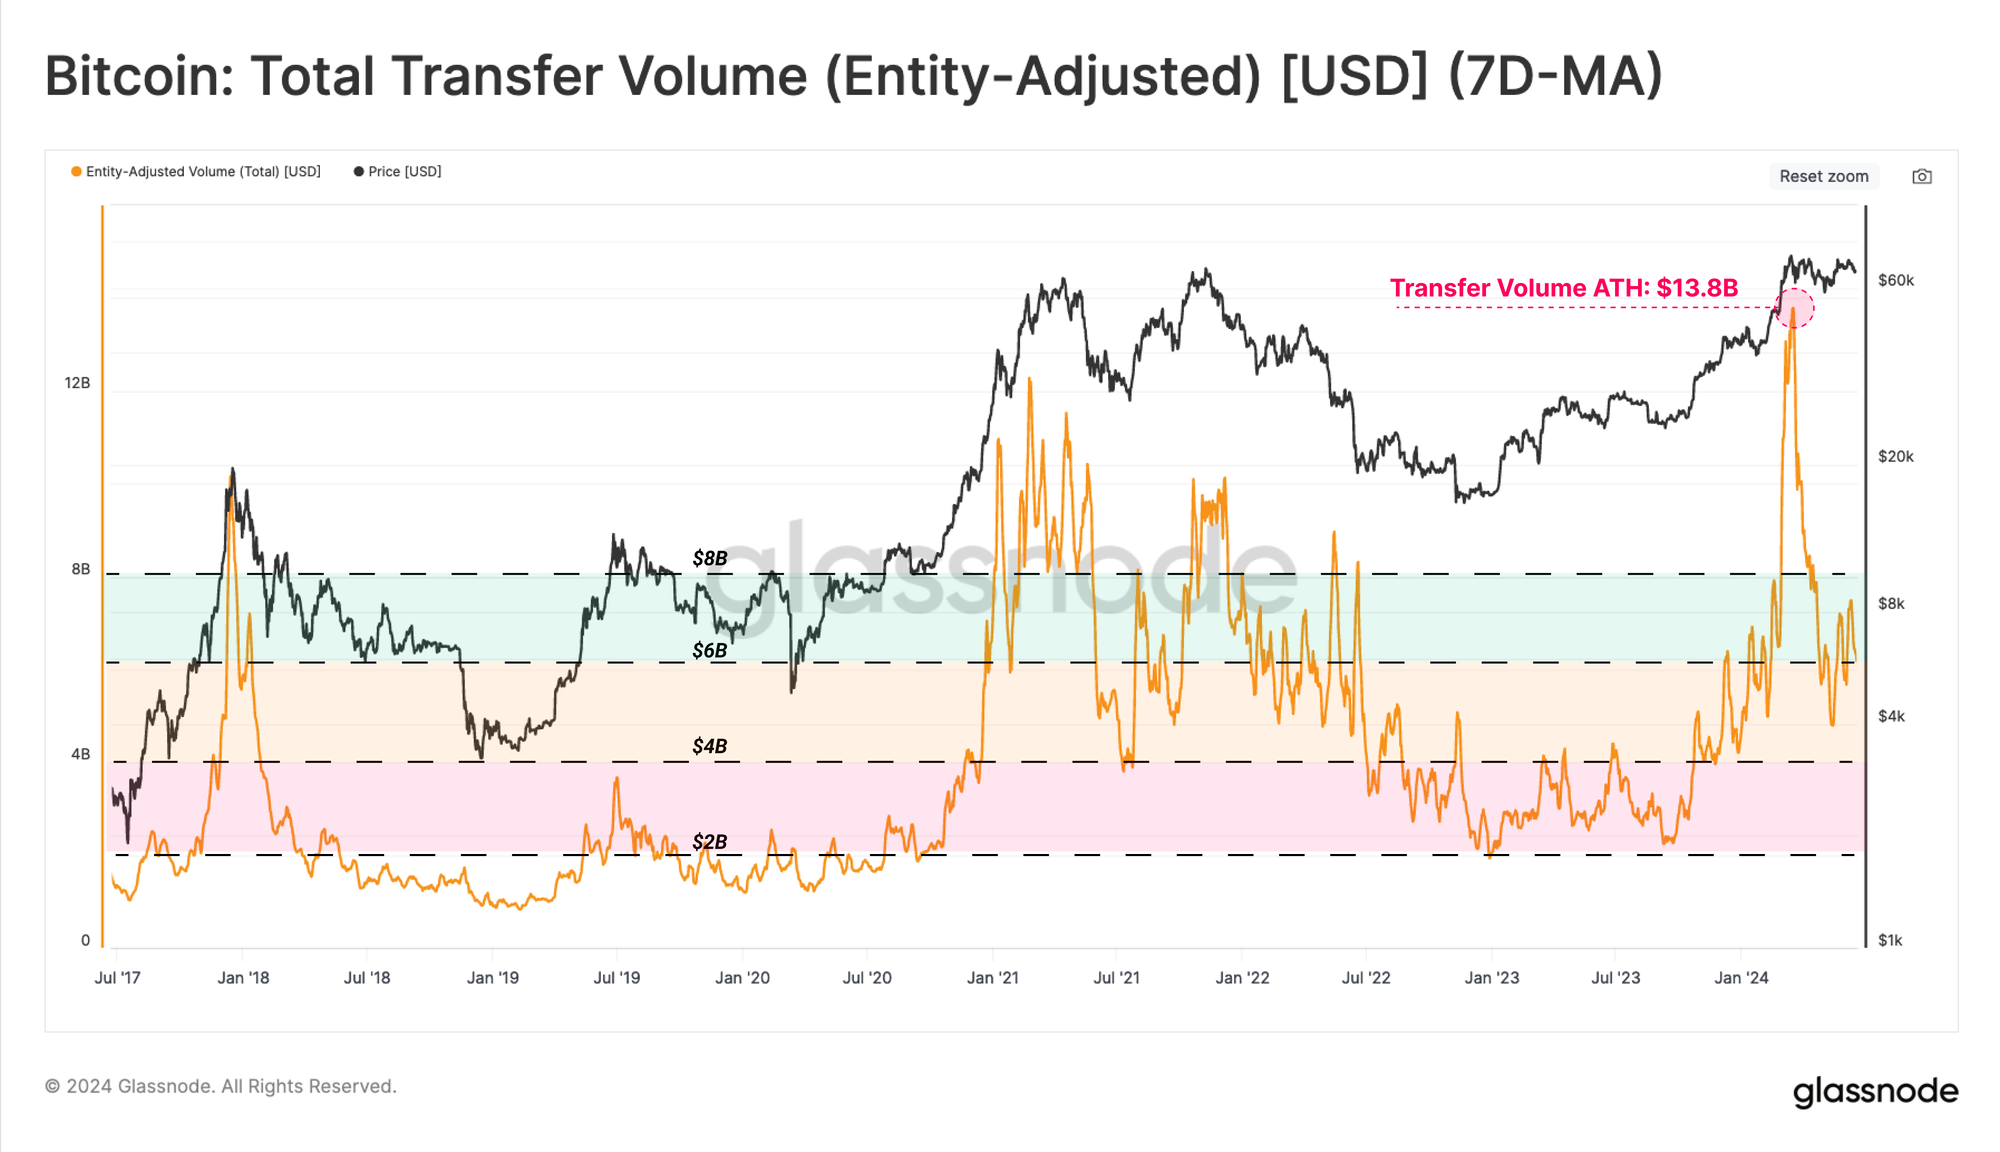
Despite healthy investor profitability, the magnitude of volume being processed and transferred on the Bitcoin Network following the ATH has declined drastically. This underscores a reduced appetite for speculation and heightened indecision in the market.
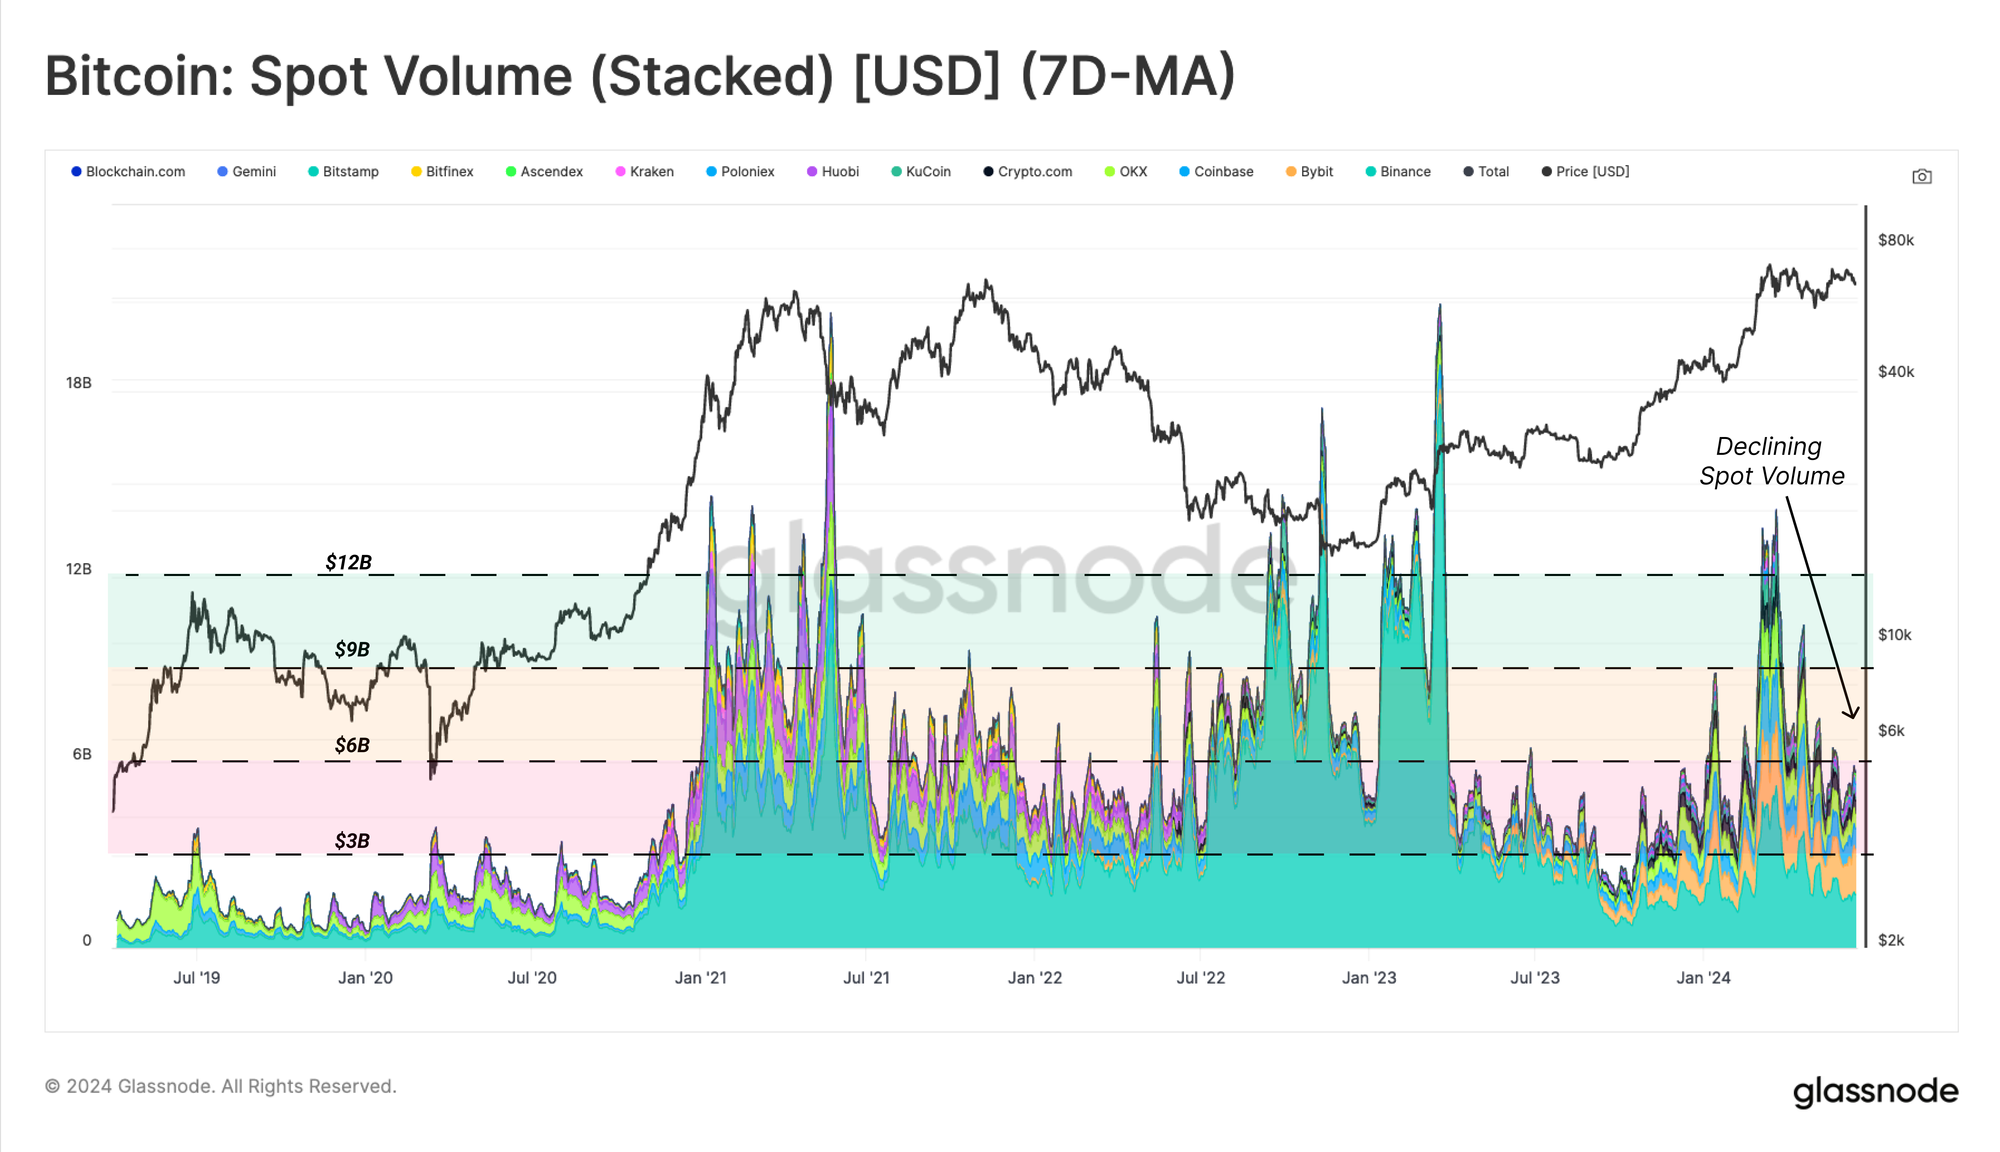
A similar story can be observed when assessing the Spot Volume traded across major centralized exchanges. This demonstrates the strong correlation between onchain network settlement volumes and trade volumes, echoing a sentiment of boredom amongst investors.
Exchange Activity Tumbles
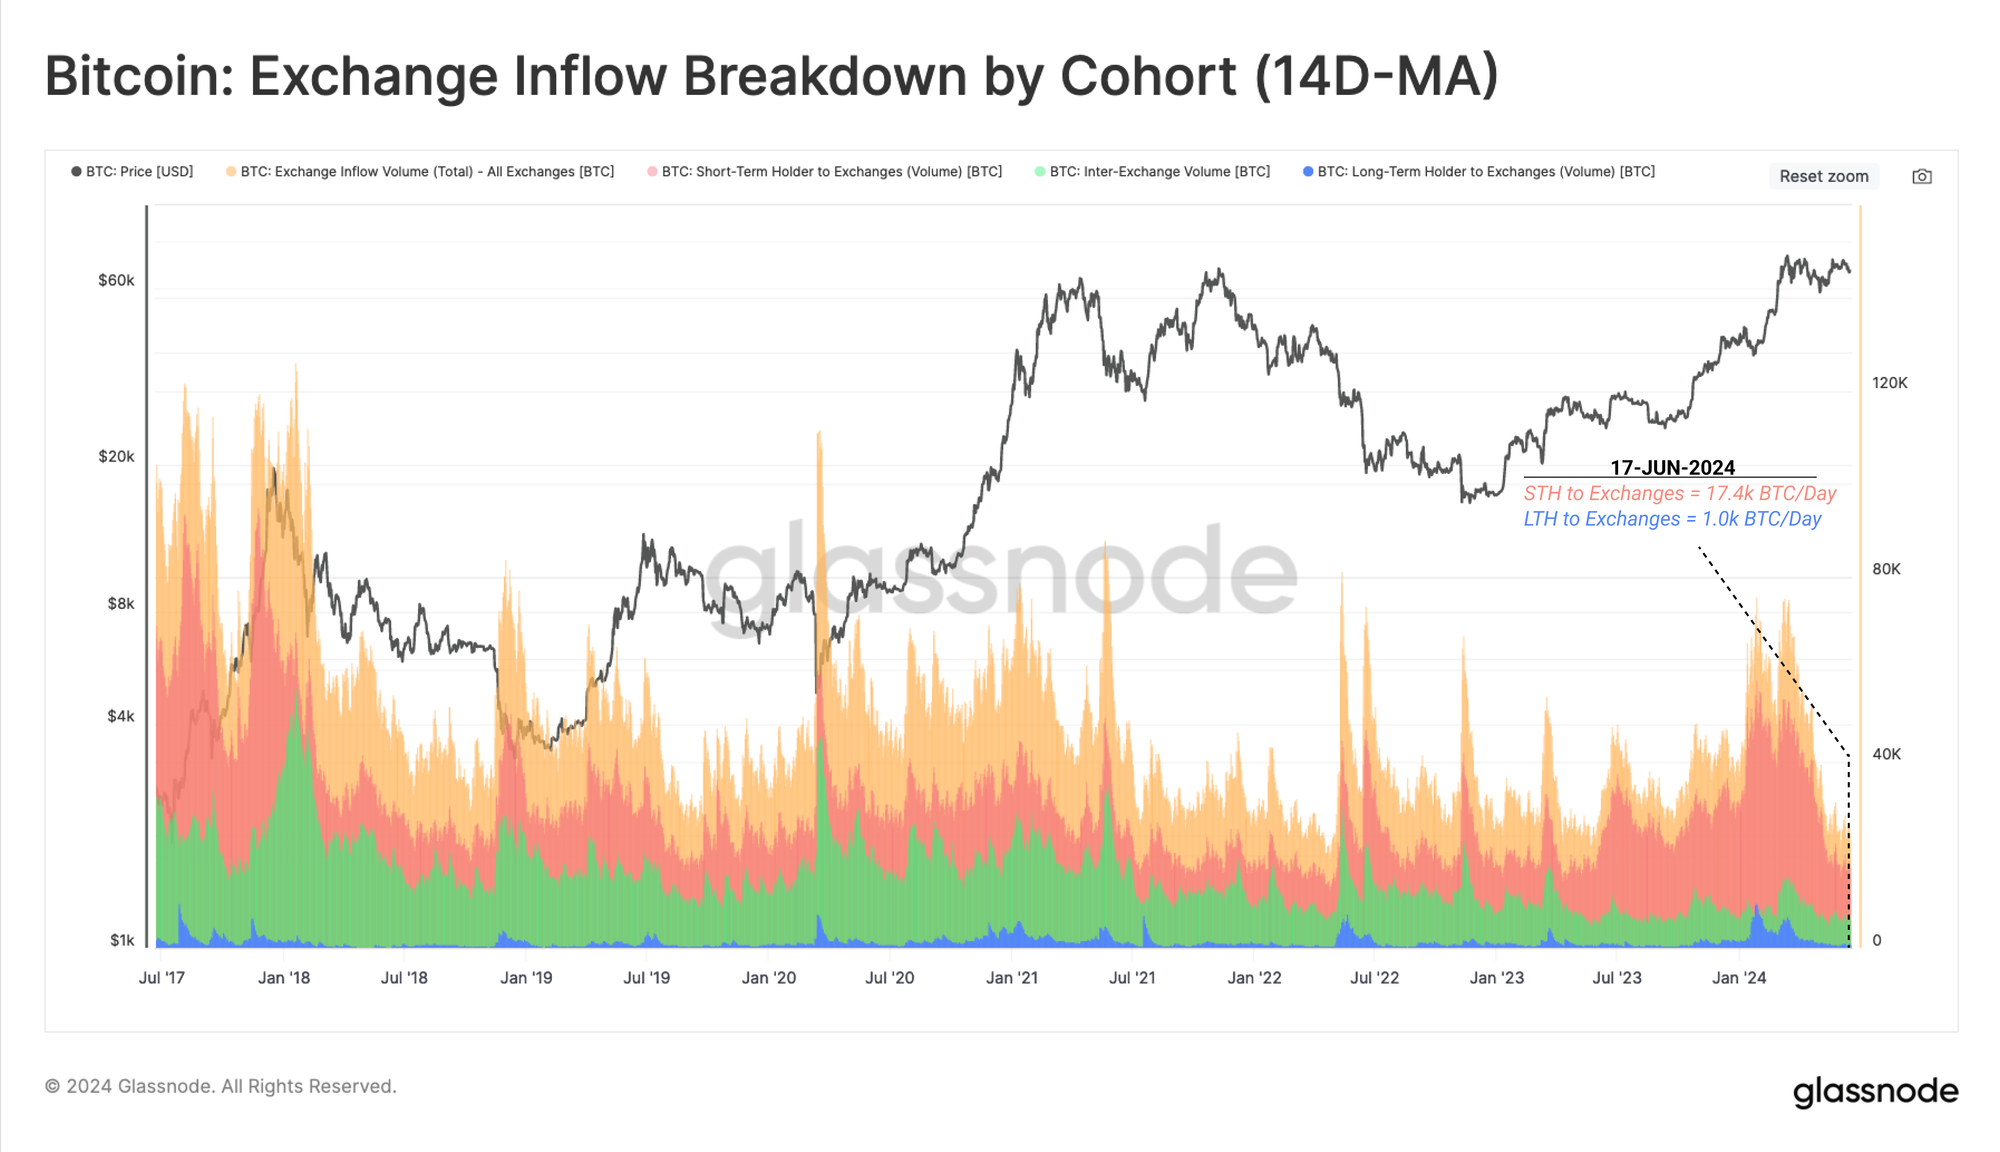
Moving one level deeper, we can inspect the onchain inflows to exchanges in a BTC denomination, we note once more a considerable reduction in activity.
At present, Short-Term Holders are sending around +17.4k BTC/day to exchanges. However, this is markedly lower than the peak of +55k BTC/day recorded as the market hit the $73k ATH in March, where speculation levels were becoming excessive. Conversely, Long-Term Holder distribution into exchanges is relatively low, with only a marginal 1k+ BTC/day in inflows currently.
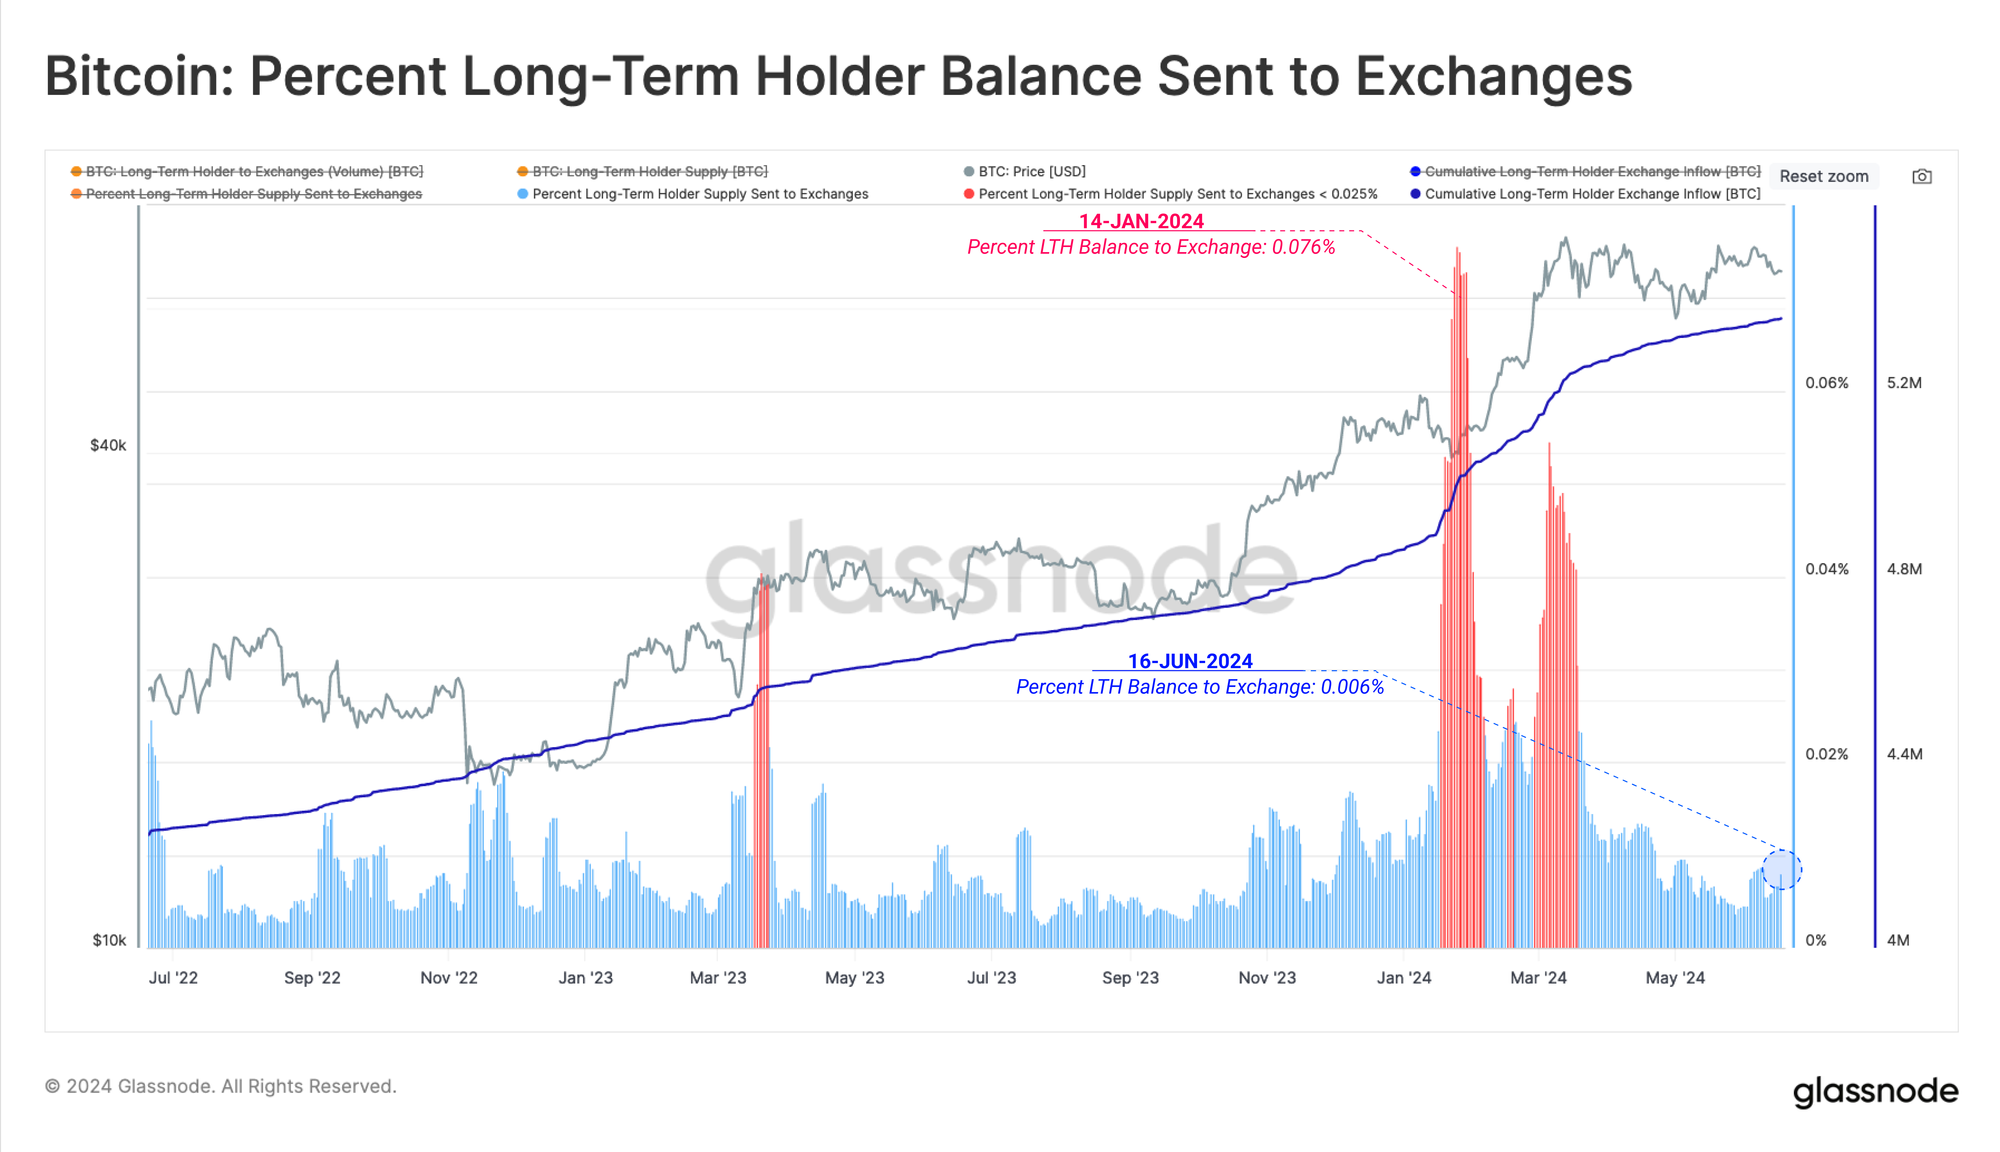
We can visualize the stark decline in LTH investor activity via the percentage of Long-term Holder balances sent to exchanges.
LTHs are sending less than 0.006% of their total holdings into exchanges, suggesting that this cohort has reached equilibrium and that higher or lower prices are required to stimulate further action.
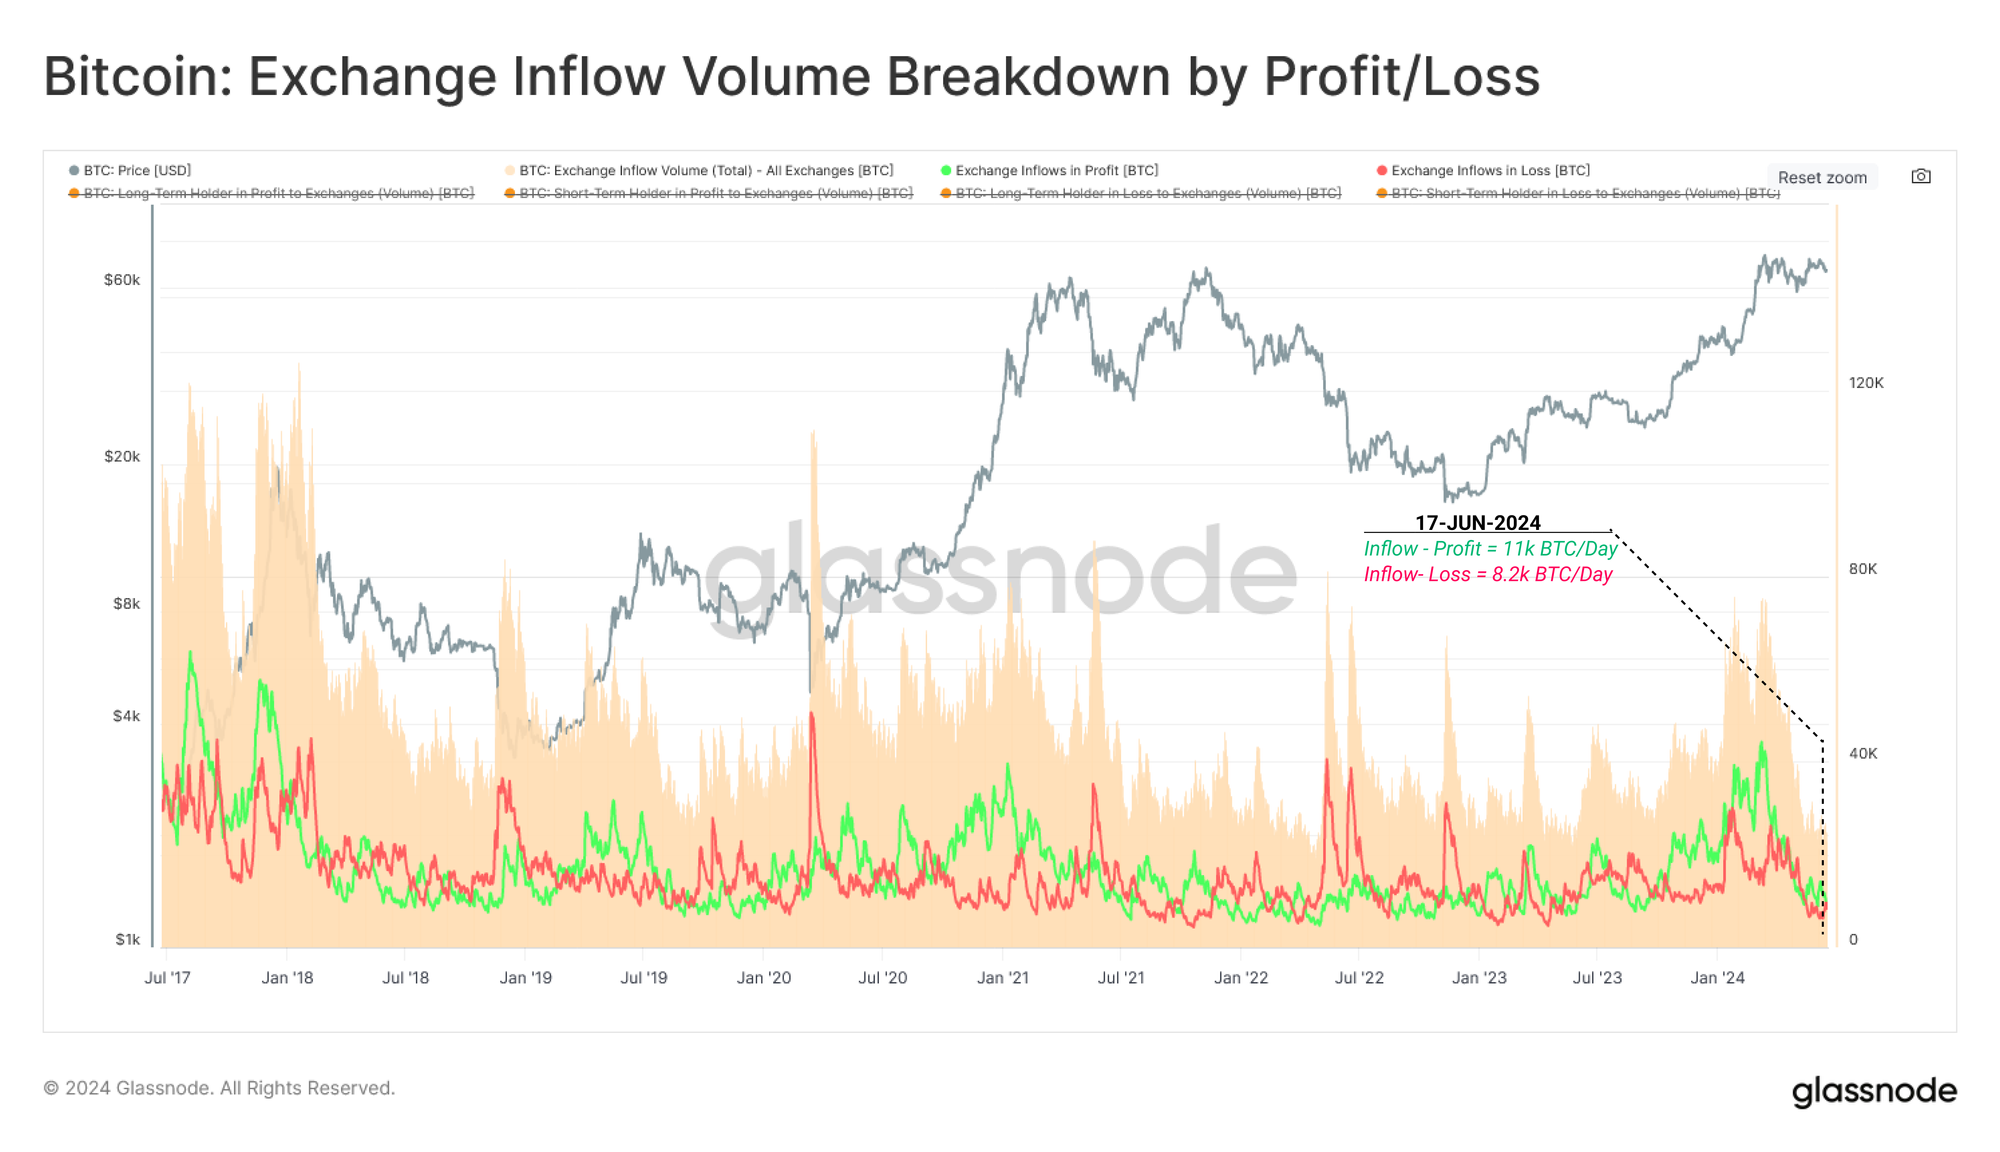
More coins are currently being transferred in a position of profit (+11k BTC) than in loss (+8.2k BTC). This suggests that a profit driven bias remains overall, albeit by a relatively small margin.
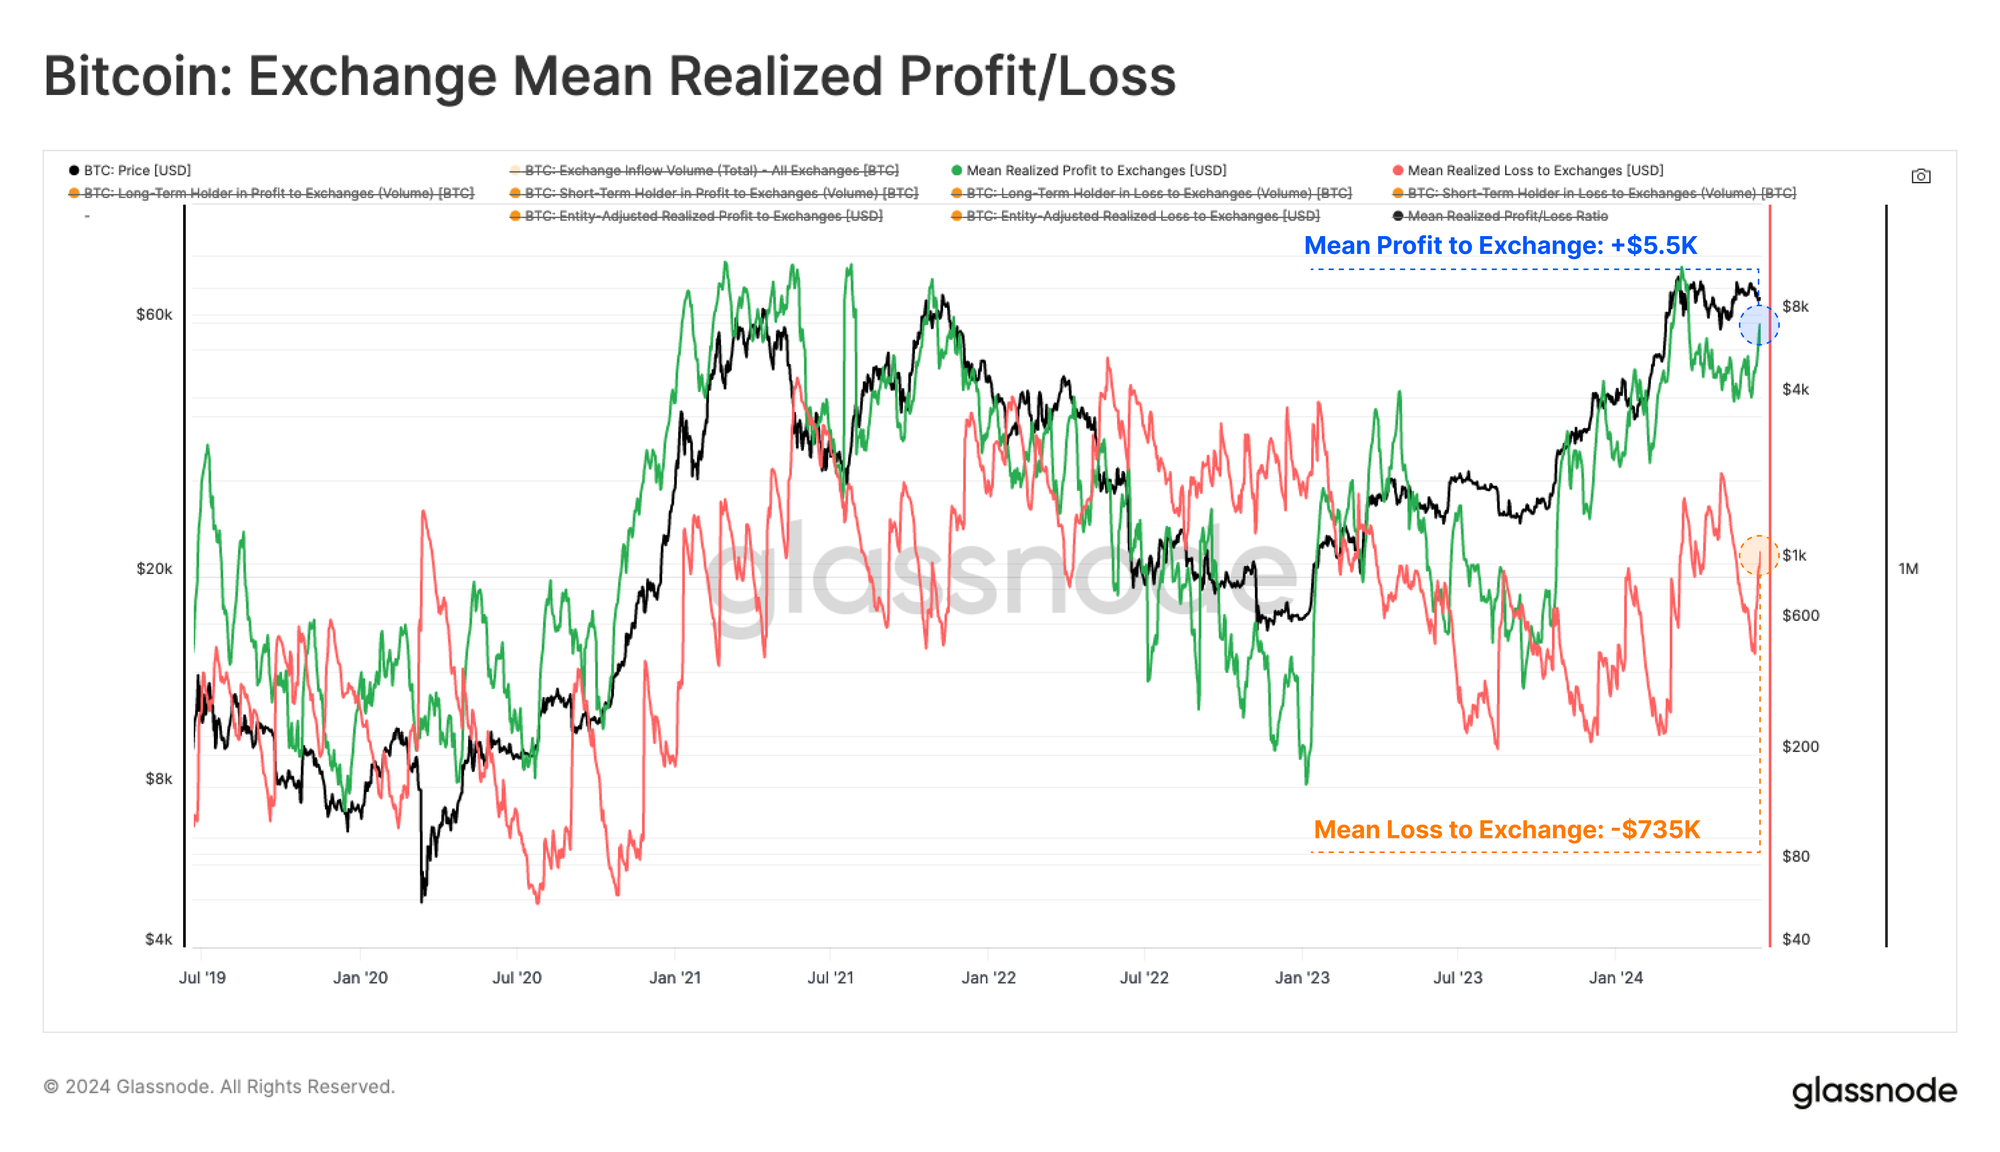
Currently, the average coin sent to Exchanges is realizing a profit of around +$5.5k and a -$735 haircut, respectively, for coins sent in the loss. This puts the average profit at 7.5x larger than losses, and only 14.5% of trading days have recorded a higher value in this ratio.
This infers that HODLers are still divesting, and demand is sufficient to absorb the sell-side pressure but not large enough to push market prices higher. This suggests that the market structure is more beneficial for range traders and arbitrage strategies rather than directional and trend trading strategies.
Cash and Carry Basis Trades
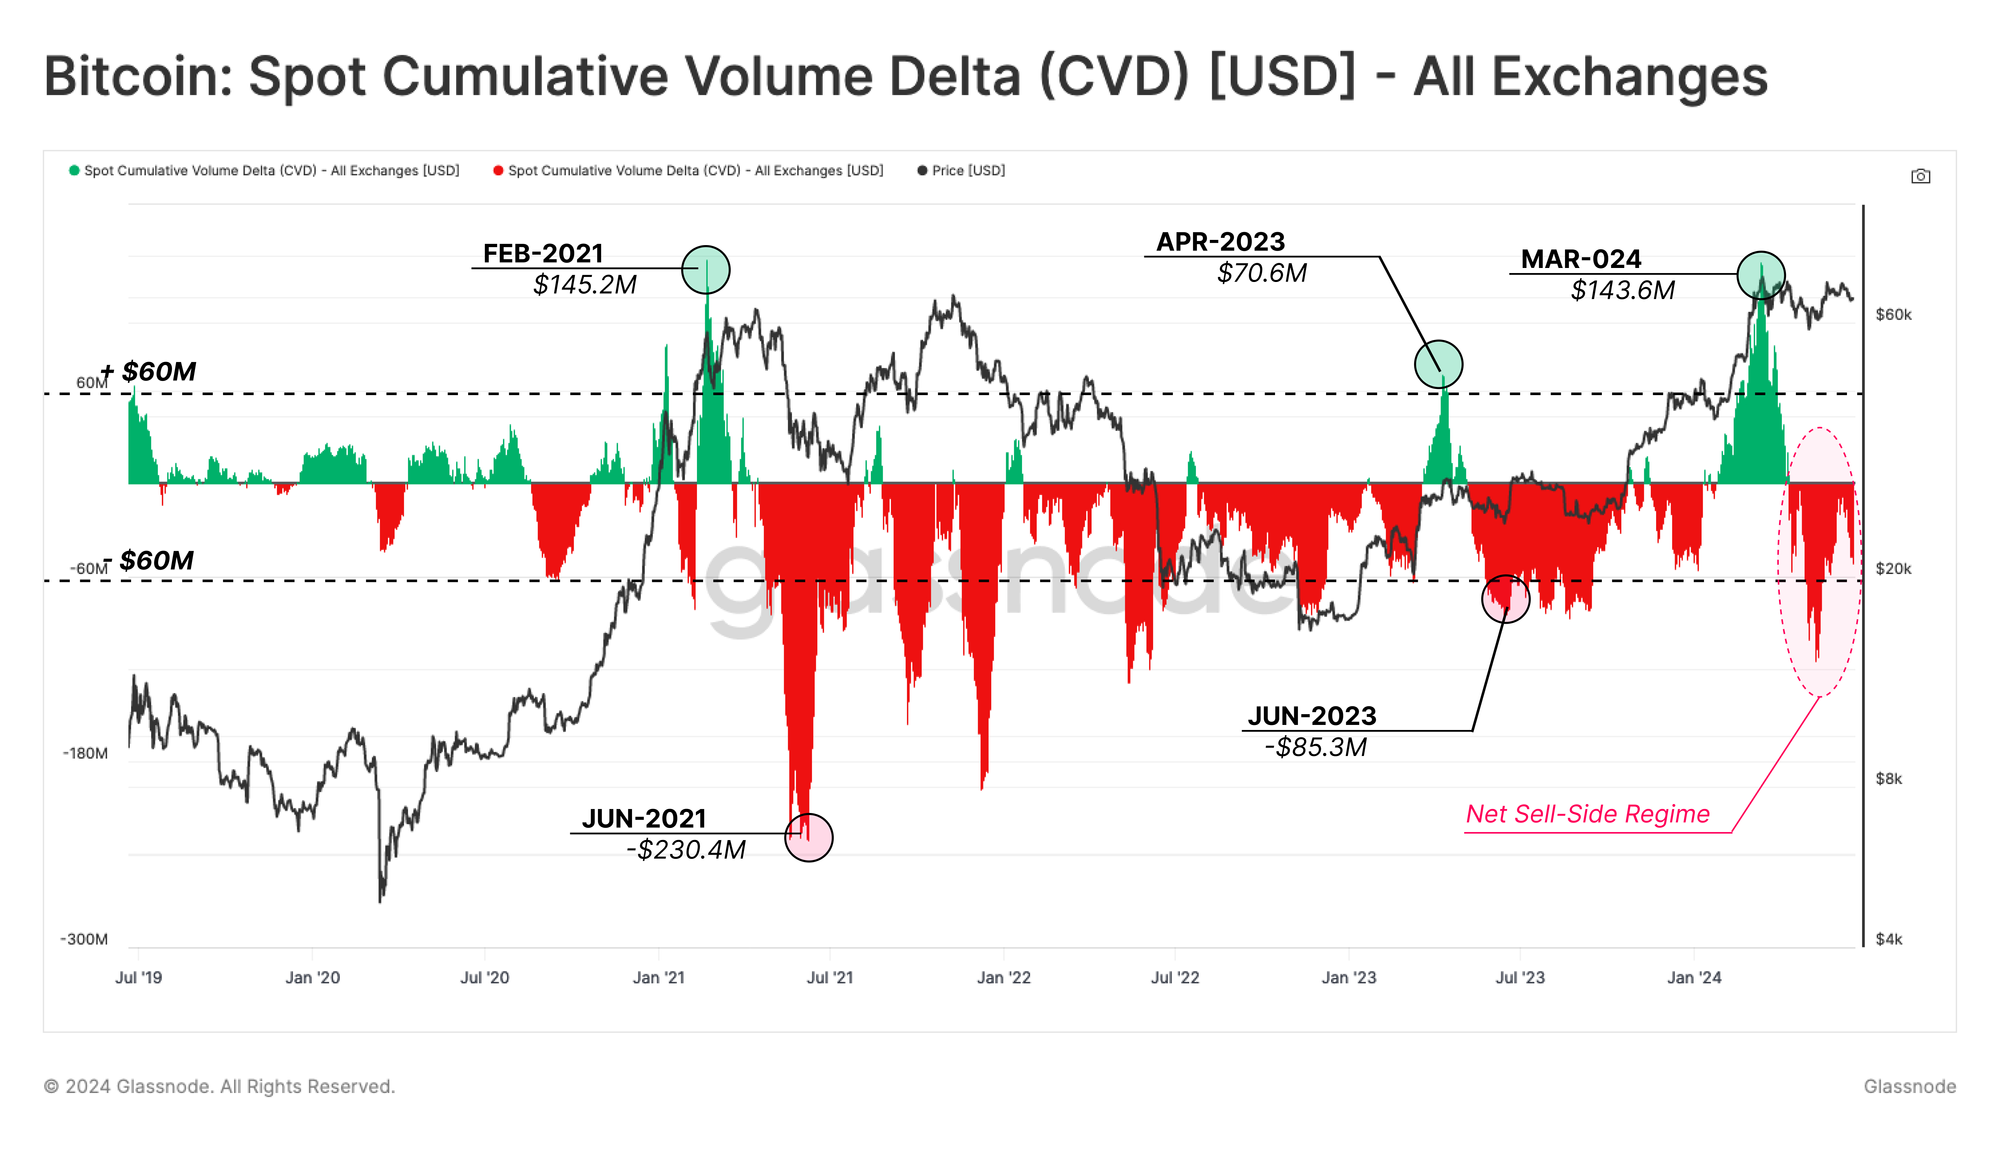
Another tool that enables us to characterize spot markets is the Spot Cumulative Volume Delta (CVD). This metric describes the net bias in market taker buy vs sell volume, measured in USD.
At the moment, a net sell-side bias dominates the spot market, however, the market continues to trend sideways. This confluences the aforementioned idea that the demand-side is approximately equivalent to the sell-side pressure, keeping the market range bound.
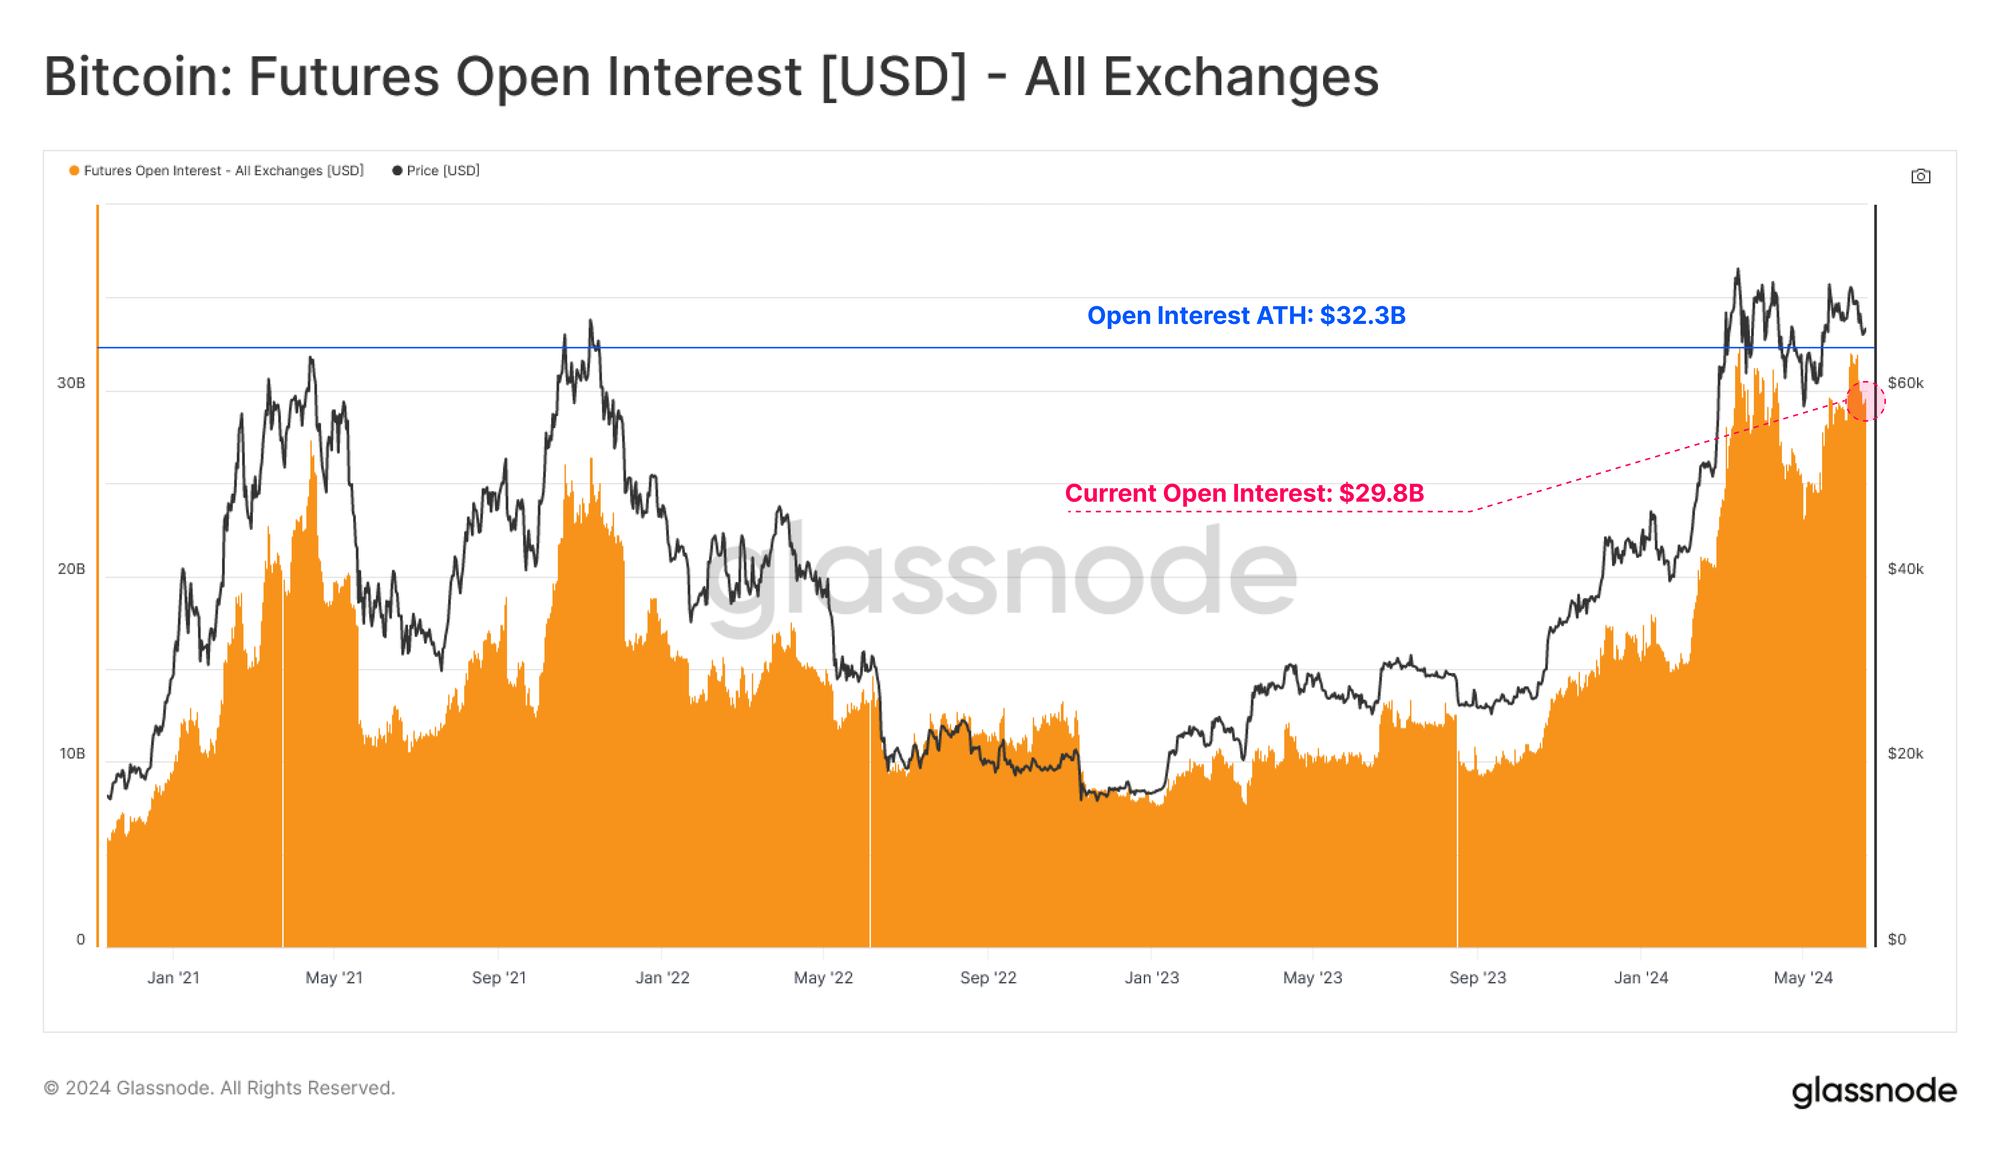
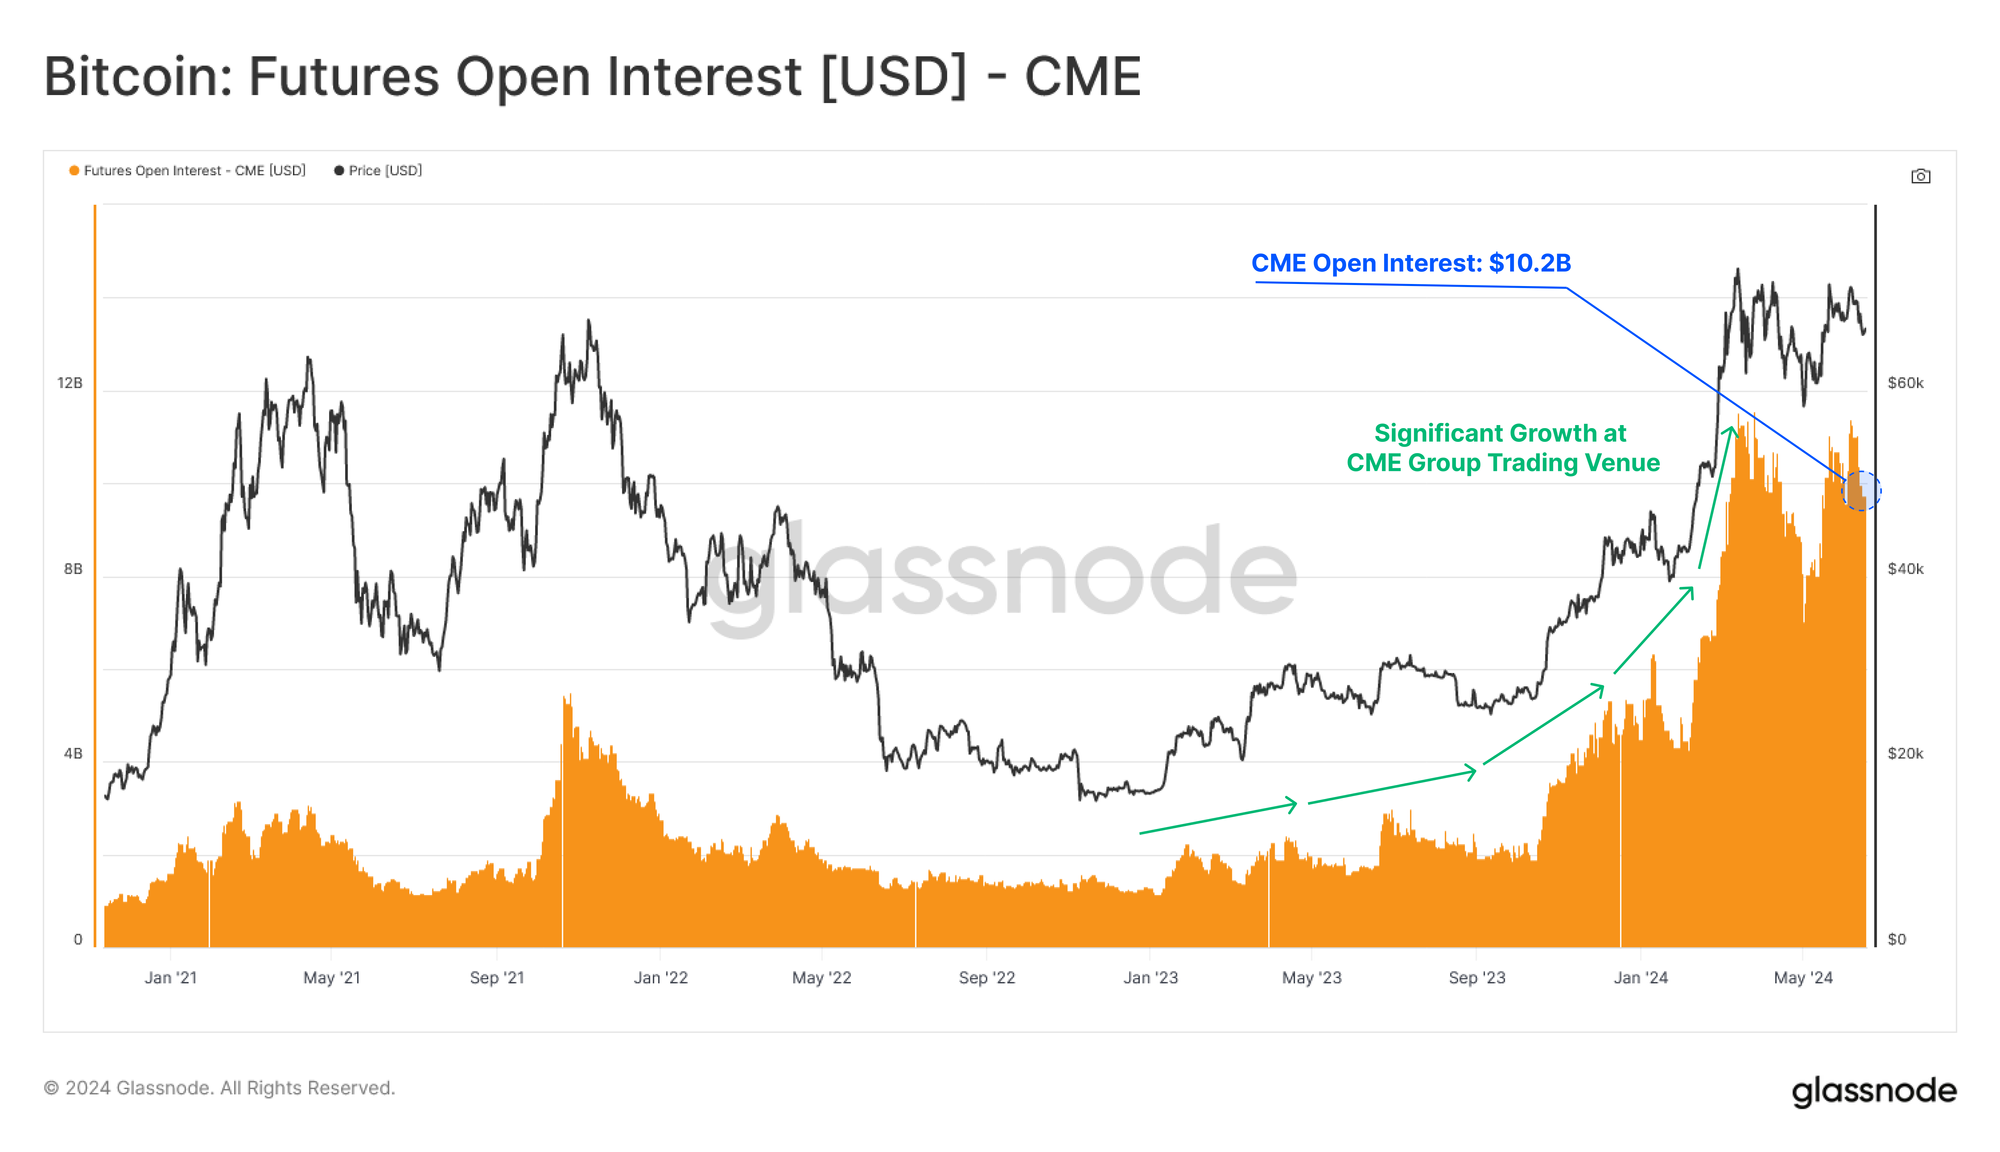
Assessing the futures market, we note a sustained elevation in open interest, currently over $30B, and just shy of its previous ATH. However, as highlighted in WoC-23, a substantial portion of this open interest is related to the market-neutral cash-and-carry basis trade.
In a range-bound market, increases in open interest can signify an uptick of volatility capture strategies as traders collect the premium available in the perpetual swap, futures, and options markets.
The considerable growth of open interest at the CME Group exchange highlights a growing presence of institutional investors. The CME Group exchange currently hosts over $10B in OI, representing just under a third of the global market share.
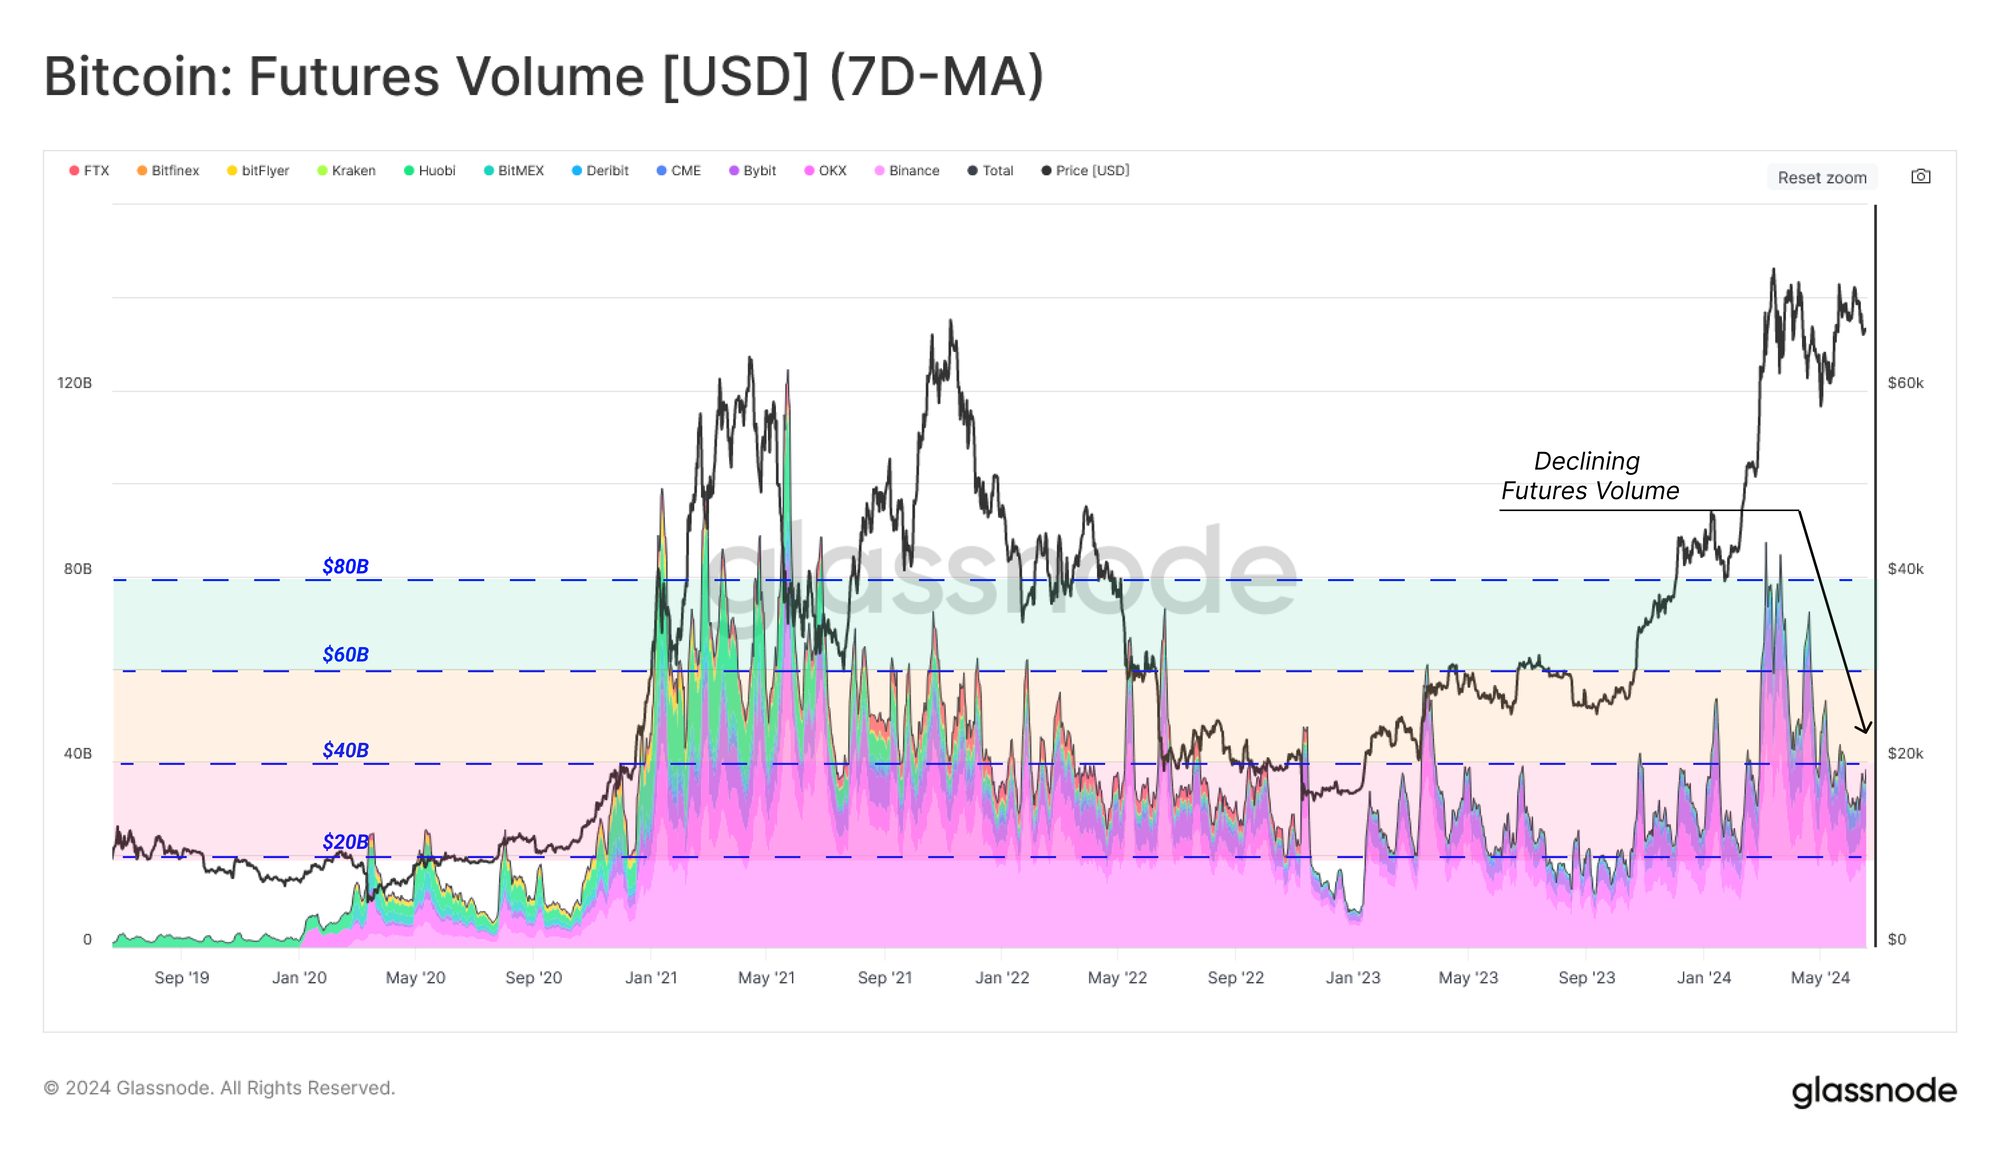
In contrast to the rising open interest, futures trade volumes have experienced a similar decline to spot markets and onchain transfer volumes. This suggests a relatively light appetite for speculation, and a higher dominance from set-and-forget basis trade and arbitrage positions.
Summary and Conclusions
Despite the choppy and sideways market conditions the average Bitcoin investor has remained largely profitable. However, investor decisiveness has declined as signified by contracting volumes across spot, and derivatives market, and also in on-chain settlement.
An equilibrium in both the demand and sell-side appears to be established, resulting in relatively stable prices, and a notable lack in volatility. This stagnation in market movement translates into a degree of boredom, apathy, and indecision by investors. Historically, this suggests that a decisive price movement in either direction is necessary to stimulate the next round of market activity.
Disclaimer: This report does not provide any investment advice. All data is provided for information and educational purposes only. No investment decision shall be based on the information provided here and you are solely responsible for your own investment decisions.
Exchange balances presented are derived from Glassnode’s comprehensive database of address labels, which are amassed through both officially published exchange information and proprietary clustering algorithms. While we strive to ensure the utmost accuracy in representing exchange balances, it is important to note that these figures might not always encapsulate the entirety of an exchange’s reserves, particularly when exchanges refrain from disclosing their official addresses. We urge users to exercise caution and discretion when utilizing these metrics. Glassnode shall not be held responsible for any discrepancies or potential inaccuracies. Please read our Transparency Notice when using exchange data.

- SEO Powered Content & PR Distribution. Get Amplified Today.
- PlatoData.Network Vertical Generative Ai. Empower Yourself. Access Here.
- PlatoAiStream. Web3 Intelligence. Knowledge Amplified. Access Here.
- PlatoESG. Carbon, CleanTech, Energy, Environment, Solar, Waste Management. Access Here.
- PlatoHealth. Biotech and Clinical Trials Intelligence. Access Here.
- Source: https://insights.glassnode.com/the-week-onchain-week-25-2024/

