Ascl1 and Ngn2 convert ESC to iN but generate different side lineages
Ectopic expression of Ascl1 or Ngn2 in mouse embryonic stem cells (ESCs) is sufficient to induce terminal differentiation into neurons28. Yet, the differences in transition mechanism toward neurons as well as possible side populations are not well characterized6,31. To examine this cell type conversion in detail, we generated clonal ESC cell lines expressing rtTA and TetO-Ascl1 or TetO-Ngn227,28 (Supplementary Fig. 1a). After doxycycline (Dox) addition, ESCs are rapidly converted to induced neurons: Ascl1 and Ngn2 produce cells expressing the neuronal marker TUBB3 and displaying neuronal morphology from day 3 and day 2 onward, respectively (Supplementary Fig. 1a). To report neuronal fate in these cell lines we endogenously tagged the pan-neuronal marker gene Mapt on its C-terminus with the fluorescent protein Venus27 (Supplementary Fig. 1b) and performed time-resolved bulk RNAseq upon Dox-induction. Cells were sorted into Venus-positive neurons and Venus-negative cell populations (Fig. 1a) from day 3 onward. As reported before28,30, both Ascl1 and Ngn2 give rise to similar iN cell identities (Fig. 1b; Supplementary Fig. 1c–e). Thus, initial ESC and terminal iN states are very similar between Ascl1 and Ngn2-induced conversions (Supplementary Fig. 1b bottom). This is in line with previous observations that transcriptomes converge to drive iN formation despite differences in the initial transcriptional response6 and follow an overall similar trajectory between ESC and iN in the PCA analysis (Fig. 1c, d; Supplementary Fig. 1g).
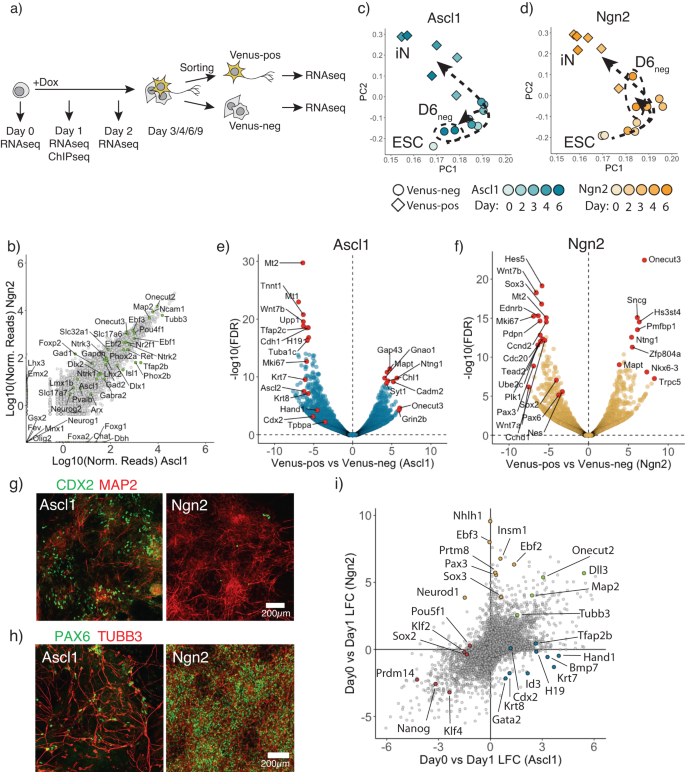
a Schematic overview of the experimental design. b Scatter plot comparing gene expression at Day 6 between Ascl1 and Ngn2 Venus-positive cells with various neuronal subtype specific markers indicated in green. c, d Principal component analysis of time-resolved bulk RNAseq after Ascl1 (c) or Ngn2 (d). Each data point corresponds to the single time point replicate. Color intensity shows day post-induction. Shape corresponds the Mapt-Venus reporter upregulation. Arrows show the trajectory cells take after the Ascl1 (c) or Ngn2 induction (d). e, f Vulcano plot comparing gene expression between Venus-positive and negative populations at day 6 post-induction of Ascl1 (e) or Ngn2 (f). Red circles denote top significantly upregulated or downregulated genes as well as example genes marking in trophoblast (e) or NSC lineages (f). g Representative immunostained cells for a trophoblast marker CDX2 and a neuronal marker Map2 at day 6 post-induction of Ascl1 or Ngn2. Trophoblast markers were expressed only after Ascl1 induction, but not Ngn2. h Representative immunostained cells for an NSC marker PAX6 and a neuronal marker TUBB3 at day 6 post-induction of Ascl1 or Ngn2. NSC markers were expressed only after Ngn2 expression, but not Ascl1. i Scatter plot comparing gene expression changes between Ascl1 and Ngn2 at day 1 post-induction. Highlighted circles are example genes that are neuronal markers expressed in both (green), trophoblast Ascl1 specific markers (blue), NSC Ngn2 specific markers (yellow), pluripotency related genes (red). Source data are provided as a Source Data file.
To investigate cells that fail to make iN in more detail, we focused on the Mapt-Venus-negative cells, which could represent incomplete or alternative differentiation outcomes. Mapt-Venus-negative cells generated by Ascl1 cluster closer to the initial ESC populations in PCA plots than Ngn2-induced Mapt-negative cells (Fig. 1c). However, this is not due to retaining a population of undifferentiated ESC as only a marginal number of cells express ESC marker NANOG in terminal population (Supplementary Fig. 1g), and NANOG and OCT4 are not expressed in Mapt-Venus population (Supplementary Fig. 1h). To identify the alternative type of cells generated by Ascl1, we used PanglaoDB32 using genes differentially expressed between Venus-negative and positive populations at day 6 (Fig. 1e, f; Supplementary Fig. 2a). Interestingly, Ascl1 produce cells expressing trophoblast markers such as Hand1, Cdx2, Tpbpa, Krt8 (Fig. 1e, g; Supplementary Fig. 2b–g) with mesenchymal morphology, which were not present in Ngn2-induced cultures (Fig. 1g, Supplementary Fig. 2b, c, f). We termed these cells induced-Trophoblast-like-cells (iT). Interestingly, many of the Krt8, Cdx2 positive iTs appeared binucleated, which could be a result of multinucleation similar to trophoblast lineage development in vivo (Supplementary Fig. 2e)33. The induction of iT could be due to Ascl1 mimicking the bHLH transcription factor Ascl2, a driver for the trophoblast lineage. Both Ascl1 and Ascl2 are evolutionary close and share near identical DNA binding domains and bind similar E-box motifs (Supplementary Fig. 2h–k)33,34,35,36,37. Lastly, to exclude clonal effects of the cell line used, we repeated these experiments in the background of an alternative mouse ESC line, E14. We introduced rtTA via a piggybac transposon vector and expressed Ascl1 from a Dox-inducible viral vector27 and generated 24 single-cell derived clones. All the clones showed the formation of both iN and iT, suggesting that the formation of iTs is a reproducible side product of ectopic Ascl1 expression in mouse ESCs (Supplementary Fig. 3).
In contrast to Ascl1 induction, Ngn2 induces Mapt-negative cells expressing NSC markers, such as Sox2, Pax3, Pax6, Nes (Fig. 1f, h; Supplementary Fig. 2a, 4a, b), as previously described21,38. Furthermore, Ngn2 reprogramming could be locked in the NSC-like state (iNSC) in the presence of FGF2 and EGF and is dependent on the Notch pathway39,40 (Supplementary Fig. 4c, d). In contrast, we did not observe NSC markers upregulated during Ascl1-induced differentiation (Fig. 1h, Supplementary Fig. 4b, c). To see if Ngn2 can use iNSC state as proliferative intermediate, we differentiated cells in the presence or absence of cytosine β-D-arabinofuranoside (AraC) from day 4 post-induction to inactivate dividing cells (Supplementary Fig. 4e). Indeed, addition of AraC drastically reduces Ngn2-produced iNs, while Ascl1 was insensitive to AraC treatment, suggesting that no continuously proliferative intermediate is present during Ascl1-induced iN reprogramming (Supplementary Fig. 4e). In summary, despite Ascl1 and Ngn2 converting mESC to similar iN subtypes, Ascl1 and Ngn2 produce distinct additional alternative cell lineages, suggesting that despite identical initial and terminal populations, differences exist that we sought to understand further (Supplementary Fig. 1b bottom).
Ascl1 and Ngn2 initiate paths with different transcriptional programs
To get a better understanding of different transcriptional response invoked by Ascl1 and Ngn2, we performed bulk RNAseq and ChiPseq on day 1 (Fig. 1a). Both Ascl1 and Ngn2 induce general neuronal markers such as Tubb3, Map2 and Onecut2 and downregulate general pluripotency markers like Nanog, Klf4 (Fig. 1i). Furthermore, Ascl1 strongly induces downstream targets Tfap2b, Lmx1b, while Ngn2 strongly upregulates Neurod1, Nhlh1 (Fig. 1i). In addition, Ascl1 upregulate Trophoblast lineage markers, e.g., Krt7/8, Hand1, while Ngn2 upregulates expression of NSC related genes, like Pax3 and Sox3 (Fig. 1i). Interestingly we observed that early in reprogramming cells are positive for both—neuronal and trophoblast markers (Supplementary Fig. 5a, b). In addition, we reanalyzed available scRNAseq data6 for Day 2 of ESC to iN conversion by Ascl1 and Ngn2 and could also observe cells positive for both neuronal and trophoblast markers (Supplementary Fig. 5c, d). This suggests that Ascl1 can induce both lineages simultaneously, which later are resolved into iN or iT cells (Supplementary Fig. 5b).
As reported by Aydin and colleagues6, Ascl1 and Ngn2 show different preferences for E-box motives, which in turn result in the activation of different subset of genes. Indeed, we confirmed Ascl1 and Ngn2 differential binding in ESC (Supplementary Fig. 6a). Furthermore, we see that Ascl1 and Ngn2 target genes differentially expressed between them as well as genes involved in the different alternative lineages, e.g., Hand1, Cdx2, Krt8 or Neurod1, Pax3, respectively (Supplementary Fig. 6b). Interestingly, Ascl1 binds trophoblast related genes also in MEF, although without iT induction (Supplementary Fig. 7a, b). However, in addition to iN induction, Ascl1 overexpression in MEF leads to Ascl1 binding to the skeletal muscle genes and the induction of myocytes7,16. Indeed, in ESC Ascl1 also strongly bind to skeletal muscle lineage-related genes, e.g., Myod1, Myog, Myf3, Tnnt2 (Supplementary Fig. 7c). However, we did not observe upregulation of these genes (Supplementary Fig. 7d). Thus, it is tempting to speculate that cellular context, such as cell type-specific histone modifications or transcription factors, affects the choice of the alternative lineage induced. Thus, in addition to the induction of the neuronal transcriptional program, additional genes are bound and transcribed, leading to the formation of alternative lineages. This “off target” transcriptional program depends on overexpression of transgene, e.g., Ascl1 or Ngn2, as well as the cellular context, e.g., ESC or MEF.
To investigate the general principles of the early transcriptional response in more depth, we used the STRING database to examine the gene regulatory network (GRN) of Ascl1 and Ngn2-upregulated differentially expressed genes (DEGs) one day after induction (Supplementary Fig. 8a, b). Both Ascl1 and Ngn2 DEGs form networks containing three distinct gene groups. Interestingly, Ascl1 and Ngn2 GRNs share groups containing genes involved in RNA and sterol metabolism, which can be attributed to the metabolic shift during conversion41,42. Furthermore, Ngn2 forms a more interconnected network than Ascl1, suggesting that Ngn2 invokes a more coherent transcriptional response than Ascl1 (Supplementary Fig. 8c).
To analyze the differences in more detail, we looked at the central-most connected nodes of both GRNs (Supplementary Fig. 8d, e). In contrast to Ascl1, Ngn2 induce genes driving neuronal differentiation Neurog2, Neurod1, Neurog1, Lhx2/3, Otx2, as well as genes involved in neural stem cell differentiation: Notch1, Hes5, Pax3, centering GRN around them (Supplementary Fig. 8e–g). Interestingly, Ngn2, Neurod1 and Ngn2 are known to be able to convert ESC to iN43. Thus, such a positive feedback loop together with the induction of strong lineage drivers and highly interconnected GRN can allow a more robust iN conversion and faster independence from the initial induction of the cassette. To test this hypothesis, we induced cells for 2, 4, or 6 days (Supplementary Fig. 8h). Indeed, we observe that efficient iN conversion with Ascl1 relies on the sustained expression of Ascl1, while Ngn2 efficiently induces conversion already after 2 days of induction (Supplementary Fig. 8h).
In summary, Ascl1 and Ngn2 bind and invoke different transcriptional profiles and subsequent mechanistic differences of the ESC to iN conversion. Where Ascl1 induction relies on the sustained expression of Ascl1, Ngn2 induces an overall more coherent network allowing efficient and fast reprogramming as well as induction of a proliferative intermediate.
Loss-of-function CRISPR/Cas9 screen to identify genetic dependencies for ESC to iN conversion
To establish a mechanistic handle on the underlying differences between Ascl1- and Ngn2-induced ESC reprogramming, we performed a CRISPR/Cas9 loss-of-function screen. We aimed to investigate two aspects of this conversion: first, the genetic dependencies of Ascl1 and Ngn2-induced neuronal conversion, and second, to elucidate the genes involved in alternative state formation (Fig. 2a). For this, ESC were infected with retroviral CRISPR-UMI sgRNA library containing ~27,000 guides targeting 6630 genes (4 guides per gene) and 108 non-targeting guides44. We then differentiated ESC for 6 days and enriched for iN using AraC and puromycin treatment (Fig. 2a, Supplementary Fig. 1b, 9a). In addition, we assessed dependencies for iT and iNSC differentiation (Fig. 2a, see “Methods”). For an initial assessment of the screening results, we compared the depletion of known essentials in ESC versus the Library (Fig. 2b). We indeed observed a strong depletion in common essential genes as defined by Hart et al.45. Furthermore, genes at the core pluripotency network (Nanog, Sox2, Pou5f1) are among the most essential genes, while tumor suppressors including Trp53, Fbxw7, Rock1 are strongly enriching in ESC (Fig. 2b), showing that our library is effective at gene targeting and revealing gene knockout phenotypes.
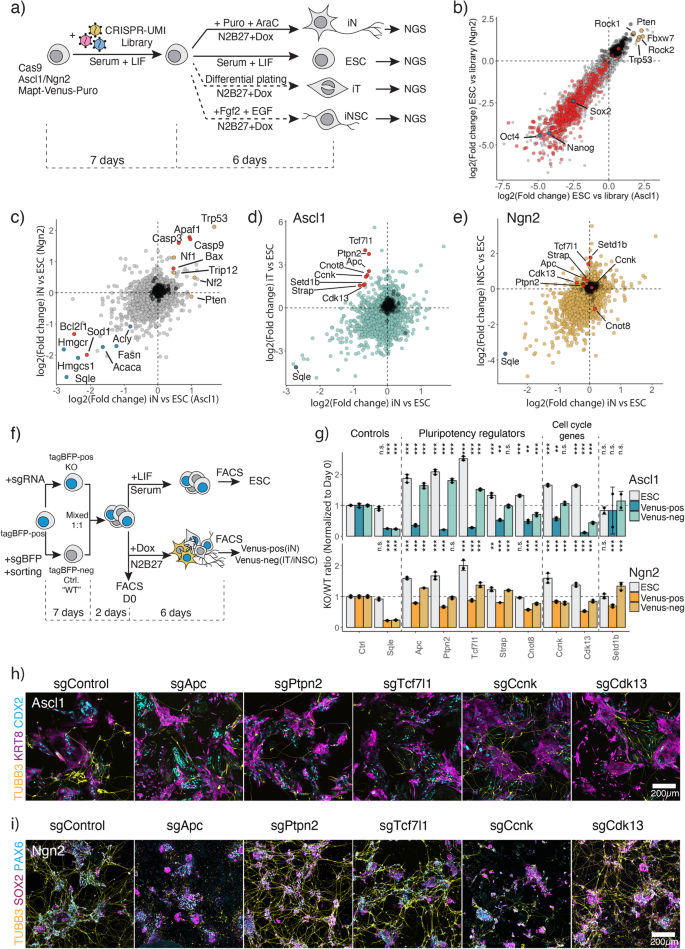
a CRISPR-Cas9 screen experimental outline. b Comparative analysis of the gene knockout effects between Ascl1 and Ngn2 transgenes carrying ESC. Difference in guide abundance was calculated between uninduced ESC at Day 13 post library infection (a) versus library plasmid pool. Dots represent genes; axis shows depletion in LFC in each cell line. Red represents core essential genes as defined by Hart et al.45, blue—core pluripotency genes, yellow—tumor suppressors. c Comparative analysis of gene knockout effects of Ascl1 or Ngn2-induced iN versus ESC. Red dots represent apoptosis related genes, yellow—tumor suppressor genes, blue—cholesterol biosynthesis genes. d Comparative analysis of gene knockout effects of Ascl1-induced iN or iT versus ESC. Red dots represent genes chosen for validation. Sqle is a positive control for a strong depletion. e Comparative analysis of gene knockout effects of Ngn2-induced iN or iNSC versus ESC. Red dots represent genes chosen for validation in (d). Sqle is a positive control for a strong depletion. f Experimental outline of hits validation from (d). g FACS-based validation of the hits. Bar represents the normalized ratio to the initial mixture ratio at day 0. N = 3 independent biological replicates. Bar plot shows mean ± SD. p-values, indicated above, were determined by one-way ANOVA followed by Dunnett’s multiple comparison test (two-sided) using Ctrl ratio as a control. “n.s.” not significant, “*” p < 0.05, “**” p < 0.01, “***” p < 0.001. h, i Immunostaining of the knockout cells for neuronal marker Tubb3 and alternative lineage markers KRT8/CDX2 for Ascl1-induced iT (h), and SOX2/PAX6 for Ngn2-induced iNSC (i). Source data are provided as a Source Data file.
To identify common genetic dependencies of iN formation, we compared guide abundance in the ESC versus iN at D6 (Fig. 2c). Guides showing the strongest depletion are targeting, for instance, fatty acid metabolism and sterol biosynthesis, such as Fasn, Hmgcr, Hmgcs1, Sqle, an essential component for neuronal metabolism (Fig. 2c)41,42. Furthermore, during iN differentiation, cells undergo high levels of stress due to lipid peroxidation and can commit cell death via apoptosis or ferroptosis46,47. Hence, we find proapoptotic genes, Casp3/9 and Bax enriching, while antiapoptotic genes such as Bcl2l1 and Sod1 are depleting from the population (Fig. 2c; Supplementary Fig. 9b). In addition, knockout of tumor suppressors, e.g., Trp53, Nf1, Nf2, allows for higher iN conversion. Thus, this screen yields genetic dependencies in ESC to iN conversion at high resolution.
To uncover differential genetic dependencies between iN and alternative states, relative sgRNA abundance was correlated with a particular focus on genes depleted in iN and enriched in the alternative states. We focused on differential dependencies between the Ascl1-induced iN and iT (Fig. 2d). We picked genes for validation based on the following criteria: (1) genes showing little effects in ESC (−2 < LFC < 2); (2) genes showing enrichment in iT (LFC > 1.5); (3) genes depleted in iN (LFC < −0.5). We noticed that genes important in the regulation of pluripotency network and differentiation of ESC: Tcf7l1, Ptpn2, Apc, Strap, Cnot848,49,50,51,52,53,54, as well as cell cycle genes Ccnk and Cdk1355,56 are required for Ascl1-induced iN conversion while inhibiting iT formation. In contrast, knockout of these hits had little to no influence on Ngn2-driven conversion to neurons (Fig. 2d, e).
To validate the findings, we performed a competition assay. To implement an internal control, we introduced a constitutive tagBFP vector in our cell line and derived a clone with a stable tagBFP expression. The cells were then infected with the sgRNA that showed the strongest depletion in the screen. Separately, we generated an isogenic control population, by targeting tagBFP with a control guide against tagBFP and sorting for tagBFPneg cells. Subsequently, knockout and control cells were mixed in a 1:1 ratio and maintained for an additional passage to adapt them to the same conditions, before plating cells for induction (Fig. 2f). After 6 days of induction, we assessed iN Mapt-Venus-positive population, as well as Venus-negative population, corresponding to the formation of iT/iNSC populations (Fig. 2f, g). In addition, we assessed the fitness of the knockouts in the ESC cells while growing ESC for additional 6 days (Fig. 2f). As anticipated, Sqle was essential in iN, iT or iNSC populations, while not in ESC cells, mirroring the screen results (Fig. 2c–e, g). Similarly, knockout of pluripotency-related genes Apc, Tcf7l1 and Ptpn2 abolished the formation of iNs upon induction with Ascl1, while allowing the formation of iT cells (Fig. 2g). We further confirmed the phenotype via immunostaining at day 6 post-induction (Fig. 2h, i). Knockout of the hits resulted in failure to generate TUBB3 positive neurons by Ascl1 while still generating CDX2+ and KRT8+ cells. Interestingly, some cells expressing neuron-specific TUBB3 lack neuronal morphology, indicating activation of neuronal genes but failure to establish a final iN state (Supplementary Fig. 9c). Likewise, targeting of Ccnk or Cdk13 strongly reduced the number of iNs upon Ascl1 induction. In contrast to Ascl1, Ngn2 iN conversion is not impaired upon loss of Tcf7l1, Ptpn2, and Cdk13 and Ngn2 can still generate both neurons and neural stem cells, marked by SOX2 and PAX6 (Fig. 2g–i). However, Apc and Ccnk knockouts did affect the formation of iN and iNSC induced by Ngn2. Off note, we additionally validated multiple other genes showing differential dependencies between Ascl1 and Ngn2 induction (Supplementary Fig. 9d–h). Taken together, our parallel CRISPR/Cas9 loss-of-function screens unveiled multiple common and differential dependencies between Ascl1- and Ngn2-induced directed differentiation to iNs.
Rapid downregulation of pluripotency network upon Ascl1 induction
As the screen identified genes involved in maintaining the pluripotency network as essential for the Ascl1-induced iN formation, we investigated how Ascl1 and Ngn2 disassemble the pluripotency network in more depth. For this, we used ingenuity pathway analysis using all differential expressed genes one day post Ascl1- or Ngn2-induction (Supplementary Fig. 10a–d, Fig. 1i). As before, ingenuity canonical pathway enrichment analysis showed that both Ascl1 and Ngn2 induce pathways related to cholesterol biosynthesis (Supplementary Fig. 10b, d). Interestingly, the Ascl1 transcriptional response is centered around the downregulation of the ESC pluripotency network and self-renewal (Supplementary Fig. 10a, b).
We then divided DEGs into Ascl1 or Ngn2 specific, or common and performed KEGG pathway enrichment analysis (Fig. 3a, b; Supplementary Fig. 10e). Interestingly, Ascl1 upregulates genes involved in cellular senescence and cell cycle exit, such as Cdkn1a, Cebpa, Cebpb (Supplementary Fig. 8d, g)57,58, as well as downregulates more genes involved in pluripotency, e.g., Pou5f1 (encoding for protein OCT4), Klf2, Sox2, Lef1, Lefty2, compared to Ngn2 (Fig. 3b, Fig. 1i, Supplementary Fig. 10e). Thus, we next looked at the dynamics of the pluripotency network (PPN) shutdown upon Ascl1 and Ngn2 induction. For this, we focused on the three core pluripotency genes: Pou5f1 (Oct4), Sox2, Nanog (Fig. 3c, Fig. 1i). Nanog is downregulated at similar kinetics between Ascl1 and Ngn2 (Fig. 3c, Fig. 1i, Supplementary Fig. 11a, b). In contrast, Sox2 expression is retained after Ngn2 induction as an NSC gene regulatory network is established, while Ascl1-induced cells lose expression of Sox2 (Fig. 3c, Fig. 1i, Supplementary Fig. 11a, b). Similarly, Ascl1 induction leads to a rapid loss of Oct4 expression, while Ngn2 induction leads to gradual downregulation of Oct4 (Fig. 3c–e, Fig. 1i). Furthermore, loss of Oct4 corresponds with the upregulation of trophoblast marker KRT8 (Fig. 3f).
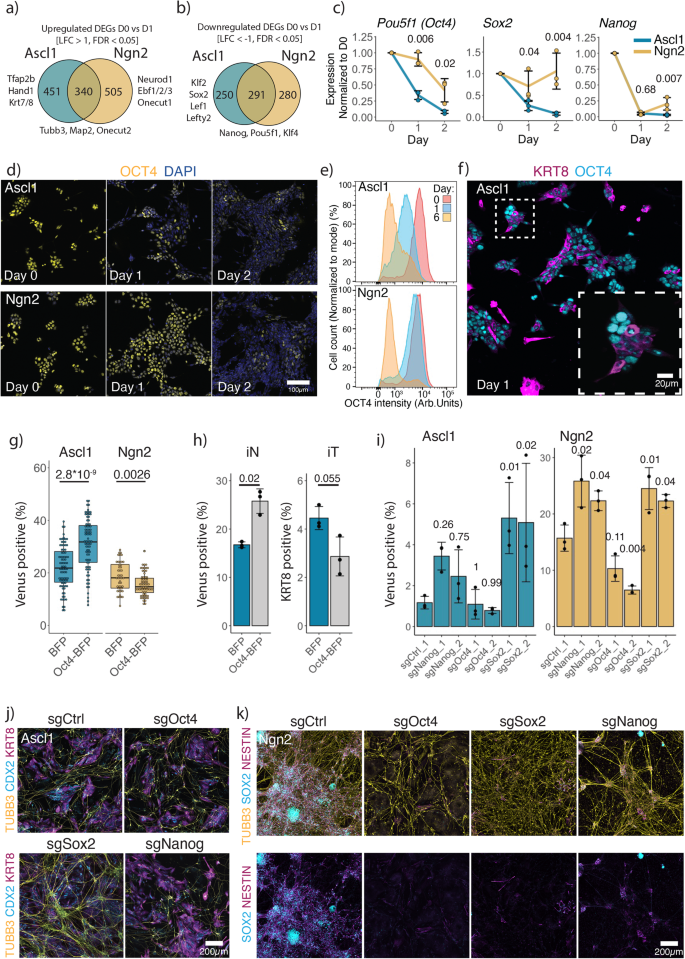
a, b Number of Ascl1, Ngn2 specific or common upregulated (a) and downregulated (b) genes from Fig. 1i. c qPCR data of the expression of the core pluripotency genes (normalized to the expression of Actin and day 0). Lines are drawn through the mean of n = 3 biologically independent samples; error bars indicate ± SD. Above, p-values of the two-sided Welch two-sample t-test comparing PPN genes expressed between Ascl1 and Ngn2 at the given time point. d Representative immunostainings for the OCT4 dynamics after Ascl1 or Ngn2 induction. e Quantification of OCT4 expression using intracellular immunostaining followed by FACS. f Representative immunostaining for the pluripotency marker OCT4 and trophoblast marker KRT8 at day 1 after Ascl1 or Ngn2 induction. g Efficiency of iN formation in the presence of OCT4 overexpression. Each dot represents an individual ESC clone containing an overexpression construct. Efficiency is measured by the percentage of Mapt-Venus population. Boxplots indicate 25th and 75th percentiles as bounds of the box with the median center line; whiskers indicate minima/maxima of a 1.5x distance of the IQR from the 25th and 75th percentiles. p-value of the two-sided Welch two-sample t-test indicated above. h Efficiency of iN formation, measured by the percentage of Mapt-Venus expressing cells, and iT formation, percentage of cells immunostained for KRT8 of polyclonal population overexpressing Oct4-BFP. Bar plot shows mean of n = 3 independent biological replicates with ± SD; the p-values were calculated using the two-sided Welch two-sample t-test. i Efficiency of iN formation upon acute knockout of core pluripotency. Efficiency is measured by the percentage of Mapt-Venus population. The bar plot shows mean of n = 3 biologically independent samples with ± SD. p-values, indicated above, were calculated using one-way ANOVA followed by Dunnett’s multiple comparison test (two-sided) using sgCtrl as a control. j Representative immunostainings of (i) for iN and iT induced by Ascl1. j Representative immunostainings of (i) for iN and iNSC induced by Ngn2. Source data are provided as a Source Data file.
To test the functional relevance of the loss of Oct4, we constitutively overexpressed Oct4 and generated multiple clonal mESC cell lines (Fig. 3g, h). While overexpression of Oct4 together with Ngn2 leads to a reduction of the iN population, co-expression of Oct4 and Ascl1 increases the efficiency of iN formation (Fig. 3g, h). In turn, iT formation is hampered in the presence of Oct4 (Fig. 3h). During development, Oct4 inhibits differentiation of the trophectoderm lineage, and rapid loss of Oct4 is associated with the upregulation of the trophectoderm markers59,60. Thus, rapid loss of Oct4 generates permissive conditions for iT lineage formation, that compete with the formation of iN.
Given the kinetic differences in the downregulation of PPN after Ascl1 or Ngn2 induction, we tested if enforced disruption of the PPN together with differentiation would affect the ESC to iN conversion. As Pou5f1 (Oct4), Sox2 and Nanog are essential for ESC (Fig. 2b), we infected cells with the guides targeting Pou5f1 (Oct4), Sox2 and Nanog 2 days before the induction of Ascl1 or Ngn2 (Fig. 3i–k). Interestingly, Ascl1 induction leads to the formation of both iN and iT in the knockout of all pluripotency factors (Fig. 3j). We see little to no effect after targeting Oct4, as Oct4 is rapidly lost upon Ascl1 induction (Fig. 3i). However, knockout of Nanog or Sox2 favors iN formation, suggesting that additional disruption of the PPN supports installment of the iN state (Fig. 3i, j). In turn, knockout of Sox2 abolished the formation of iNSC by Ngn2, showing that Sox2 is repurposed from the PPN to the NSC gene regulatory network (Fig. 3i, k). Similarly, disruption of either Nanog or Pou5f1 (Oct4) also resulted in loss of iNSC (Fig. 3k). Instead, we observed formation of primitive endoderm and trophoblast upon loss of Nanog or Pou5f1 (Oct4), respectively (Fig. 3k, Supplementary Fig. 11c, d), in alignment with the outcome of the loss of these factors during the development59,60,61.
This data, together with differential dependencies identified in the CRISPR screen, shows that Ascl1 and Ngn2 induction leads to pronounced functional differences in exiting the pluripotency state of ESC. Ascl1 induction leads to an efficient shutting down of PPN and later induction of iN or iT gene network, while Ngn2 does not fully downregulate the PPN and instead overlays both networks, repurposing genes for the induction of NSCs.
Tcf7l1 is required for cell cycle exit to generate Ascl1 iNs
We next focused on Ascl1-induced PPN shutdown. In Ascl1-driven MEF to iN transdifferentiation, Myt1l facilitates iN formation by repressing initial fibroblast GRN as well as alternative myoblast lineage16,62. Given the fast downregulation of PPN, we tested if Myt1l is similarly required for ESC to iN conversion. However, our screen did not reveal that Myt1l, or its paralogs Myt1 and St18, are required for ESC to iN conversion (Supplementary Fig. 12a) as well as validation experiments using additional sgRNAs (Supplementary Fig. 12b). In the CRISPR screen we identified Tcf7l1 (T cell factor/lymphoid enhancer factor, also known as Tcf3), a repressor of PPN, as essential for iN formation by Ascl1. We confirmed the Tcf7l1 knockout phenotype in a separate E14 background and ruled out that the loss of Tcf7l1 affected the expression of the Ascl1 transgene (Supplementary Fig. 12c–e). Tcf7l1 is poised on the multiple promoters of PPN-related genes and rapidly represses their expression upon ESC differentiation48,63,64, and the absence of Tcf7l1 stabilizes the ESC state64. Thus, we wanted to test if Tcf7l1 is required before or after the onset of cell type conversion, as well as exclude secondary effects due to the stabilization of the PPN before the conversion. For this, we N-terminally tagged Tcf7l1 with an Auxin inducible degron, infected cells with lentiviral vector carrying osTIR1 (F-box E3-ubiquitin ligase, derived from Oryza sativa) and generated single cell-derived clones (Supplementary Fig. 12f)65. We then depleted Tcf7l1 before or at the onset of conversion by the addition of Auxin (Supplementary Fig. 12g). While Tcf7l1 depletion before induction had only a mild effect on the formation of iN, degrading Tcf7l1 on the onset of Ascl1 induction severely reduced the number of neurons produced by Ascl1 (Supplementary Fig. 12g). This indicates that Tcf7l1 acts after the induction rather than stabilizing the PPN.
To understand the role of Tcf7l1 in the Ascl1-induced ESC to iN-directed differentiation, we generated single cell-derived clones with a homozygous Tcf7l1 knockout and performed bulk RNAseq at day 1 post-induction (Supplementary Fig. 13a). As Tcf7l1 acts as a pluripotency network repressor during ESC differentiation, we first looked at the pluripotency shutdown in the Tcf7l1 knockout cells. Surprisingly, the PPN was still downregulated after Ascl1 induction in the absence of Tcf7l1 (Fig. 4a; Supplementary Fig. 13a). However, we observed a group of genes that failed to be expressed in ΔTcf7l1 clones (Supplementary Fig. 13a). Interestingly, Cdkn1c is highly upregulated after Ascl1 induction in comparison to ΔTcf7l1 (Supplementary Fig. 13a), and its expression is specific for Ascl1 induction and peaks at day 3 of ESC to iN conversion (Fig. 4b, c; Supplementary Fig. 13b). In addition, Ascl1 shows strong binding near Cdkn1c locus in comparison to Ngn2 (Fig. 4d).
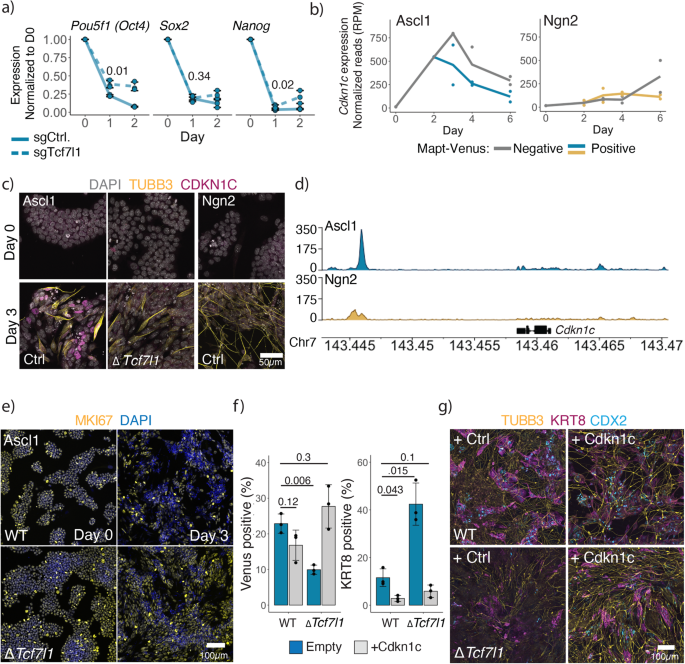
a qPCR of core pluripotency gene expression after induction in WT and Tcf7l1 KO cells. Expression normalized to Actin and day 0. Lines are drawn through the mean of n = 3 biologically independent samples; error bars indicate ± SD. p-values of the two-sided Welch two-sample t-test comparing sgTcf1l1 vs sgControl at day 1 indicated above. b Cdkn1c expression during ESC to iN conversion (Fig. 1a). c Immunostainings of CDKN1C on day 0 and day 3 of the ESC to iN conversion by Ascl1 WT or Tcf7l1 KO or Ngn2 expressing cells. d Binding of the Flag-Ascl1 or Flag-Ngn2 in the Cdkn1c locus at day 1 post-induction. Data showing combined reads of four replicates. e Immunostainings of proliferation marker MKI67 after induction of Ascl1 in WT or Tcf7l1 KO ESC cells. f FACS data of Cdkn1c overexpression with Ascl1 in WT or Tcf7l1 KO ESCs. The efficiency of iN formation is measured by the percentage of Mapt-Venus population, efficiency of iT formation is measured by the percentage of cells immunostained for KRT8. The bar plot shows mean of n = 3 independent biological replicates with ± SD. p-value of the two-sided Welch two-sample t-test indicated above. g Representative images of immunostained cells for neuronal TUBB3 and trophoblast CDX2/KRT8 markers at day 6 post-induction of WT or Tcf7l1 KO ESCs with Ascl1 and Cdkn1c. Source data are provided as a Source Data file.
Ascl1-directed differentiation is cell cycle-dependent
Cdkn1c is a cyclin-dependent kinase inhibitor of the cip/kip family regulating cell cycle arrest in G166. Cdkn1c is essential for embryonic development, and mice lacking Cdkn1c die perinatally with multiple developmental defects. Furthermore, Cdkn1c is important for the development of early placenta to initiate the endoreplication of trophoblasts66. Recently, Cdkn1c was also implicated in the suppression of pluripotency in mouse ESC67. We furthermore see that Ascl1-induced GRN central nodes contain multiple genes involved in cell cycle regulation, e.g., Cdkn1a, Cdkn1b, Cebpa, Cebpb (Supplementary Fig. 8d, g). Thus, we hypothesized that in ΔTcf7l1 cells, Ascl1 is unable to arrest the cell cycle. Indeed, we observe prolonged expression of MKI67 as well as a higher percentage of dividing cells after induction of Ascl1 in the ΔTcf7l1 cells (Fig. 4e, Supplementary Fig. 13c). To test if the expression of Cdkn1c is sufficient to induce iN formation in the absence of Tcf7l1, we coexpressed Cdkn1c together with Ascl1. Indeed, we see a partial rescue of iN formation as well as a decrease in iT generation (Fig. 4f, g). Furthermore, we see that expression of Cdkn1c generates a more mature neuronal and trophoblast phenotype also in WT populations by Day 6 (Fig. 4g). Of note, Cdkn1c is not essential for the formation of Ascl1-induced iNs, suggesting that a group of cell cycle regulators, rather than Cdkn1c alone, is responsible for the cell cycle arrest (Supplementary Fig. 13d).
Taken together, our data show that in Ascl1-induced ESC to iN conversion, cell cycle arrest is a roadblock after exiting the pluripotency state and that Cdkn1c is sufficient to overcome this roadblock. In contrast, this dependency is not observed for Ngn2-dependent iN formation, where the cell cycle is maintained and some ESCs transit to NSCs.
- SEO Powered Content & PR Distribution. Get Amplified Today.
- PlatoData.Network Vertical Generative Ai. Empower Yourself. Access Here.
- PlatoAiStream. Web3 Intelligence. Knowledge Amplified. Access Here.
- PlatoESG. Automotive / EVs, Carbon, CleanTech, Energy, Environment, Solar, Waste Management. Access Here.
- PlatoHealth. Biotech and Clinical Trials Intelligence. Access Here.
- ChartPrime. Elevate your Trading Game with ChartPrime. Access Here.
- BlockOffsets. Modernizing Environmental Offset Ownership. Access Here.
- Source: https://www.nature.com/articles/s41467-023-40803-y

