

Changes to the EU ETS mean free emissions allowances (EUAs) for industry will be gradually phased out as the Carbon Border Adjustment Mechanism’s (CBAM) CO2-related levy will be inversely phased in. It means the carbon costs for industry in the EU will significantly rise. Pablo Ruiz at Rabobank takes a deep dive to assesses the magnitude of these changes and their implications for the main industrial sectors, and the main change drivers for competitiveness in the years ahead. Scenarios are presented for steel, cement, pulp and paper, aluminium, and ammonia, through to 2030. Companies must create their own strategies to decide on how and when to decarbonise. Optimal decisions and timing can turn the rising EUA prices into a competitive advantage. And those that stick to business-as-usual may critically compromise their competitiveness and viability, says Ruiz.
Summary
- This May, reforms to the European Union Emissions Trading System (EU ETS) were finally published in the Official Journal of the European Union, including the establishment of the Carbon Border Adjustment Mechanism (CBAM).
- The EU ETS update sets a clear pathway for gradually phasing out free EU ETS allowances (EUAs), or carbon emission rights, for covered industries at risk of “carbon leakage.”
- From 2034 onward, these industries will have to pay for all of their EUAs.
- Combining business-as-usual emission patterns with EU ETS registry data and carbon price scenarios, we assess the expected impact of the new regulation on median players in a number of affected sectors.
- Our scenario analysis unveils several dynamics and trends with the potential to reshape industrial competitiveness for EU players, within and across industrial sectors.
- With fully priced EUAs, the sectors and companies covered by the EU ETS will experience a significant rise in their carbon-emission-related costs, which will increase between 2.5 times to more than twentyfold.
- We have also identified factors that companies should watch to avoid losing competitiveness while incurring higher CO2 costs.
- In light of these findings, we outline the key elements required for companies to make optimal decarbonisation investment decisions.
- This is the first in a series of three articles in which we analyse the impact that the EU ETS reforms and CBAM may have for different industry players.
The days of cheap carbon for EU Industry are over
This May, the Official Journal of the EU published the agreement reached by European Parliament and the European Council on proposed regulation to reform the European Union Emissions Trading System (EU ETS) and to establish a Carbon Border Adjustment Mechanism (CBAM). Launched in 2005, the EU ETS is a “cap and trade” carbon market under which companies are required to buy or trade rights to emit carbon dioxide. The newer CBAM is a levy on carbon-intensive goods entering the EU, with the goal of levelling the playing field for EU companies subject to carbon pricing, and encouraging emissions reductions in industry outside the EU. (See Rabobank’s previous articles explaining the fundamentals of the EU ETS and the CBAM regulation for more detail.)
The approved text contains provisions that mark a significant step forward in political ambition in terms of increasing economic pressure to reduce industry-related CO2 emissions. It is therefore essential for affected EU industry players to understand the implications of the approved regulation on their businesses and competitiveness.
In a nutshell, the new regulation includes gradually phasing out the free share of EU ETS emission rights – the so-called EU Allowances, or EUAs – currently given to the industry. Figure 1 shows the proposed phaseout. The CBAM’s CO2-related levy will be inversely phased in, as the free EUAs are phased out.

Figure 1: European Parliament’s agreed proposal to phase out the EUAs / SOURCE: European Commission, Rabobank 2023
The economic sectors covered by the EU ETS (namely, power production and industries designated as energy intensive) must cut their joint emissions by 62% by 2030 from 2005 levels. To ensure success, the phasing out of free EUAs will be accompanied by an annual reduction of the total number of EUAs made available to the covered sectors. A yearly 4.3% reduction from 2024 to 2027 and a 4.4% reduction from 2028 to 2030 will be drained from the market supply. In parallel, the CBAM will be gradually applied starting in 2026, and fully phased in by 2034.
While the new regulation includes other relevant measures – such as the establishment of an additional ETS scheme for buildings and road transport emissions, and provisions for the shipping sector – this article focuses on assessing the implications that the end of the era of free CO2 allowances will have for the currently regulated industry. We also outline key considerations for companies deciding how to ride out the perfect storm hitting the European industrial energy supply following the Russian invasion of Ukraine.
You had better get a plan ready before 2025
EU industry will get its final push for decarbonisation under the EU ETS amid challenging circumstances. Leaving behind the days when EU ETS allowances became an unexpected and perverse source of income, and deprived of cheap Russian gas, carbon-intensive industries will now also face an increasingly high emissions bill. If that weren’t enough, the approved new regime includes multiple provisions to disincentivise lagging strategies. For example, Article 10a’s obligation to perform energy audits could result in the further reduction of a given company’s free allocation, if that company does not implement the audit’s recommendations in a timely manner.
The current political context in the EU only fuels the need to prepare for this paradigm shift. The current European Commission term runs until the elections in June 2024, with a new commission likely in place by Q4 2024. We expect one of two possible outcomes:
- A re-election of the current European Commission, headed by Ursula von der Leyen. There are already hints in the press that this is a likely outcome. If this centre-right commission is re-elected, we can expect a second von der Leyen term to be used to fully implement measures laid down during the current one, with a strong focus on the initiated transitions.
- A change in the composition of the commission, with a more green-left-oriented commission likely. Under these circumstances, one could expect the commission’s green ambitions to go even further than the ambitions currently enshrined in the EU Green Deal crafted by the current administration.
Either way, the greener direction of EU policies is likely to remain. What’s more, EU ETS regulation is now more entangled than ever with the redesign of the EU’s industry policy, kickstarted with the Net-Zero Industry Act and the Green Deal Industrial Plan. In the context of a war-shaken, expensive gas supply, both streams of regulation – industry support and decarbonisation – are difficult to understand in isolation. They are also likely to be further tightened, given the global geopolitical context.
Mastering these emerging dynamics is, and will be, essential for any industry player – especially those who want to remain leaders in their business. Prime movers now have the chance to leverage their currently not-so-evident advantages, while the wait-and-see window is rapidly closing for the followers. After 2025, laggards will face both carrot and ever-greater stick policies to start decarbonising.
Each industrial subsector has its own particularities, and successful strategies to navigate the changing regulation must take these also into account. Below, we outline the essential points that any decarbonising investment decision must weigh: from estimating a company’s increasing carbon bill to understanding the main forces reshaping industrial competitiveness ahead.
Carbon-driven competitiveness as free EUAs vanish
As discussed, the supply of EUAs will become progressively more restricted and expensive after 2025. In short:
- On the supply side, the total number of EUAs made available to the market will be reduced each year.
- On the trading side, out of the shrinking supply, fewer EUAs will be given for free. A bigger share of them will be auctioned. The phaseout schedule for free EUAs will potentially turn the growing share of increasingly scarce, non-free EUAs into a bigger financial burden per unit of CO2 emitted.
- A more restricted supply of an increasingly in-demand commodity can only drive the unit cost up. As awareness of the market ahead grows, players are likely to show more active and aggressive trading.
To balance such an increasingly tight market, the EU ETS also includes a market stability reserve (MSR) mechanism. The MSR regulates the number of EUAs in circulation. Having been designed learning from past price hikes, it can be expected to temper extreme market fluctuations.
…Predicting the rising price of EUAs to 2030
Weighing these pressuring and balancing forces in the market, we expect a gradual upward price evolution for the EU ETS going forward, as depicted in the curve in Figure 2 from BloombergNEF.

Figure 2: EUAs’ expected price evolution / SOURCE: BloombergNEF, Rabobank 2023
Only in the event of an industry or economic collapse would these EUA market dynamics move in a direction other than up. If too many players cease their activity, the supply and price dynamics may be disrupted. But, as hinted by the events after the Russian war in Ukraine, policymakers will go to great lengths to prevent this scenario from happening. From this perspective, the described upward dynamics are the optimistic scenario for the future. That is, apart from the other, also unlikely, even brighter side of the coin: if a very relevant share of companies swiftly make their required decarbonisation investments, then the carbon price could temper its expected growth temporarily.
How much is it going to hurt? Recipe for a Corporate Carbon Budget Scenario
Given the clear expectation of a restricted and increasingly expensive supply of EUAs, it is critical for companies to have perspective on what their future carbon budgets might be. Carbon budget projections should, at a minimum, link expected short- and mid-term production with the required expenditure in EUAs. They have to provide the context required for framing key operational decisions for the road ahead. Having foresight on future carbon needs and spending can also help companies evaluate decarbonisation strategies or help them understand the implications of an early or delayed investment decision.
As Figure 3 depicts, it is possible to anticipate a given company’s basic carbon budget in the future using mostly publicly available EU ETS data. The process includes determining:
- A future emissions scenario. Define the company’s expected emissions going forward. Historical data can support the formulation of different scenarios: for example, considering historical pre-Covid emissions patterns, using 2022 as a reference point, or using a weighted average to reflect our changing reality. Naturally, insider knowledge of each sector can help shape a more complex and comprehensive outlook.
- The resulting additional EUA purchasing needs. Building on the future emissions scenario, and knowing the proposed trajectory of freely allocated EUAs ahead, it is possible to determine a company’s future EUA buying needs. The most basic approach is to assume the previous year’s assigned EUAs will remain the same but update the share of freely given ones. This business-as-usual scenario suggests a company is making no relevant investments to reduce emissions, and that production levels will remain the same.
- A solid EUA price scenario. With a clear price projection for EUAs, companies can then translate their future buying needs into monetary terms. This can help decision-makers identify the points at which different strategies become more or less attractive: the higher CO2 prices, for example, the more profitable decarbonising investments may become.
- The expected carbon bill. Through the price scenarios, the volume of required additional EUAs can be translated to a resulting yearly bill. If EUA purchasing needs are considered within the greater context of a company’s EBITDA or annual turnover, decision-makers can better weigh the operational implications of a future carbon bill. A percentage of turnover can often speak more to stakeholders than an isolated monetary figure.
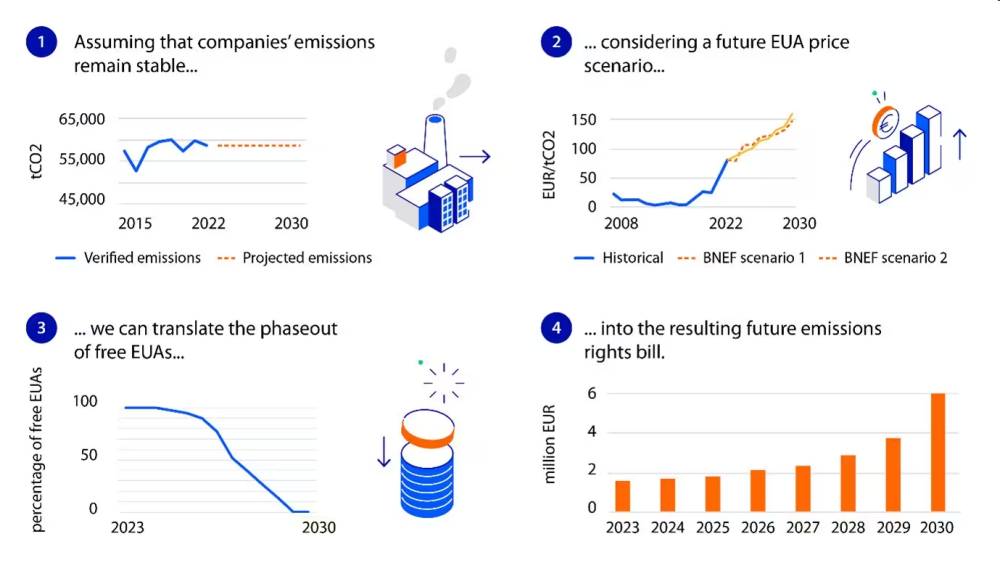
Figure 3: A future carbon budget assessment / SOURCE: European Commission, BloombergNEF, Rabobank 2023
Considering the layout of information that this exercise requires, it becomes clear that the longer a company waits to invest in decarbonising technologies, the more expensive its EUA bill will become. Unspent free allowances can be used to finance decarbonising investments. The earlier the investment decision is made, the bigger the EU ETS-derived support it may leverage.
Of course, an increasing carbon bill is only one part of the story. Any serious planning for the bumpy road ahead will also have to consider all the “regular” strategic concerns and the ever-evolving context of things like fuel prices, the positioning of the competitors, substitutive products, and trade dynamics.
Sectorial Carbon Budgets: everyone gets a growing bill
To illustrate the conditions in which industry players need to learn to navigate,
Figure 4 presents examples of carbon budget projections from different industrial sectors. Using the method outlined in Figure 3, we built projections for five imagined companies representing the “median” of their sector. They show an ideal company with a median emissions intensity – with half of the sector emitting more CO2 and the other half emitting less.
For the sake of comparison, we have opted to assume a business-as-usual scenario, in which all players continue to emit the same quantity of CO2 as their corresponding 2015-2022 average. This scenario also assumes that the companies won’t make any energy transition investments during the period assessed. A company conducting an actual exercise in this type of strategic thinking would naturally benefit from using more detailed demand and expected activity forecasts, and incorporating more sophisticated investing perspectives.
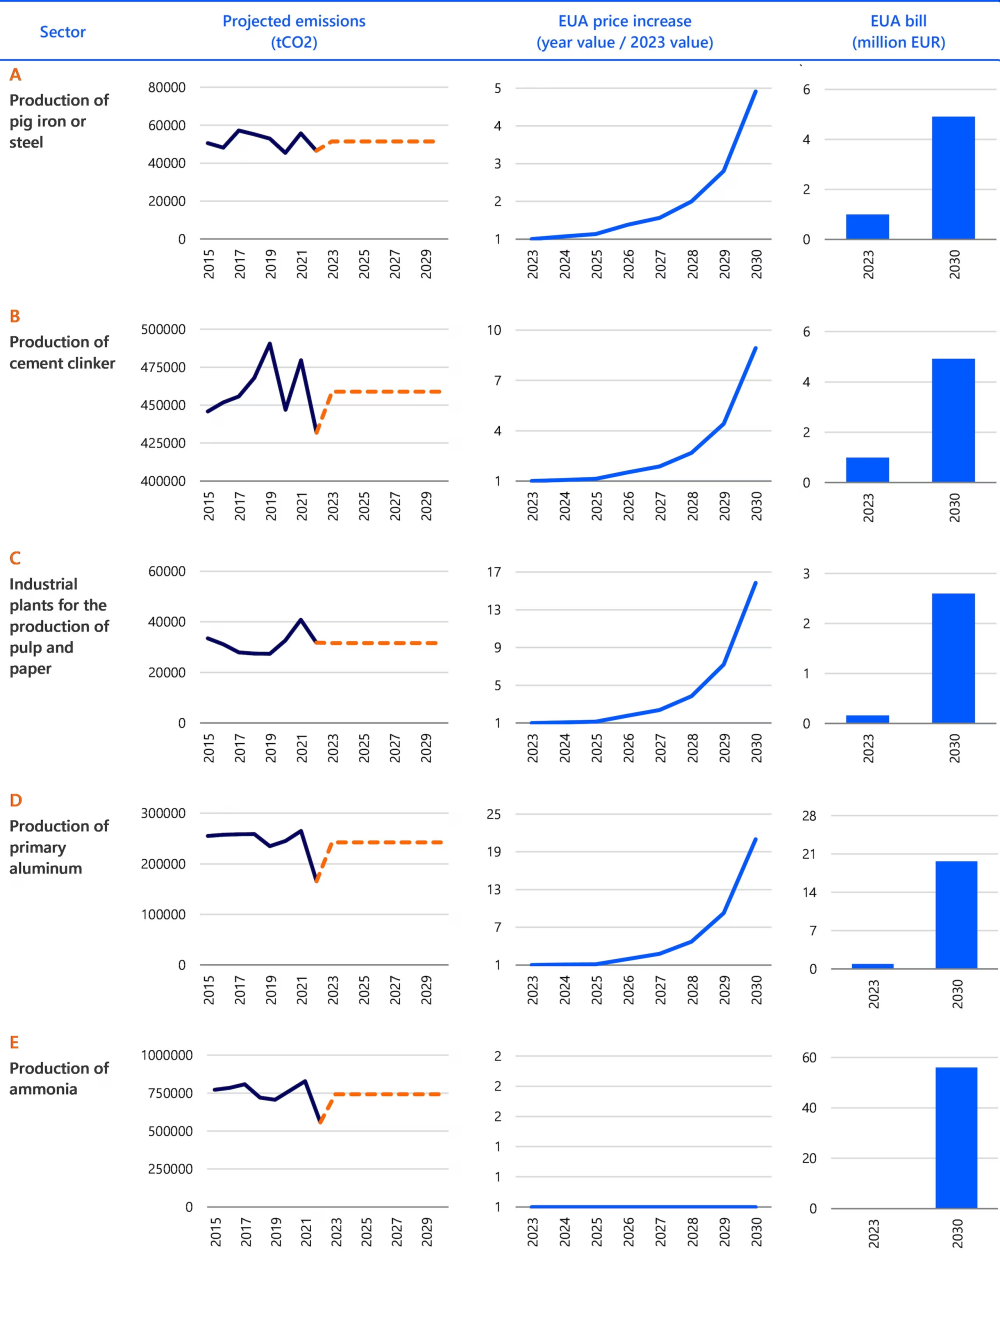
Figure 4: Increased EUA bills for median sectorial emissions, 2023-2030 / SOURCE: European Commission’s EU ETS Registry, BloombergNEF, Rabobank 2023
The key takeaway from these examples is clear: under a business-as-usual scenario, no matter the sector, without any strategic reaction, the cost of CO2 will be multiplied several times along the way to 2030. A “no-action” strategy will, thus, have an increasingly negative impact on companies’ operational results due to their growing carbon bills. The 2023-2030 cost increase per company ranges from 2.5 times for a median company in the pulp and paper sector to a twentyfold increase for the median aluminium production facility. The median production facility for ammonia registered a surplus of EUAs in 2023 so its expected cost increase can only be measured in absolute terms: from zero in 2023 to EUR 56m by 2030.
Carbon Archaeology: looking back to understand the way forward
The EUA cost projections provide valuable insights into what each sector can expect in terms of increase CO2 costs. Under a business-as-usual scenario, the way a sector is projected to evolve is influenced by:
- Sectorial resilience through stressed fuel supply and demand elasticity. If we look backward at the emission curves of some sectors, the historical record suggests a high level of resilience through extreme conditions, for example, during the 2020-2021 Covid crisis and the subsequent Russia-Ukraine war’s impact on the gas supply. Discounting standing long term contracts and the policy support received, such resilience – or lack thereof – is indicative of a given sector’s likely crisis reaction patterns. Very resilient sectors are better equipped to navigate faster toward decarbonisation. Nevertheless, the described past circumstances involve strong non-linear factors, so extrapolating into the future should be done with caution. What’s more, identifying representative sectorial behaviours can only be achieved through the analysis of a sufficient number of players. Also, had the sectors not been so resilient to the aforementioned crises, the average emission pattern projections may have resulted in much lower EUA bills.
- Sectorial carbon exposure. Looking forward to 2030, the end of free EUAs impacts each sector with different degrees of severity.
- Figure 4 provides an indicative overview, as well as an initial idea about the scale of the financial impact that companies might face. Ammonia producers, for example, are set to face a very big bill increase, moving from excess EUA rights in 2023 to a EUR 56m bill by 2030 for the median production facility. In the opposite corner, the lowest EUA bill increase through 2030 is (still) more than double today’s costs for the median pulp and paper production facility. Companies’ range of option for decarbonising will differ depending on whether their emissions are the result of a carbon-intense cheap fuel choice, or the unavoidable consequence of other more complex process-related requirements (e.g. material, chemical, or thermal needs). Not surprisingly, the higher the total emissions, the bigger the cost increase ahead. Illustrating the obvious, the most emitting industries will face the greatest urgency to deploy an adaptation strategy.
Finding your way: Corporate Carbon GPS
Within a given industrial sector, companies will experience the future’s pricy CO2 environment in different ways. Decarbonisation outcomes will depend on companies properly tuning their decision-making for their unique carbon situation.
Carbon positioning
Company leaders need to be asking: Where am I? Where does my company stand, carbon wise? To what extent will a growing EUA bill affect my business’s financial returns? Answers to these questions require looking at both market and production variables.
On the market side, companies first need to determine how demand for their products might react to carbon-driven price increases: Will demand follow, contract, or move? Are customers willing and/or able (or forced) to absorb a higher EUA bill? Are they able or willing to go the opposite route and even pay more for a less-carbon-intensive product, for example, due to their corporate decarbonisation strategies or regulations forcing them to do so? Understanding customers’ demand elasticity, and how it may change in the coming years, will be one of the key elements to determining a corporate EU ETS/decarbonisation strategy. The complete picture should incorporate potential spillover effects as customers and producers move to sourcing from less carbon-exposed products or sectors. Companies should also look for opportunities to replace other sectors’ products as well.
From a production and process perspective, a company’s carbon competitiveness will be the result of its interlinked carbon and energy intensities.
- Carbon intensity will drive the evolution of industry, not unlike how labour intensity shaped competitiveness during the industrialisation era. Within a decarbonising industry, less-carbon-intensive products and production processes will increasingly result in more competitive products. Economic flows may be diverted toward less-carbon-intense substitutes. Companies need to begin scanning for product diversifications worth considering. Industry players should also consider the influence of the EU ETS when evaluating prospects for their own production and demand.
There are also options for companies to reduce their emissions by looking further along their value chain. Cooperative efforts to decarbonise are already happening. Some players with the financial muscle to do so are already supporting the decarbonisation of up- and downstream processes in their value chains.
Also, it may be better to contextualise additional decarbonisation costs in end products. For example, as suggested by research from Chalmers University of Technology, passing the additional costs of carbon-free steel on to consumers would have a marginal impact on the total final cost of a car. Expressed this way, decarbonising one’s own production may offer a significant competitive advantage.
- Energy intensity is going to link carbon intensity and economic profitability more strongly than ever before. While increasing carbon intensity at the beginning of the industrial revolution meant higher productivity, the trend has already reversed for EU players. In the absence of a cheap Russian gas supply, certain highly gas-dependant industries are facing fierce external competition from extra-EU manufacturers. Those located in Asia or the US may now have similar or worse energy intensity, but a much cheaper gas supply, making it difficult for EU producers to compete at an industry level. Until decarbonisation happens, carbon and energy remain two sides of the same economic coin.
Carbon Navigation, the new decision-making
Ultimately, all of EU industry – except for the hardest-to-abate sectors, which can only consider carbon capture and storage – will have to become carbon free. So, for players that choose to remain in their activity, investing in decarbonisation is matter of a) carbon financials b) technology choice and, c) timing.
- Financial impact. As carbon costs grow, so will those costs’ footprint on the financial performance of liable firms. Decision-makers will have to incorporate carbon expenses in their forward-looking analyses, and cost-benefit assessments should factor in the potential savings accompanying an early carbon phaseout. The sale of remaining non-used EUAs could harvest significant benefits, if sold wisely, while their value could also drop fast if many industry players choose to make decarbonisation investments at once. Companies need to develop a clear picture of how their carbon competitiveness is expected to evolve – be it improving, remaining, or deteriorating – and benchmark their projected carbon intensity against other players in their sector.
- Technology. Each industry process requires very different inputs: energetic, thermal, chemical, or pollution-controlling, to name a few. These determine the feasibility of the available decarbonisation investments. The different technology choices for a given sector are often represented in the form of marginal abatement cost curves. Understanding abatement cost curves for each sector is only the starting point for designing a decarbonisation strategy. While the options have been extensively discussed for the main carbon-intensive sectors (steel, cement, pulp and paper, aluminium, and ammonia), detailed analyses incorporating all the processes and local conditions for each facility are needed.
- Timing. Once the technology choice is clear for an industry player, timing of the investment decision will have to be set. To do so, decision-makers should consider the operational context (for example, the depreciation state of the existing assets, demand behaviour, or trade patterns) and strategic considerations (such as environmental positioning, investment support measures and schemes, and the EU ETS dynamics outlined in this article). As explained before, with the CO2 price set to increase until 2030, optimal timing can turn the EUA burden into a competitive advantage.
Since 2005, the EU ETS regulation has been deployed gradually, in differentiated phases. There is already plenty of publicly available information to build an operational roadmap through the decarbonisation on the horizon. Companies restricting their planning to a business-as-usual way of thinking may critically compromise their viability.
Carbon Context, Carbon Competitiveness… Beginning to understand the Transition
In this article we have analysed the main changes that the new EU ETS regulation has introduced for European industry. While one can expect that major corporations are very aware of the impact of the coming changes, it is essential for any player to understand the dynamics that are head of us.
We have illustrated how the size of the changes ahead for a given company or sector can be quantified, to a great extent, using publicly available data. Without decarbonising investments, the carbon bill will grow several times between now and 2030 – from two- to threefold up to twentyfold – for the median company in a given sector, depending on their carbon intensity. These numbers can go even higher for carbon-intense plants in the most critical sectors.
Such increases will reshape the way industry looks in the next ten years. We have explained how sectorial resilience and carbon exposure define the starting points for the road ahead. Setting the optimal transition speed requires a good understanding of other players (or even other sectors). Ultimately, the match will be decided through the interplay of one’s own carbon and energy intensity, and those of the connected players and sectors.
The key decision for companies to make is when and how to invest in decarbonizing. As with every investment, decision-makers will have to weigh timing, finances, and technology advantages. But within the EU ETS, strategic timing will also determine the extent to which a company benefits from laggards’ need to keep emitting.
And of course, the changing forces depicted in this article are just the tip of the melting iceberg. In the next article in this series we will dive into trade: how and if growing carbon costs will affect the trading competitiveness of companies covered under the Carbon Border Adjustment Mechanism. Finally, in a last chapter of this series, we will discuss how EU industry players can ultimately integrate all these carbon-related forces into “traditional strategic thinking.”
***
Pablo Ruiz is a Senior Energy Transition Specialist at Rabobank
Thia article is published with permission
- SEO Powered Content & PR Distribution. Get Amplified Today.
- PlatoData.Network Vertical Generative Ai. Empower Yourself. Access Here.
- PlatoAiStream. Web3 Intelligence. Knowledge Amplified. Access Here.
- PlatoESG. Carbon, CleanTech, Energy, Environment, Solar, Waste Management. Access Here.
- PlatoHealth. Biotech and Clinical Trials Intelligence. Access Here.
- Source: https://energypost.eu/industrys-eu-ets-reforms-and-cbam-how-firms-can-turn-the-rising-cost-of-carbon-into-competitive-advantage/

