The author’s views are entirely their own (excluding the unlikely event of hypnosis) and may not always reflect the views of Moz.
Google Analytics 4 (GA4) is officially here. If you’re not familiar yet, GA4 is the next generation of analytics.
While it offers a bunch of new features and benefits, it can be a little daunting to learn how to use it effectively. There are numerous new reports, and finding the data you care about can take a lot of time.
In this post, I will show you a great way by which you can leverage the power of GA4 to enhance your reporting by using custom reports.
What is the need for Custom Reports?
Don’t get me wrong, the standard reports are great. They provide a lot of data. And that’s the problem. They provide a lot of data that you might not need.
-
The default reports don’t provide you with important data: The default reports in GA4 provide a good overview of everything about your website. For example, it will tell you how many new users you’ve acquired. Or how many sessions your website had in a given timeframe. However, they may not give you the specific information you’re looking for in your SEO campaigns. To find something like how many users are coming from specific countries that are coming from organic mediums, you would have to go through a lot of reports. But if you make custom reports, on the other hand, this work would be much easier.
-
Finding key metrics and organizing data can be challenging: Every business has different goals. Some might focus more on getting new users, and others might focus on a specific channel, while some may focus more on increasing the views on particular pages. Finding and keeping track of different metrics for different businesses is difficult in the default reports. Suppose you’re a SEO consultant handling 25 different GA4 accounts, and you need to prepare reports that will highlight the key metrics that you’re tracking. Gathering the data from default reports will take you dozens of hours and a lot of brain power.
-
Presenting this data to stakeholders and ensuring your SEO suggestions are implemented can be tricky: The default reports are designed to show the general overview of data. This means that it will not provide you with the specific data that your stakeholders are interested in. The next thing is that the default reports have a ton of data in them. This makes the reports hard to understand. Stakeholders must understand the data because if they don’t feel confident about the data, it can be really hard to get your SEO recommendations implemented.
A great way to get the most out of your analytics data is to make custom detailed reports.
What are Custom Reports?
Custom detailed reports are like default reports, except you make them using a template or entirely from scratch. Here, you can add any dimension or metric, filters, and more.
Making custom detailed reports is a great way to get deeper insights into your analytics data, and they can help you make informed decisions, which you can learn more about in my new GA4 course.
How can Custom Reports help you get the data you care about?
Custom detailed reports can help you be more productive by organizing all your important metrics in one place. This means that if you handle more than one GA4 account, it will help you analyze and understand data better in less time.
-
Helps you focus on important metrics: GA4 allows you to create custom reports that help you focus on metrics you care about. You can add your preferred dimensions, metrics, filters, and charts. These will help you to customize the report according to your needs. So, for example, if your business is focusing on getting organic traffic from a specific country, then you can make a report that will show you this data. This will save you time, and you can focus on the metrics you care about.
-
Get an accurate picture of your campaigns: By making custom reports, you can get granular data for a single or a group of pages. By tracking specific metrics and dimensions, you can identify trends and data that you might not get otherwise. This will help you understand what’s working and what’s not. This would mean that you can focus on making your campaigns better.
-
Takes less time to set up and access compared to standard reports: If you were to get the specific data from the standard report, it would take you a lot of time. Making custom reports can take a few minutes to a few hours, depending on how many reports you want to make. And once your reports are made, you can publish them, and then you can access them from the sidebar. This will allow you to access important metrics quickly.
-
Make better decisions with the data: When you have access to custom reports, you can understand what aspect of your campaign is performing best, and what’s not. What pages get more engagement, and which pages get the most views? Having access to this data means that you are making data-based decisions and not shooting in the dark. This will help your campaigns to perform well, and you can fix the issues you’re encountering.
-
Feel confident in getting your recommendations implemented: When you make custom reports, you only include a few metrics. This will make your stakeholders understand the data better. And as they can understand what needs to improve, you can feel confident that your SEO recommendations are getting implemented.
Steps to create custom reports
Here’s how you can create a custom report:
-
From the left menu, click Reports
-
Navigate to Library, and click it (Note that you should be an editor or administrator to access the library option)
-
In the reports section, click on “Create new Report”
-
Click “Create Detail Report”
-
Here, you have two options. You can either create a report entirely from scratch or use any template.
-
Add your desired metrics, dimensions, filters, and click save
For example, your SEO campaign is focusing on generating organic traffic. And your goal is to find out what countries are generating the most amount of organic traffic.
You can do this by creating a report from the demographics template. When you click the demographics detail template, you will see a lot of data that is optional for you.
You can remove extra dimensions and metrics that are not important.
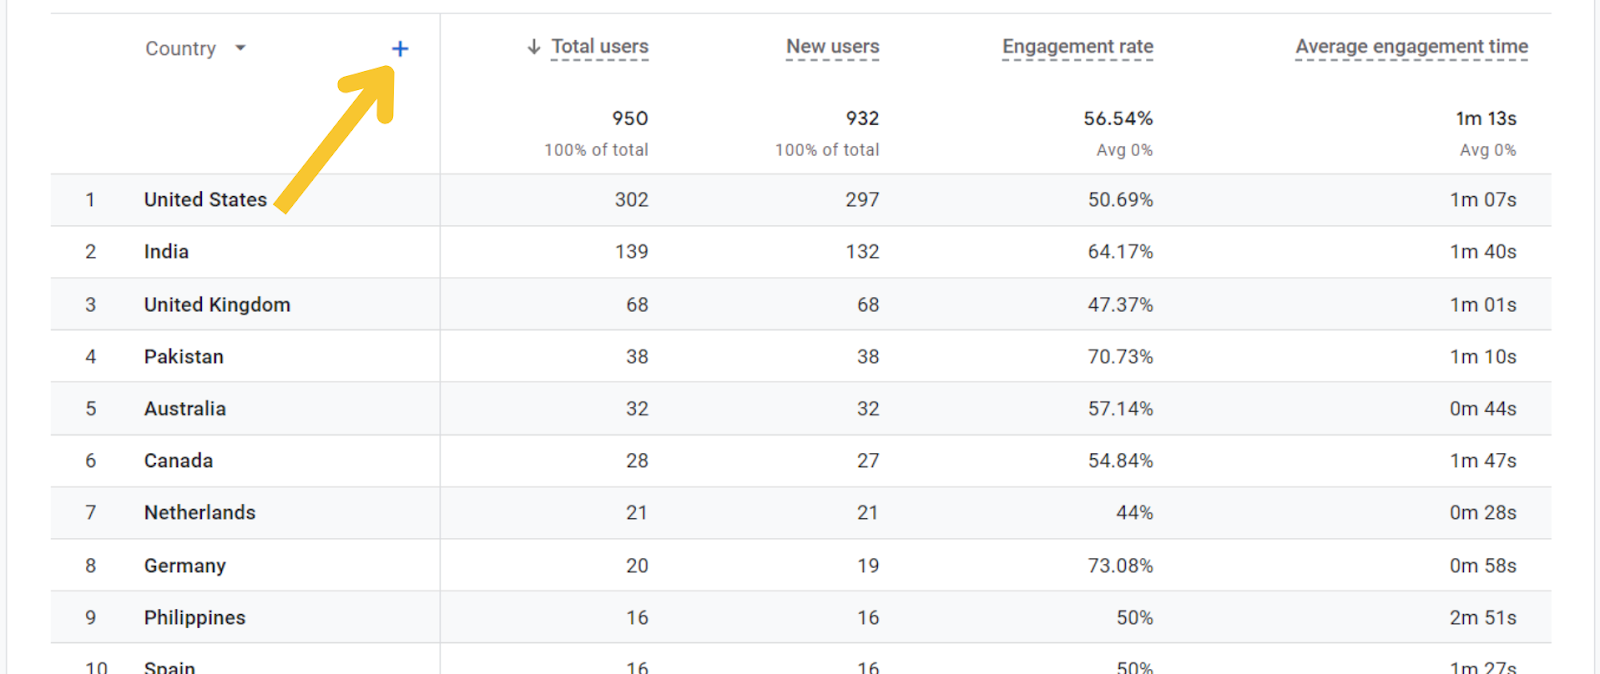
For this particular example, we want to keep the dimension as “country” and the metric as “total users.” This will give us all sorts of data like organic and referral. So, we will make a filter that specifies the session medium as organic.
This will only show us the total users coming from different countries from the organic medium.
But what if you want to know what those organic websites are? What if you want to know whether your traffic is coming from Google, Bing, or any other organic medium?
The second dimension can help you here. Click the little “+” icon on the right of the first dimension, “Country.”
Select traffic source and then select session source.
This will give you specific data about the total users coming from:
-
Different countries
-
By a particular organic medium
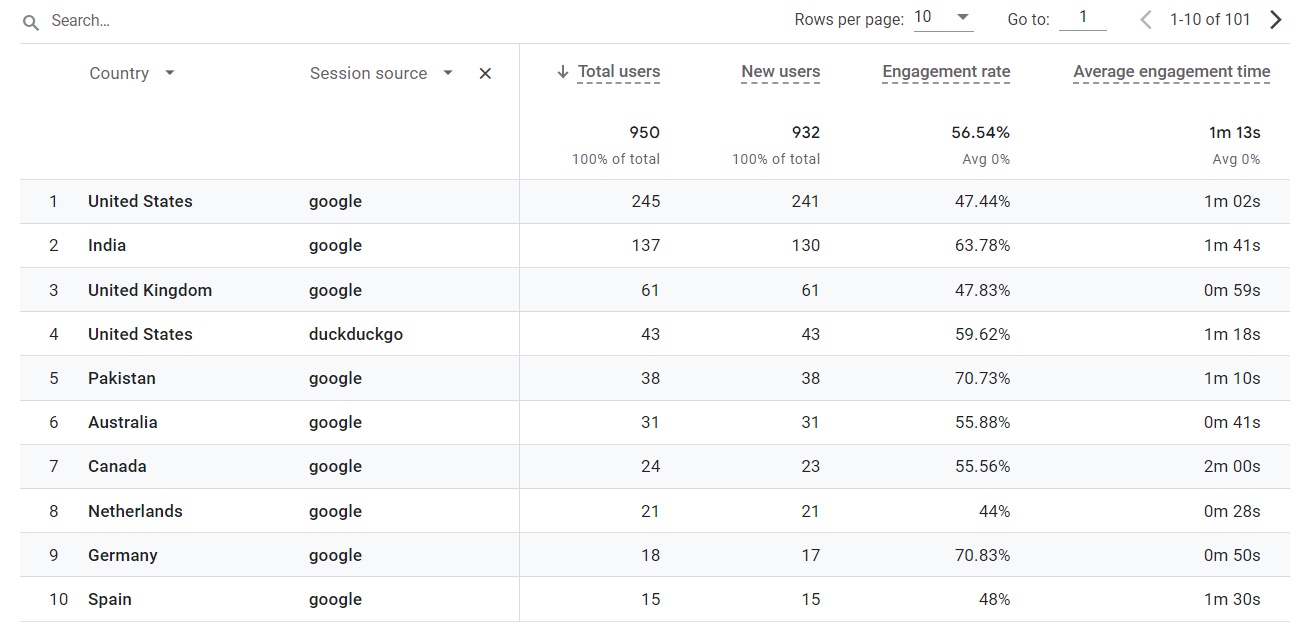
You can add additional metrics to understand the data better.
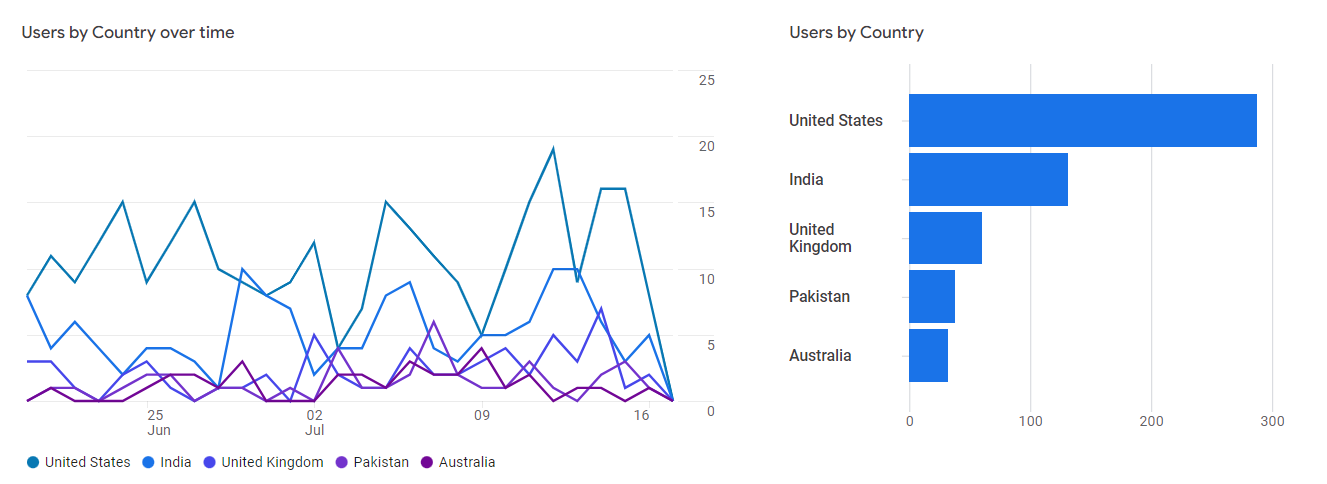
As you can see, there will be two different charts, one is a line chart, and the other one is a bar chart. Whichever suits your needs, you can choose it.
You can also create summary cards according to the report so that you can see them in the overview reports.
This particular report will help you understand a specific metric. It will ensure that you and your stakeholders can make informed decisions.
When you have published a report, you can do things like:
-
Change the data range to find data over a period of time
-
Do MoM or YoY comparisons
-
Build a comparison to compare the data against other dimensions
-
Add filters to include or exclude a dimension
-
Share your reports with your teammates or stakeholders.
How to add metrics and dimensions to Custom Reports?
If you’re working with a template, then you will have predefined metrics and dimensions present in the report.
In every custom report, you can access the dimensions and metrics from here:
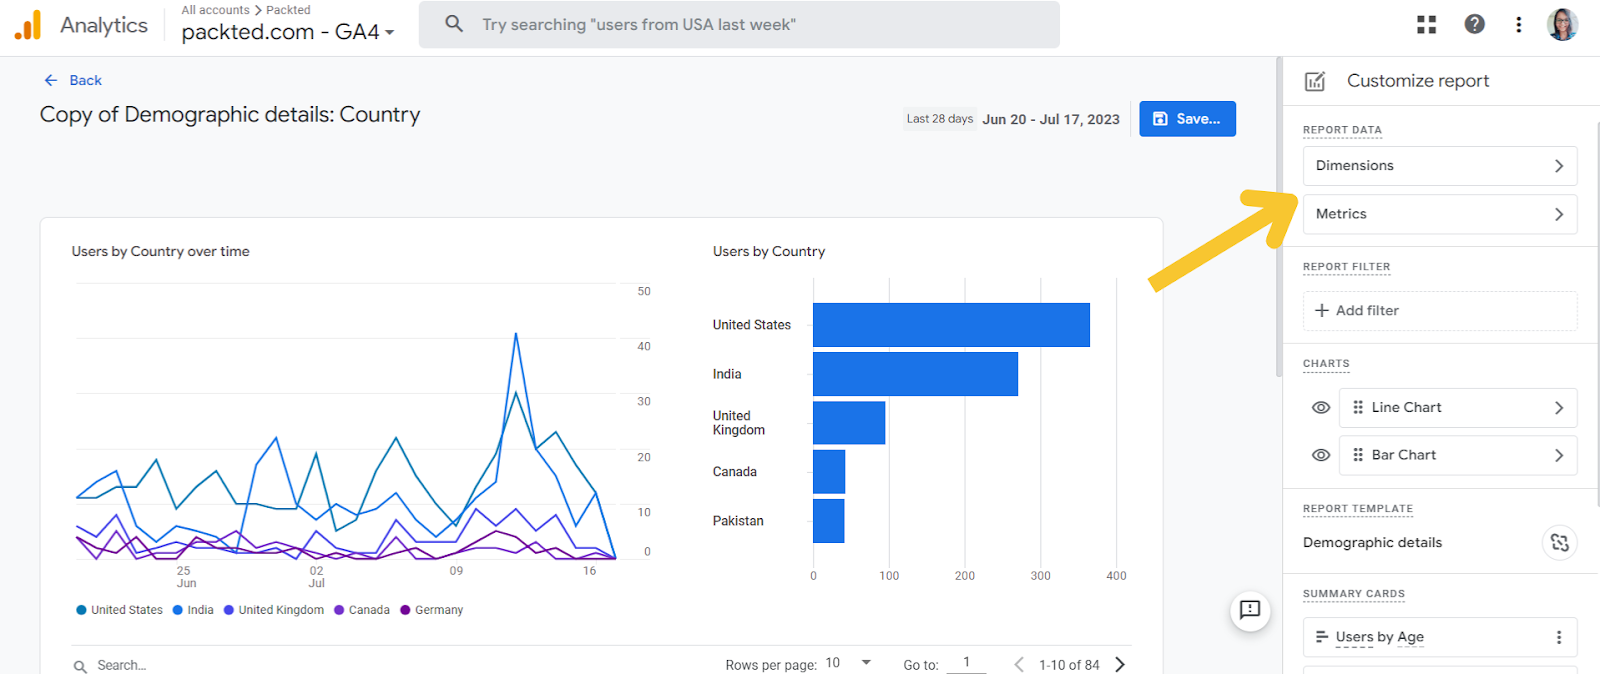
For example, the above image shows the demographics detail template. To check the dimensions, we will click on ’Dimensions’ and we will then be able to see all the default dimensions, which will look like this:
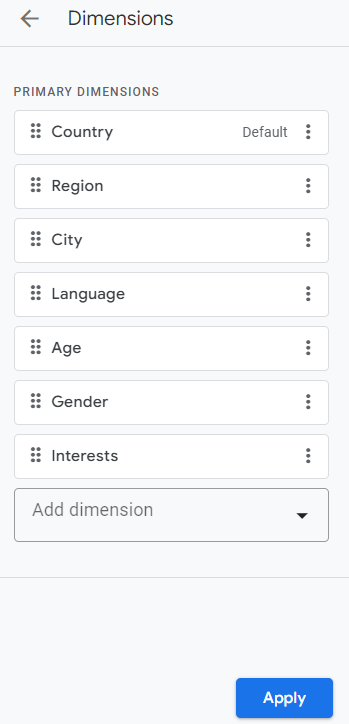
You have the freedom to choose any dimension and metric you want. When you’re making custom reports, you won’t require all dimensions and metrics, it depends on your goals and what you actually want to see in a report. You can remove and add any dimension from the ‘Add dimension’ dropdown.
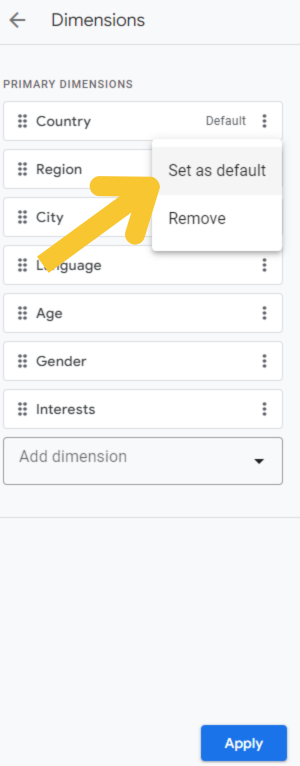
If you want to make any dimension a default, then you can click the three dots to the right and choose “Set as default”. This will make it the default dimension in the report.
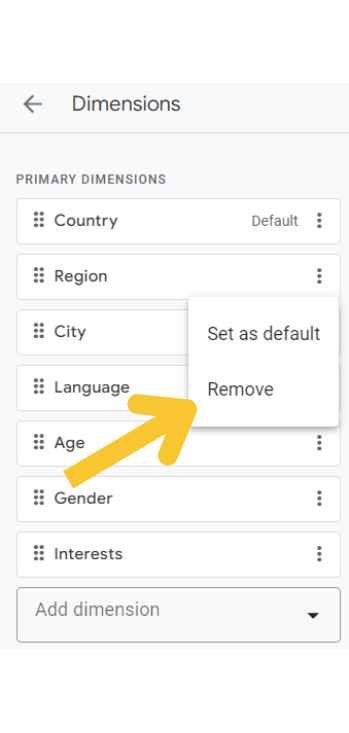
In the above example, we only want the ‘Country’ as our dimension. So you can remove all other dimensions by clicking the three dots and selecting “Remove”.
Similarly, when you click on metrics, you will get all the default metrics like:
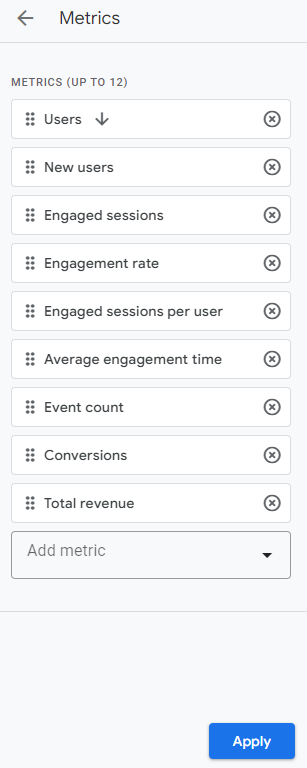
As you saw above, we want to choose ‘total users’ as the main metric, but we don’t see it in the default metrics list. To find the total users, you can click on “Add metric,” and from there, you can select total users and add it to the list.
You’ll see that there’s a small arrow beside the ‘Users’ metric. This means that this is the primary metric, and, by default, it will sort the data from highest to lowest. If you want to make another metric as the default, then you can just click on that metric, and it will become the default one. And if you click on it again, it will sort from lowest to highest.
You don’t want to show every single metric in your custom report, so you can remove the ones you don’t want by clicking the cross on the right of the metric.
Standard reports in GA4 are only made to show general data. Finding and accessing important metrics can take some time, especially when you’re handling a lot of projects. Also, getting your SEO recommendations implemented is not always guaranteed with standard reports, as it can be hard for executives and stakeholders to understand the data correctly.
That’s where custom reports come in. You can add all of your important dimensions, metrics, filters, and more to get the data you care about. This will aid you in making informed decisions, and stakeholders will be also able to understand the data better, as it will be organized and presented in a better way.
- SEO Powered Content & PR Distribution. Get Amplified Today.
- PlatoData.Network Vertical Generative Ai. Empower Yourself. Access Here.
- PlatoAiStream. Web3 Intelligence. Knowledge Amplified. Access Here.
- PlatoESG. Automotive / EVs, Carbon, CleanTech, Energy, Environment, Solar, Waste Management. Access Here.
- PlatoHealth. Biotech and Clinical Trials Intelligence. Access Here.
- ChartPrime. Elevate your Trading Game with ChartPrime. Access Here.
- BlockOffsets. Modernizing Environmental Offset Ownership. Access Here.
- Source: https://moz.com/blog/leverage-ga4-custom-reports

