Your gateway to successful crypto investing guided by data and research
Key Takeaways
- Global Markets at a Glance: October in the digital asset market was marked by significant anticipation for regulatory developments, particularly the potential approval of Spot Bitcoin ETFs, driving heightened institutional interest. Bitcoin led the bullish trend with a notable 28% month-over-month appreciation and a year-to-date increase of over 108%, reflected in its dominance peak at 53%, the highest since April 2021. Other cryptocurrencies, like Solana, also showed impressive gains, indicating a broader market recovery.
- Market Momentum: The potential approval of a Spot Bitcoin ETF can entail a significant influx of new demand from professional investors. Our analysis suggests a substantial impact on market dynamics due to this new demand, set against a backdrop of Bitcoin’s prevalent long-term holding pattern and resulting scarcity of tradeable supply. We explore this through parallels with gold ETFs and in-depth on-chain analysis, focusing on the anticipated capital influx and Bitcoin’s real supply dynamics.
- On-Chain Basics: Based on holding patterns, Glassnode classifies Bitcoin investors into Long-Term Holders (LTHs) and Short-Term Holders (STHs). LTHs hold to their investment for more than 155 days and often tend to accumulate during bearish trends and sell into market strength. Conversely, STHs, holding for less than 155 days, are more responsive to short-term market shifts. This classification aids in market analysis, trading strategies, and risk management, offering insights into different investor groups and stages of the market cycle.
Global Markets at a Glance
A Month in Review: October On-Chain and in Derivatives Market
October marked a pivotal moment for the digital asset market, characterised by heightened anticipation of regulatory developments, particularly surrounding Spot Bitcoin ETF approvals and increased institutional involvement, as registered by a notable in spike CME Bitcoin futures volume.
Consequently, the bullish trend was led by Bitcoin (BTC), which appreciated by over 28% month-over-month, achieving a year-to-date performance of over 108%. This was also reflected in the continuation of the uptrend on Bitcoin’s dominance. The metric, which represents the percentage of BTC’s market cap to the digital asset total market cap, peaked in October at 53% – its highest level since April 2021.

While Ethereum trailed behind by a comparatively modest 8.72%, some of the better-established smaller-cap assets have made good strides, eclipsing the performance of either of the two market leaders. The impressive performance of cryptocurrencies like Solana, which soared by an impressive 79.05%, indicates that recovery has now started to expand to other market sectors.
Overall, the positive tide affected a majority of digital assets as reflected by indices aiming to capture the broad market momentum, such as the Bloomberg Galaxy Crypto Index or CoinDesk Market Index which both grew by over 20%.
As mentioned, the market’s upward trajectory was largely driven by the anticipation of Spot BTC ETF approvals, with market movements significantly influenced by updates on filings from major financial entities like Invesco and BlackRock. According to one Bloomberg’s analysis, the chance of Spot BTC ETF approval by January 10th – which is the SEC’s final statury deadline for a decision on some of the applications – is 90%.
One key factor elevating the chances of Spot BTC ETF approval is the SEC’s recent inaction following a court order. In October, the SEC did not appeal a critical court ruling that mandated a review of Grayscale’s Bitcoin ETF application. This inaction suggests a possible shift in the SEC’s stance, as it now needs to reassess the application without relying on its previous rationale. This development has significantly influenced market optimism about the likelihood of Spot BTC ETF approvals.
This optimism, especially coming from institutional market players, could be noted in the growth in open interest for CME Bitcoin. The trend, which continued well into November, saw the Bitcoin Futures Open Interest on the Exchange reaching an ATH of 27.8% in relative dominance. At these levels, CME is now the preferred venue for trading BTC futures, having overtaken Binance for the first time in two years. This indicates a significant increase in institutional investors’ participation in the derivatives space, signalling their growing acceptance and integration of digital assets into mainstream financial portfolios.

Similarly, institutional engagement is evident in the options market. In October, open interest in Bitcoin call options surged by $4.3 billion, growing by 80% to exceed $9.7 billion. Such a significant scale of activity in the options market, now comparable to that of futures, signals a maturation of the market. It reflects a more sophisticated investment strategy typically associated with professional and institutional traders, who are increasingly leveraging these instruments for long exposure to Bitcoin.

From the on-chain analysis perspective, the growing interest in Bitcoin from institutional entities was juxtaposed with an increase of HODLing behaviour from long-term investors with strong conviction in the asset.
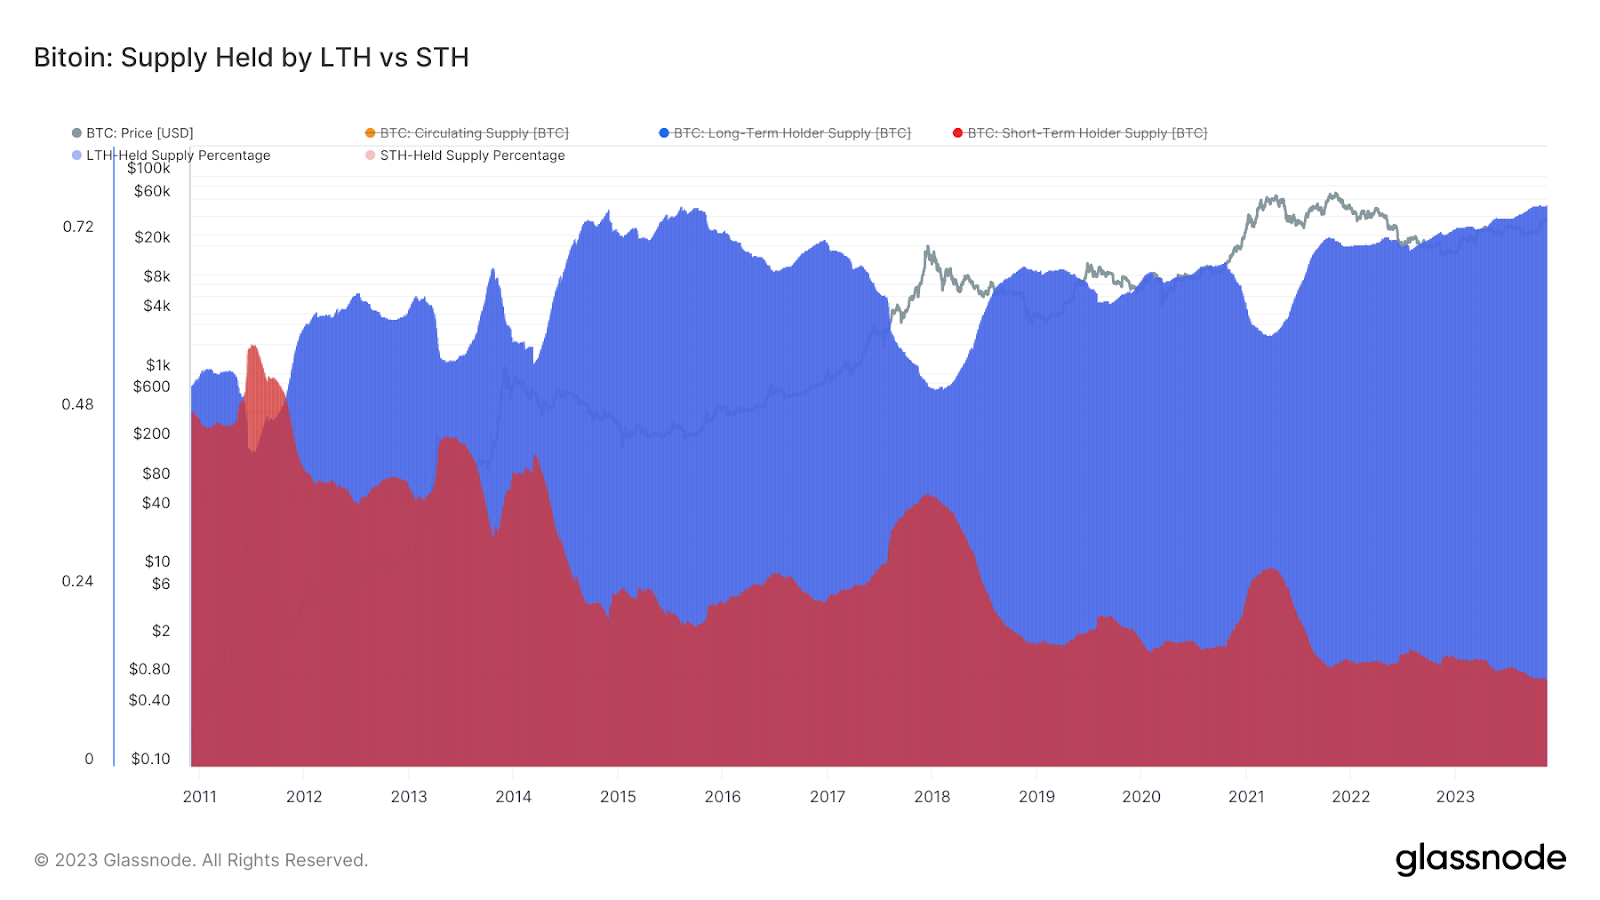
Consequently, October witnessed a remarkable tightening of Bitcoin’s available trading supply, with the share of BTC in the hands of long-term holders reaching new all-time highs at over 76%. This means that more than two-thirds of the circulating supply have not transacted in at least five months.
Similarly, we noted the increasing volume of Illiquid Supply, moving inversely to Exchange Balances, meaning that a large number of market participants transfer their assets from liquid exchanges to illiquid HODLer wallets – addresses with little history of spending. In practical terms, this means that while trading volumes are picking up, market liquidity remains shallow.

This trend is interesting to note because it suggests a strong conviction in the current price trend from the long-term holders – who are typically the more seasoned investors. While these market participants are already sitting on substantial unrealised profits, they are reluctant to cash in on them – potentially signalling a belief in uptrend continuation.
Shifting Correlations, and the (Re)Emergence of ‘Flight-to-Quality’ Narratives
The long-term holders’ confidence in the trend doesn’t seem unfounded, considering the diminishing tradable supply of Bitcoin amid increasing interest from new market participants, particularly those from a more traditional financial background. This emerging demand seems to be validated by the perspectives of influential figures like Stanley Druckenmiller, Paul Tudor Jones, and BlackRock’s Larry Fink, who recognize Bitcoin’s potential as a ‘flight to quality’ asset.
This narrative, in turn, is increasingly validated by data. In the wake of heightened geopolitical tensions and macroeconomic uncertainties, Bitcoin’s appeal as digital gold can be seen by its changing correlations to traditional assets. The 30-day correlation between Bitcoin and gold, as of October, stood at an average of 0.65, reflecting similar price movement patterns. While the 30-day correlation diminished in November, the 90-day trend remains intact:
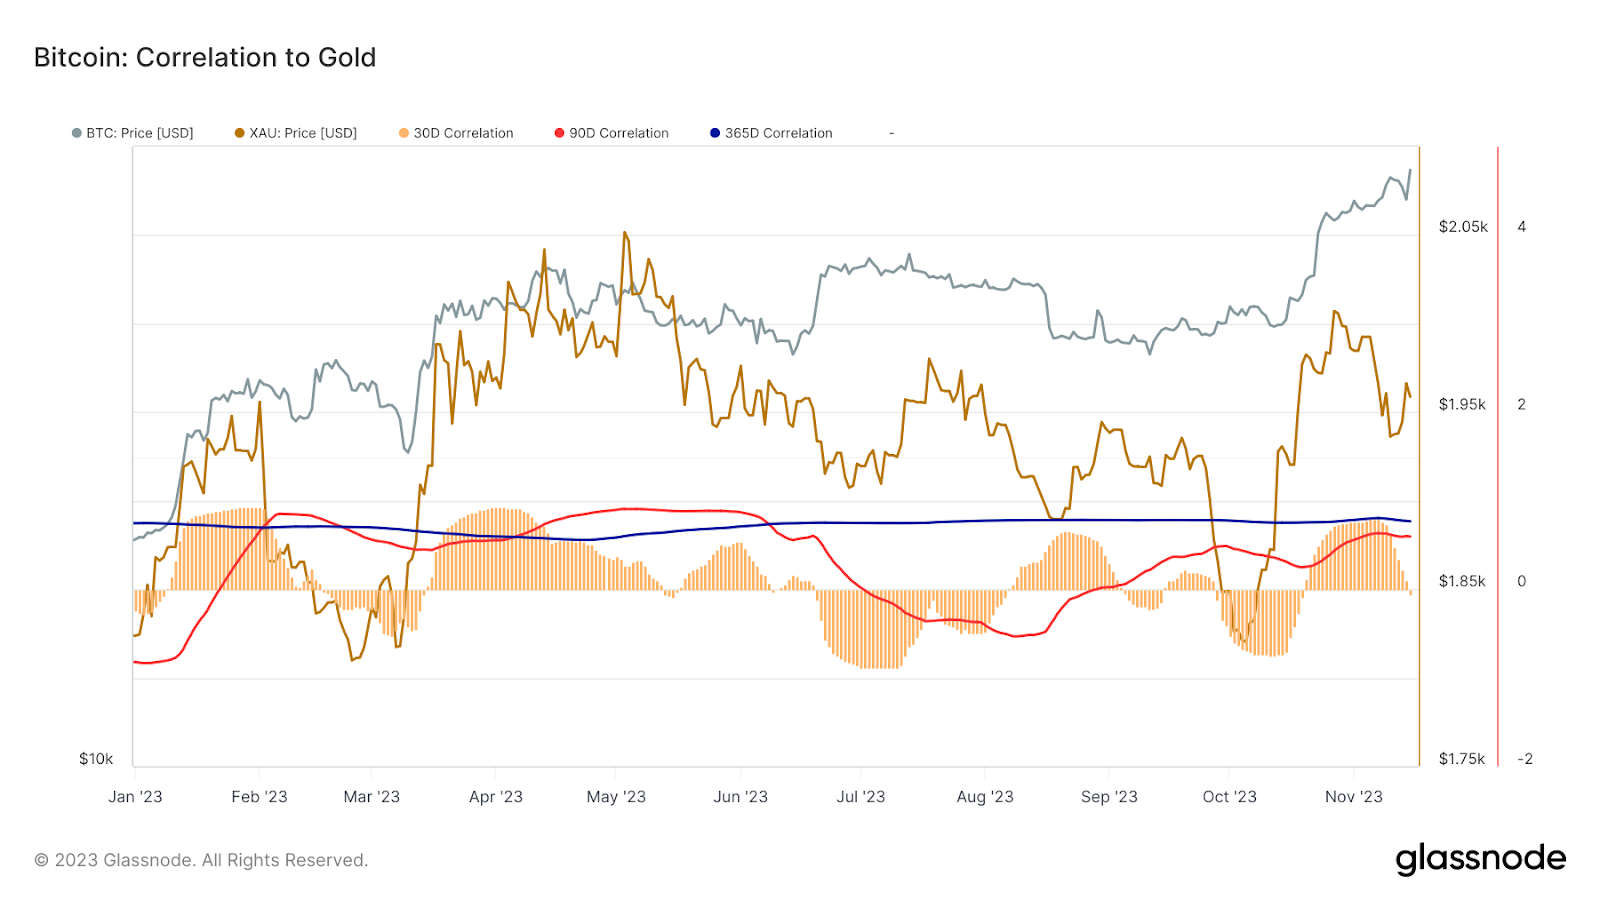
This correlation starkly contrasts with Bitcoin’s negative correlation to traditional equity indices like the S&P 500 and the Nasdaq Composite. The divergence underscores Bitcoin’s growing appeal as a diversifier and a hedge against market volatility in traditional financial markets.
As we navigate through these evolving market dynamics, the anticipation surrounding the potential approval of a Spot BTC ETF becomes a pivotal focus. The next section of our analysis will explore its likely impact on Bitcoin’s demand, supply, and pricing. We’ll draw parallels with gold ETF launches and point to essential on-chain metrics that will help professional traders and investors to understand how this anticipated development might translate monetary demand into price movements. These tools can become instrumental for institutional market participants in forecasting how a Spot BTC ETF could influence Bitcoin’s investment landscape, potentially mirroring the transformative impact of ETFs in the gold market.
The potential approval of a Spot Bitcoin ETF is a watershed moment for the cryptocurrency market. The SEC’s nod of approval, spearheaded by major financial players like BlackRock, signifies a symbolic shift for Bitcoin – from an ephemeral digital currency for Internet enthusiasts to an institutional-grade asset, tradable as a regulated financial product. It will also mark its entry into the mainstream financial markets, opening it to a broad base of professional investors in the world’s largest and wealthiest financial market.
But the impact of the first Spot Bitcoin ETF goes beyond the symbolic. It also represents a potential a potentially significant influx of new demand. With the prevailing long-term HODLing pattern exacerbating Bitcoin’s scarcity, the introduction of an ETF could dramatically shift the market dynamics. But will this ETF indeed introduce substantial new demand? And while Bitcoin’s supply is indeed scarce, can we quantify how much of it is actually available for trading?
Our analysis takes a two-dimensional approach to these questions. First, we aim to quantify the anticipated demand for a Spot BTC ETF. We’ll examine historical parallels with gold ETF and recent demand analyses from market insiders. This will help us gauge the potential influx of capital into Bitcoin markets following the ETF’s approval.
Second, we turn to Bitcoin’s available supply, a crucial factor that’s often overlooked factor by those unfamiliar with the characteristic features of this digital asset. By analysing on-chain data, we’ll assess how much Bitcoin is currently tradeable and how much is held in long-term storage and therefore likely illiquid. Understanding these supply dynamics is essential to comprehend how the market might react to the potential new wave of demand.
A Historical Perspective: Spot Gold vs Spot Bitcoin
Drawing parallels between the first gold ETFs and the potential first Bitcoin ETF can be instructive in understanding their impacts on their respective assets.
The introduction of the first spot gold ETFs marked an important moment in the financial world and resulted in a substantial appreciation of gold prices. Over the decade following the ETF’s launch in 2004, gold’s value soared from approximately $270 per ounce to $1,000 per ounce, signifying a significant 19% annualized return.
This growth narrative offers an optimistic outlook for the potential impact of the first Spot Bitcoin ETF on Bitcoin’s market. If Bitcoin were to follow the same price trajectory as gold did after the approval of the first spot gold ETF, we could expect a substantial increase. Gold appreciated by approximately 270.37% during that period. Applying this percentage change to the current Bitcoin price of about $35,000, the potential future price of Bitcoin could reach approximately $129,630.
While the strong performance of gold during this period can be partially attributed to favourable macroeconomic conditions and a weakening US dollar, the launch of the gold ETF played a key role in making gold more accessible to a broader range of investors. This accessibility undoubtedly contributed to gold’s price appreciation.
In the case of Bitcoin, the anticipation surrounding the introduction of a Spot BTC ETF is generating a similar buzz. Still, as a potential counterargument for the growth narrative for Bitcoin, some analysts mentioned concerns regarding the actual market size for Bitcoin ETFs.
For example, current products like Grayscale’s Bitcoin Trust (GBTC) or MicroStrategy’s stock, often used as proxies for Bitcoin exposure, capture less than 7% of the total Bitcoin supply. Some argue that this indicates a market that is not as extensive as one might anticipate.
However, from an institutional perspective, these existing products are not ideal. GBTC, for instance, is known for its large fees and its structure that doesn’t permit redemptions, making it a less-than-optimal investment vehicle. Similarly, while MicroStrategy’s substantial Bitcoin holdings offer a way to gain exposure to Bitcoin, it is an imperfect proxy as it involves variables beyond just the performance of Bitcoin.
The introduction of a Spot BTC ETF is expected to overcome these limitations, offering a more direct and regulated investment avenue into Bitcoin. This could potentially attract substantial new capital, particularly from institutional investors who have been seeking a more conventional
Still, critics might argue that the introduction of a Spot Bitcoin ETF could lead to a mere reshuffling of funds, especially if GBTC converts into an ETF format, which would allow for outflows. It is still crucial, therefore, to look for other ways to assess the demand that can come into the Bitcoin space after the ETF is approved.
Estimating Inflows
In our analysis, we consider the potential inflows into a Bitcoin ETF from two key sources: stock and bond markets and the gold market. With the recent macroeconomic shift towards hard value and safe-haven assets, we hypothesize a more substantial capital movement from stock and bond markets to Bitcoin. We estimate 10% of the combined AUM of SPY, Vanguard Total Stock Market, and Vanguard Total Bond Market ETFs could move towards Bitcoin. This assumption is based on the current financial climate where stocks and bonds are facing challenges, making Bitcoin an attractive alternative for investors seeking value preservation and growth.
Additionally, we consider 5% of the gold market’s AUM shifting towards Bitcoin. While gold remains a popular safe-haven asset, the unique attributes of Bitcoin as a digital store of value could attract a portion of gold investors. However, we assume a smaller percentage from the gold market due to gold’s enduring popularity and stability as an investment.
Based on these assumptions, we estimate approximately $60.6 billion could flow into Bitcoin from the combined stock and bond ETFs, and about $9.9 billion from the gold market, totalling around $70.5 billion in potential new capital influx. This significant infusion of new capital could have a considerable impact on Bitcoin’s market, potentially driving up its price as it gains broader acceptance and becomes integrated into more traditional investment portfolios.
While a $70 billion ballpark number may seem too optimistic for many, it is important to note that it represents a relatively small percentage of the total ETF products market in the US which is currently valued at around $7 trillion. However, we can also compare our estimate to a more conservative one recently published by Galaxy Digital.
Galaxy Digital’s analysis projects $14 billion of inflows into a Bitcoin ETF in the first year post-launch, escalating to $27 billion in the second year and $39 billion by the third year. This estimation is based on the assumption that Bitcoin is adopted by 10% of total available assets in each wealth channel with an average allocation of 1%. In terms of price impact, Galaxy Digital estimates a +6.2% price impact for BTC in the first month of ETF launch, leading to an estimated +74% increase in BTC in the first year, using historical relationships between ETF fund flows and asset price changes.
At the current prices, a 74% increase in the price of Bitcoin within a year would give us a price of around $60K by the end of 2024 – right below BTC’s previous all-time high.
On-Chain Perspective
By estimating the anticipated influx of capital into Bitcoin markets following a potential Spot Bitcoin ETF approval, we have so far analysed the demand side of the equation. To understand the market dynamics that will likely unfold post-ETF introduction, we now need to turn our attention to Bitcoin’s available supply. The on-chain analysis provides a perfect toolbox to estimate these factors.
The prevalent long-term holding pattern among Bitcoin investors, marked by an increasing trend towards illiquidity, raises critical questions about the actual amount of Bitcoin available for trading. By delving into key on-chain metrics, we aim to gauge the extent of Bitcoin’s tradeable supply and its potential responsiveness to the anticipated new wave of demand, trying to estimate how these factors might interplay to shape Bitcoin’s market in the near future.
Trading-Ready Bitcoin Availability
One way to assess how much Bitcoin can be considered trading ready is to look at Short-Term Holder Supply. This concept represents the amount of Bitcoin that has been moved or transacted within a relatively recent timeframe, typically defined as the last 155 days. Coins that have not moved in over 155 days are usually considered part of the Long-Term Holder Supply, indicating a lesser likelihood of these coins being sold or traded imminently.
The rationale for equating Short-Term Holder Supply with trading-ready Bitcoin lies in the behavioural patterns of Bitcoin holders. Short-term holders are generally more responsive to market fluctuations and are likely to trade based on recent trends and developments.
Currently, the Short-Term Holder Supply is at multi-year lows, suggesting a shift in the market towards longer-term holding strategies. This reduction in short-term supply signifies a tightening of readily available Bitcoin for trading. Such a scenario is particularly relevant in the context of a new influx of demand from a Spot BTC ETF, where the limited available supply might struggle to satisfy the incoming demand, potentially leading to increased market volatility and price movements.
Illiquid and Liquid Supply Dynamics
Building on the concept of short- and long-term holders, the supply of Bitcoin can also be further segmented into the Illiquid, Liquid, and Highly Liquid categories, offering a more nuanced view of the market dynamics. This classification not only complements the short- and long-term holder framework but also adds depth to our understanding of Bitcoin’s available supply, particularly in the context of an ETF introduction.
- Illiquid Supply: Comprises Bitcoin in wallets that rarely engage in transactions, reflecting a strong HODLing behaviour, where the focus is on accumulation and retention rather than trading.
- Liquid Supply: Represents Bitcoin that is more frequently transacted. Wallets in this category show a mix of buying and selling activities, aligning more closely with the Short-Term Holder Supply. These are often investors and traders who actively engage with the market’s ebbs and flows.
- Highly Liquid Supply: Consists of Bitcoin that is very actively traded, often found in exchange wallets and used for high-frequency trading. This supply is the most responsive to market conditions and typically represents the most immediate and accessible source of Bitcoin for trading and investment.
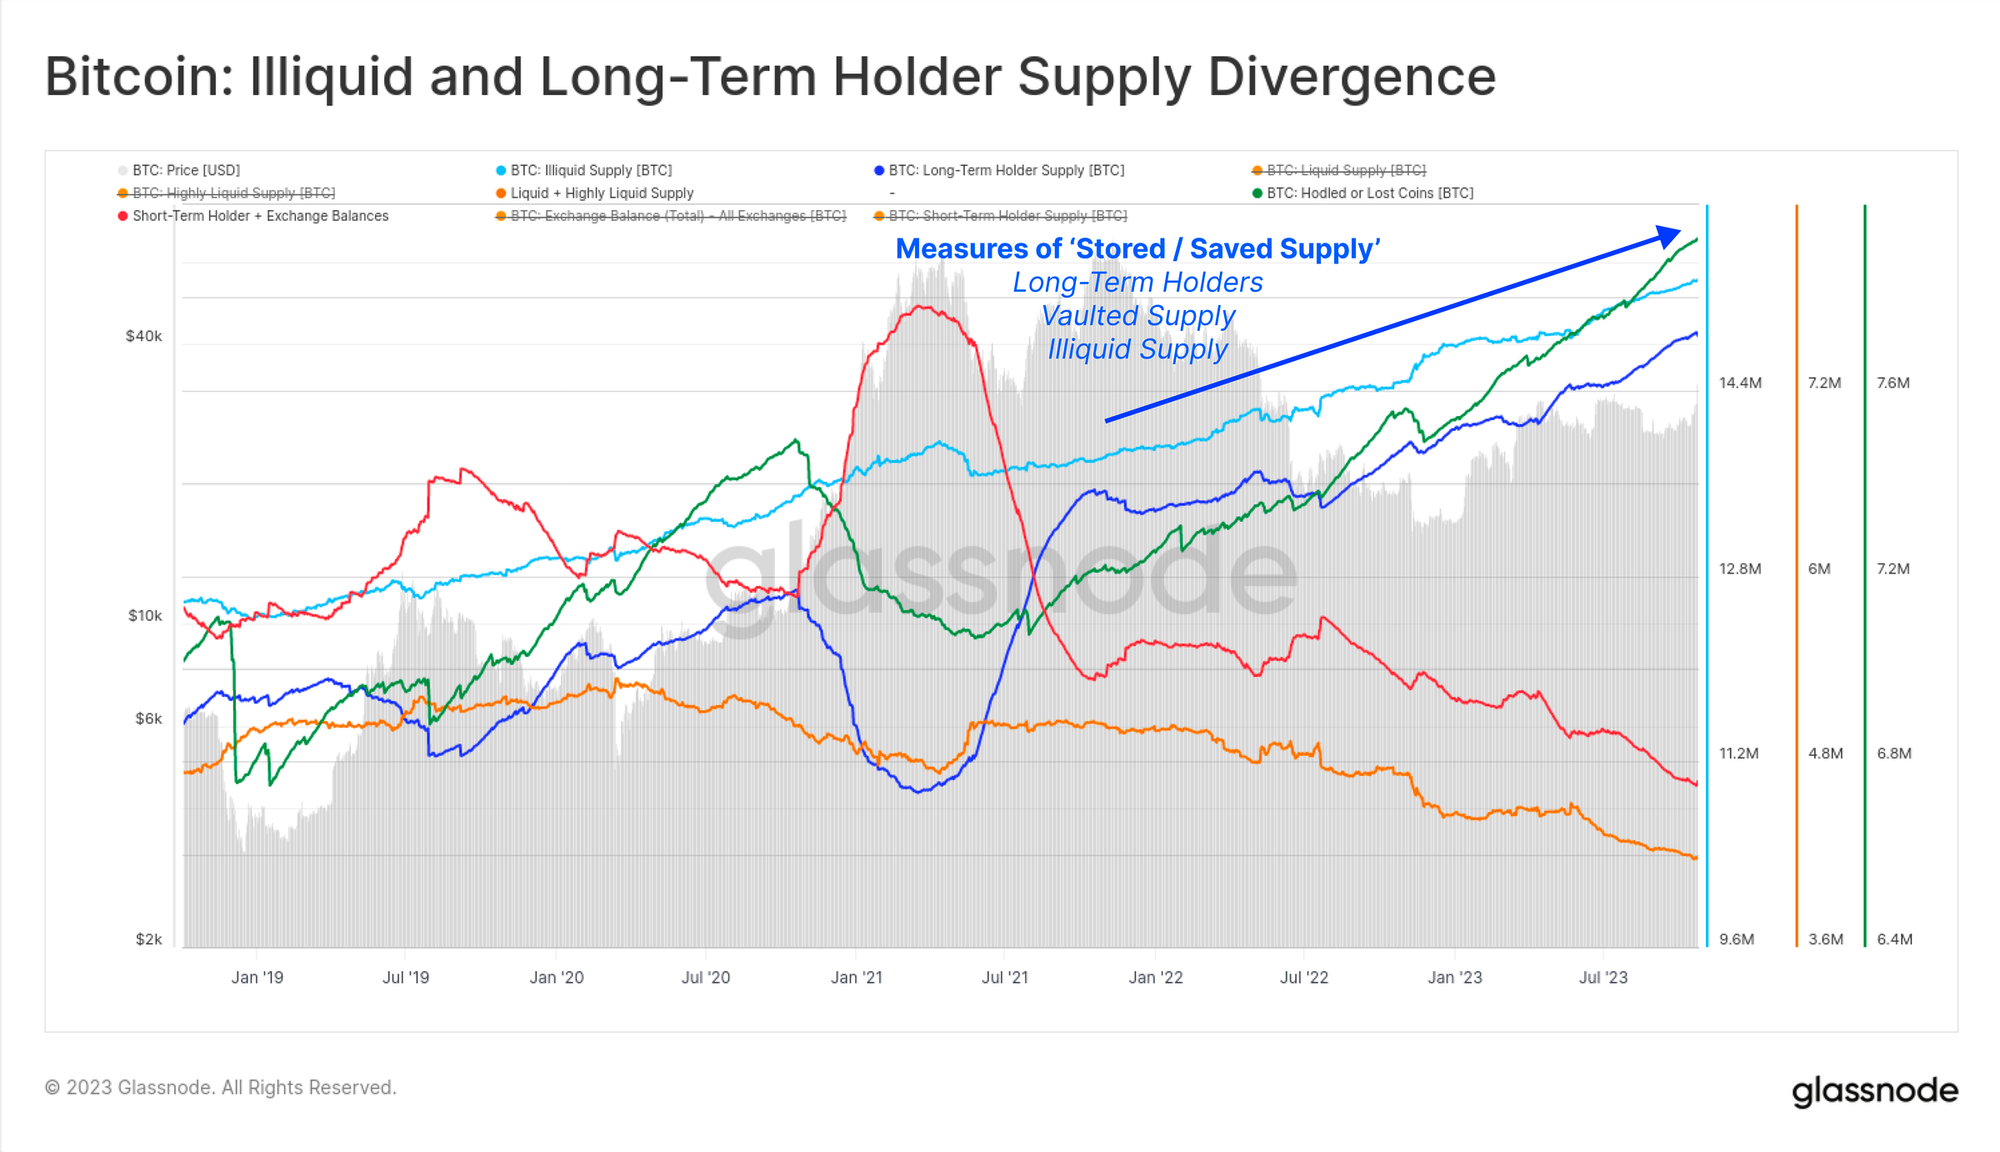
Within these categories, we have also seen a notable shift towards an increasing Illiquid Supply. This trend aligns with the reduction in Short-Term Holder Supply, indicating a market leaning towards accumulation and holding, rather than active trading.

On the other hand, the Liquid and Highly Liquid Supplies have seen relative declines, reflecting a reduction in readily tradable Bitcoin. Similar to short-term holder dynamics, this market structure implies a tighter market with less Bitcoin immediately available for new investors.
Realized Cap as a Measure of Capital Flows in Bitcoin
Understanding the Realized Cap of Bitcoin is crucial for assessing capital flows and their impact on market valuation, especially when considering the potential implications of a Spot BTC ETF. Realized Cap offers a more nuanced view compared to the traditional market cap, providing insights into the actual capital invested in Bitcoin over time.
While the traditional market cap multiplies the current price by the total supply, the Realized Cap calculates the value of each Bitcoin at the price it was last moved or transacted and then sums these individual values. This method acknowledges that not all Bitcoins are equal in terms of their last active market price, offering a more realistic assessment of the total invested capital. We have explained this concept and its application in detail in one of the previous editions of Finance Bridge, available here.
The Realized Cap is crucial in our discussion of the impact of Spot Bitcoin ETFs because its relationship with market cap changes can be used as a practical tool for gauging Bitcoin’s market sensitivity to new capital inflows. This sensitivity is a measure of how responsive the market value of Bitcoin is to the injection or withdrawal of funds.
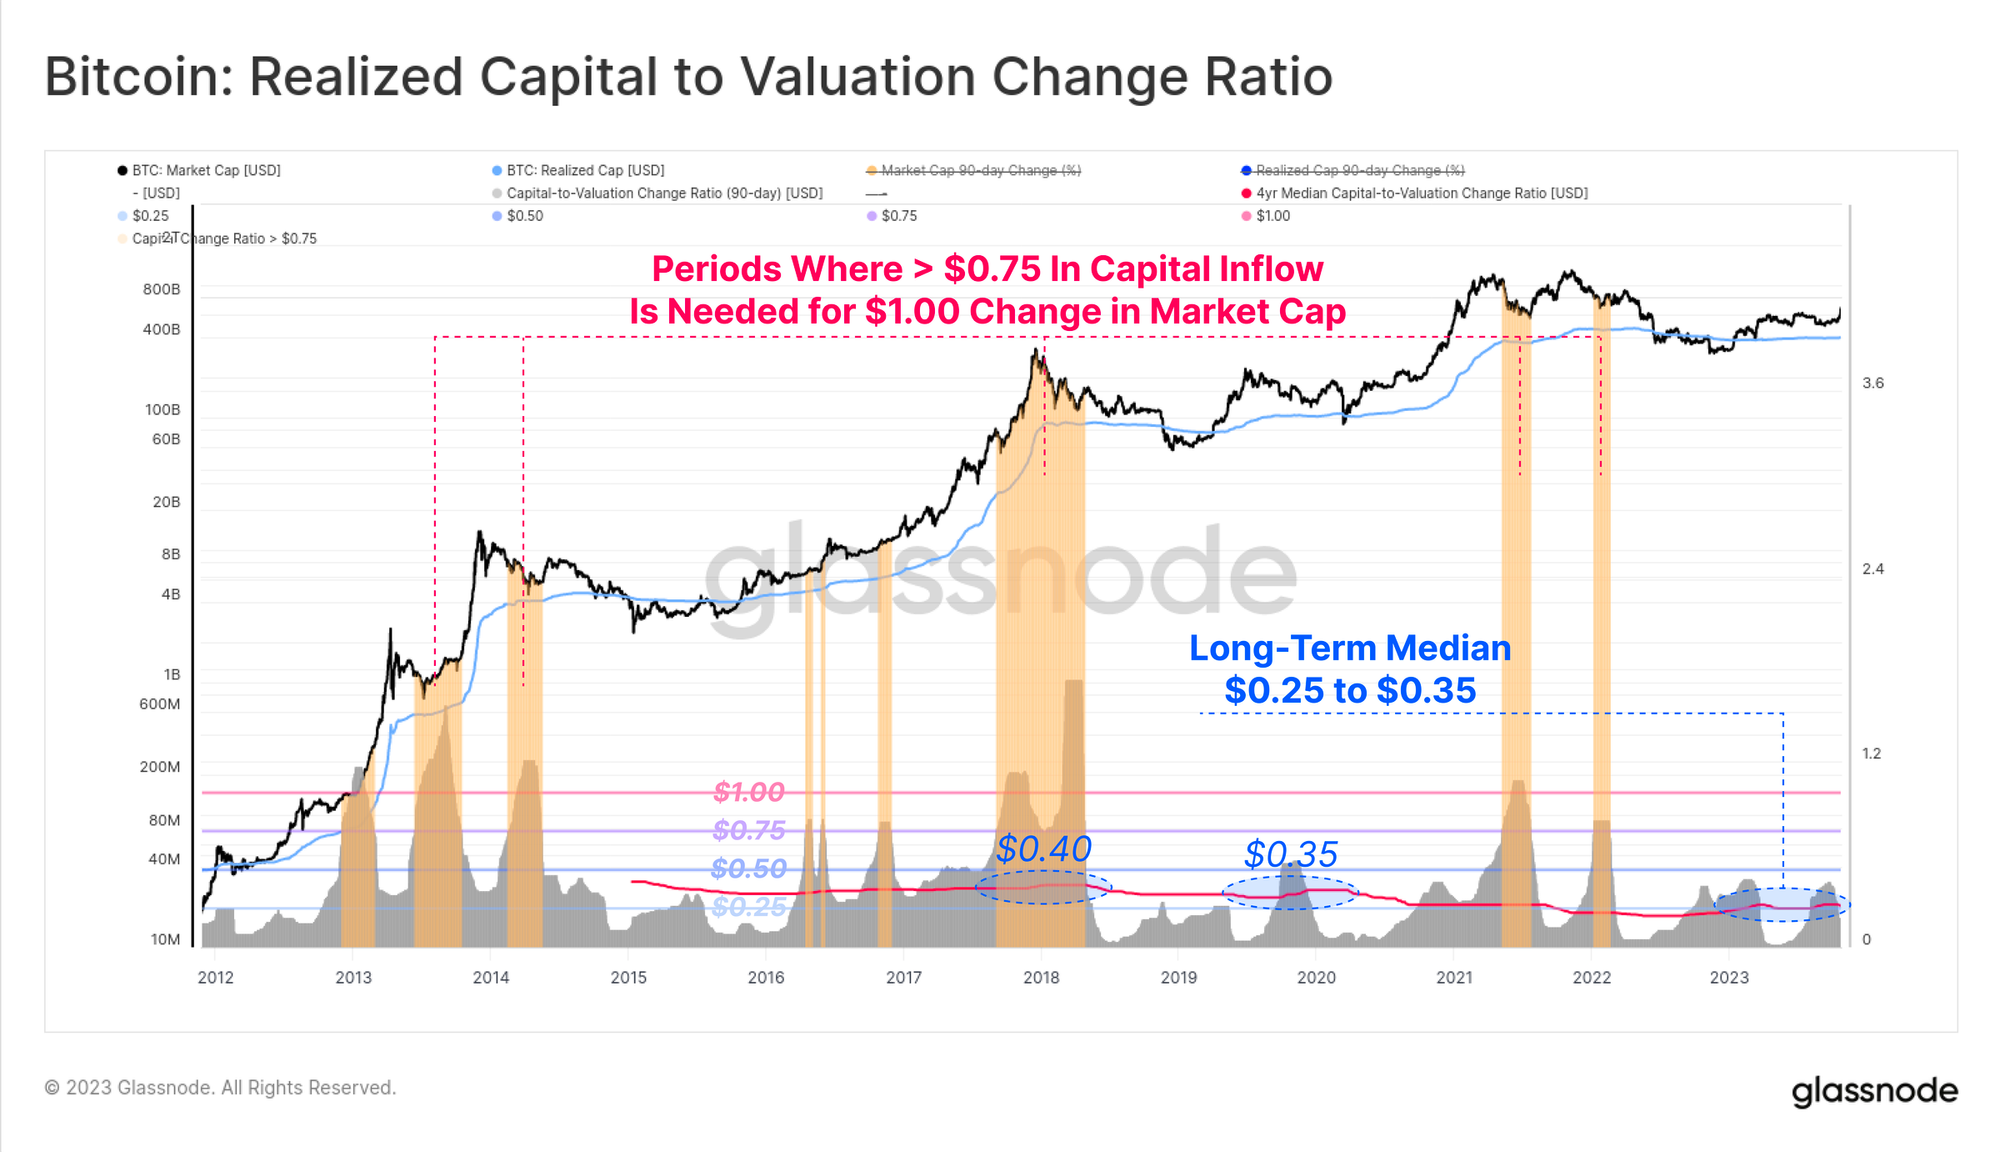
The methodology behind assessing this relationship has been laid out in a recent Week On-Chain report, available here. The general takeaway from this analysis is that when the ratio of capital inflow to market cap change is low, it suggests that even small amounts of new capital can lead to significant changes in market value. These periods of high sensitivity mark an environment where strategic, well-timed investments can yield substantial impacts. On the other hand, a higher ratio implies that larger capital inputs are necessary for the same effect, pointing to a lower sensitivity.
For institutions, understanding this dynamic is fundamental to strategizing investments in Bitcoin. In a highly sensitive market, smaller, tactical investments can have outsized effects on the market cap, potentially leading to significant returns. This insight is particularly relevant for navigating periods of market volatility or when the market is more receptive to new capital, such as following the launch of a Spot BTC ETF.
Conversely, during times of low sensitivity, larger investments are required to move the market cap noticeably. This situation calls for more substantial commitments and may involve greater risks, necessitating a more cautious investment approach. Institutions need to be aware of these sensitivity shifts to maximize returns and mitigate risks effectively.
The introduction of a Spot BTC ETF is expected to change the market’s sensitivity to capital inflows. Institutions should closely monitor the Realized Cap in the aftermath of the ETF launch as it will be a crucial metric for adapting investment strategies to align with the new market dynamics. Understanding these shifts will enable institutions to effectively respond to changes in Bitcoin’s market behaviour, leveraging the Realized Cap as a guide to navigate the evolving landscape and optimize their investment decisions.
Conclusions
The anticipated approval of a Spot Bitcoin ETF represents a historical moment for Bitcoin, symbolizing its transition from a digital asset predominantly favoured by individual investors to an institutional-grade investment. This shift not only underlines Bitcoin’s regulatory and mainstream acceptance but also sets the stage for significant new demand from professional investors within the world’s most extensive financial market.
Historical parallels with the introduction of gold ETFs hint at a potential appreciation in Bitcoin’s price, similar to gold’s post-ETF trajectory. Our analysis suggests that while a Spot BTC ETF could inject substantial new capital, it confronts a market where the available supply of Bitcoin is predominantly locked in long-term holdings. The scarcity of readily tradable Bitcoin may amplify market volatility and price movements in response to the influx of ETF-driven capital.
For institutional investors, understanding these dynamics, particularly through on-chain metrics like the Realized Cap, is crucial. This approach will offer a deeper insight into the market’s response to new capital inflows, guiding investment strategies in the new trading environment post ETF launch.
At Glassnode, a key approach to classifying Bitcoin investors is through the concepts of Long-Term Holders (LTH) and Short-Term Holders (STH). These classifications, based on observed spending behaviours and statistical patterns of coin movements, provide a window into the investment strategies and market responses of different investor cohorts.
The Dynamics of Long and Short-Term Holders
Long-Term Holders or LTHs are those who retain their Bitcoin for extended periods, typically spanning several months to years. The threshold to qualify as an LTH is approximately 155 days of holding. Beyond this period, coins become increasingly unlikely to be spent, indicating a commitment to longer-term investment strategies. LTH behaviour is often aligned with bearish market trends, where these investors accumulate coins at lower prices, suggesting a bullish trend is on the horizon.
Short-Term Holders (STHs), in contrast, are newer market entrants or active traders. They are more likely to respond to short-term market volatility and exit their positions more readily. Coins held for less than 155 days fall into this category, reflecting a more liquid and active portion of Bitcoin’s supply. The behaviour of STHs is particularly significant during bullish market phases, where these holders tend to be more active, contributing to increased market liquidity and potential sell-side pressure.

Utility in Market Analysis
The distinction between LTHs and STHs is valuable for understanding market sentiment and potential future movements. For instance, a dominant LTH supply often correlates with accumulation phases, where experienced investors buy and hold, anticipating future price increases. Conversely, an increasing STH supply can signal heightened market activity and potential sell pressure, often observed in bull markets.
Practical Application in Trading and Risk Management
Traders can use the LTH and STH metrics to gauge market sentiment. A rising LTH supply suggests a good time for accumulation, as it often precedes bullish trends. Meanwhile, an increase in STH supply can indicate a potential market peak or increased volatility, signalling traders to adjust their strategies, possibly taking profits or reducing positions.
For risk management, the balance between LTH and STH supply helps in assessing the overall market stability. A market dominated by LTHs is generally more stable and less prone to sudden price swings, suggesting lower risk for long-term investments. In contrast, a high STH supply indicates a more volatile market, necessitating more rigorous risk management strategies to mitigate potential losses due to market fluctuations.
In summary, understanding the dynamics between LTHs and STHs is a vital aspect of market analysis in Bitcoin trading. It not only helps in identifying current market trends but also aids in making informed decisions for trading and risk management. By keeping an eye on the shifts between these two cohorts, traders and investors can better navigate the complex landscape of the Bitcoin on-chain.
If you would like to learn more about this metric as well as to discover its derivative indicators and the multiple ways you can learn it, Glassnode has prepared a comprehensive Dashboard. We also encourage you to deepen your understanding of this essential metric by reading this dedicated article on Glassnode Academy pages. These resources will help you take your first steps in the world of on-chain analysis and use the insights you uncover in your day-to-day trading or risk management activities.
Get Personalised Insights
We hope that Finance Bridge continues to provide valuable insights and helps you navigate the crypto landscape more effectively.
If you have an idea about how we could improve this newsletter to make it more practical for you, we invite you to engage with us. Do you have any questions about the content of this issue or any other queries? Would you like to connect directly with our team of analysts? Or are you interested in discovering how you can leverage Glassnode’s full potential?
Don’t hesitate to reach out. Your thoughts and insights will help us continue to improve the quality of our services and this newsletter, so we’re genuinely excited to hear from you. Schedule a call with a dedicated member of our Institutional sales team to begin the conversation.
Disclaimer: This report does not provide any investment advice. All data is provided for information and educational purposes only. No investment decision shall be based on the information provided here and you are solely responsible for your own investment decisions.

- SEO Powered Content & PR Distribution. Get Amplified Today.
- PlatoData.Network Vertical Generative Ai. Empower Yourself. Access Here.
- PlatoAiStream. Web3 Intelligence. Knowledge Amplified. Access Here.
- PlatoESG. Carbon, CleanTech, Energy, Environment, Solar, Waste Management. Access Here.
- PlatoHealth. Biotech and Clinical Trials Intelligence. Access Here.
- Source: https://insights.glassnode.com/finance-bridge-spot-btc-etf-impact/

