Gene mining of NLR genes in Arachis species
Here we utilized the NLR tracker pipeline15 for NLR genes mining and successive annotations. In case of wild diploid ancestral species for A-genome a total of 521, 354, 284 NLR genes were identified from A. cardenasii, A. stenosperma and A. duranensis. In total, 257 and 454 were identified from A- subgenome of wild (A. monticola) and domesticated (A. hypogaea) tetraploids (AABB) respectively (Fig. 1). Whereas, B-genomes species including A. ipaensis, A. monticola, A. hypogaea contain 290, 397 and 340 NLR genes in their diverse repertoire. Interestingly, A-subgenome from domesticated tetraploid species (A. hypogaea) revealed the significant expansion in the NLR in contrast to A. monticola where reduced number of NLR genes were identified. On the contrary B-subgenome of domesticated tetraploid A. hypogaea revealed contraction as compared to of A. monticola. In addition, among the wild species A. cardenasii shows the expanded NLRome repertoire among all Arachis species (Fig. 1). All four classes of NLR genes were present in all members of Arachis genus. Overall CC-NLR have shown the highest contribution among other classes, on average 51.35% CC-NLR, 35% TIR, 12.1% CCG10 and 1–2% CCR -NLR genes were identified in members of genus Arachis. Interestingly, helper NLR were present in relatively large numbers in tetraploid species especially in A. hypogaea where both AA and BB genome shares 12 CCR-NLR and all the diploid members possess 3–5 CCR except A. ipeansis where 11 CCR helper genes were reported. It is consistent with the previous observation that polyploidization may increase or decrease the number certain genes families32, here CCR shows symmetric expansion in A. hypogaea in both genomes. Distribution of NLR length, length of conserved NB-ARC and species wise domain organization is also provided (Figure S1, S2, S3).
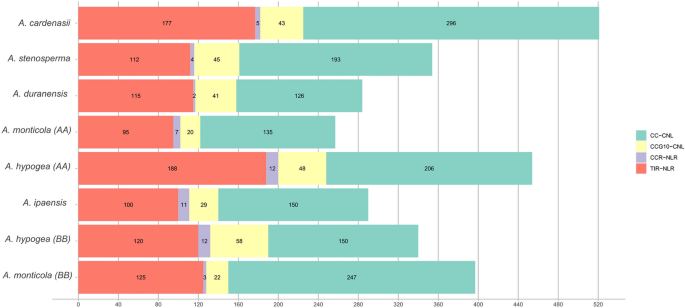
Inverted barplot represent distribution of four classes of NLRs in A. cardenasii, A. stenosperma, A. duranensis, A. monticola, A. ipaensis and A. hypogaea.
Landscape of NLR genes among genus Arachis
We also compared the syntenic relationship between A. hypogaea subgenomes and their progenitor. Highly conserved homeologoues clusters were identified in the syntenic comparison between A-subgenome and B-subgenome of A. hypogaea (Figure S4, A). It should be noted that less syntenic relationships were observed for comparison of each subgenome with its progenitors (Figure S4 B, C). We also studied the landscape of NLR genes in all eight genomes of Arachis genus by plotting the gene density of NLR genes on linearized chromosomes (Fig. 2). Interestingly, A. cardeansii revealed the highest gene density with respect to its size. We also observed the effect of allopolypoid in both wild and domesticated tetraploid species. Interestingly, A-subgenome have shown contraction in wild tetraploid and later on shows significant expansion upon domestication in A. hypogaea. On the contrary, B-subgenome of A. monticola expanded significantly after allopolyploidy with second highest gene density after A. cardenasii (Fig. 2). Overall, synteny and gene density maps strongly suggest that allopolyploidization favors expansion in NLR gene density in Arachis species with the exception of A-subgenome of A. monticola.
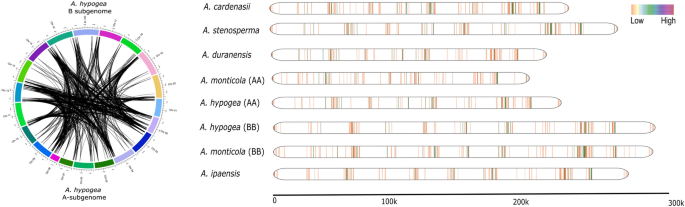
Synteny analysis and landscape of NLR genes. (A) Synteny analysis explores depth of evolution and conserved shared synteny between A and B subgenomes of A. hypogaea. (B) The NLR gene density map of all six species of genus Arachis on linearized chromosomes.
In addition we compared the architecture of resistance gene clusters (RGCs) in each species of genus Arachis (Figure S10). Majority of NLR genes were allocated in the form of RGCs. Most of RGCs were allocated on Chr02, Chr04, Chr05, Chr08 and Chr09 (Figure S10). Highest number of total 29 RGCs were found in A. cardenasii and A. stenosperma and the least numbers were observed for A. monticola (A-subgenome). Interestingly, individual number of genes in each cluster were amplified in A. cardenasii, A. hypogea (A-subgenome) and A. monticola (B-subgenome) suggesting active role of tandem duplication in expansion of their NLRome. In addition, presence and absence of RGCs were variable in each genomes.
Phylogenetic analysis and classification of NB encoding genes
Conserved NBARC domain was extracted from each Arachis species and clustered at 75 percent sequence identity using CD-HIT33. Representative members from each cluster (total = 380) were utilized for reconstruction of phylogenetic relationship among A. stenosperma, A. duranensis, A. cardenasii, A. monticola (AA), A. monticola (BB), A. hypogaea (AA), A. hypogaea (BB) and A. ipaensis (Fig. 3). TNL clade was branched out as expected, however TNL remained polyphyletic and three major radiations were observed. On the other hand CNL clade was divided in to three monophyletic major sub-clades CC-NLR, CCR-NLR and CCG10-NLR. CC-NLR was further divided in four major sub-groups CNL-Un, CNL-G11, CNL-G7 and G4. Significant expansion and diversity was observed in G4 and especially in G7 where four strongly supported polyphyletic sub-clades were observed. Interestingly, CNL groups G1, G2, G3, G4, G6, G8 previously identified from Solanaceae family were absent in genus Arachis. That is consistent with the studies from Cicer and dalbergioids, which strongly suggest that Fabaceae members lack G1-G8 groups34,35.
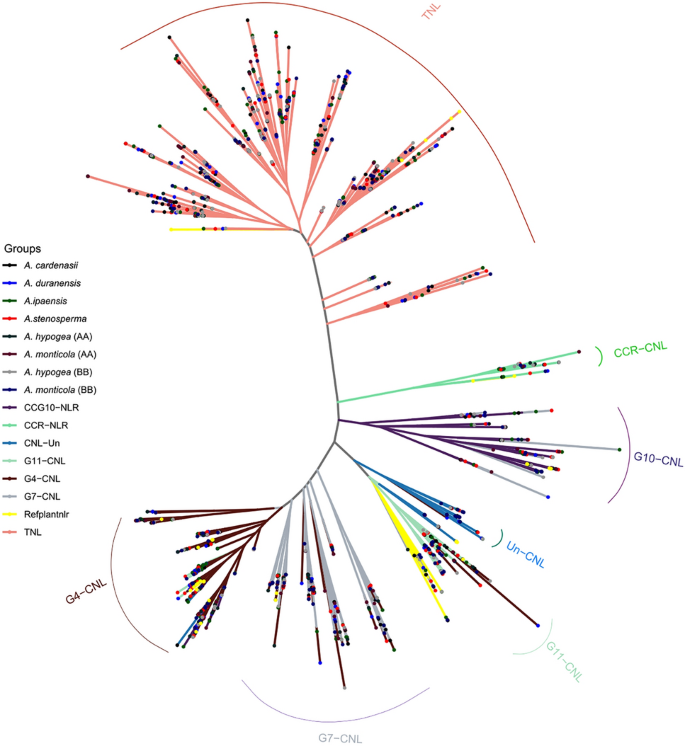
Classification of subgroups of NLR genes using phylogenetic reconstruction. Phylogenetic tree construction is based on the Maximum likelihood method on the VT + F + R9 model. The tree is divided into 7 CNL and 1 TNL subgroups. All the branches are highlighted with their subgroup-specific colors.
Phylogenetic analysis further suggest that progenitor of AA sub-genome, A. duranensis had less number of TIR and CC-NLR genes. After allopolyploidy significant expansion in TIR and CC-NLR genes can be observed. Highest number of these groups can be identified in AA subgenome of domesticated tetraploid A. hypogaea. Interestingly, among all species A. cardenasii has the highest number of TIR and CC-NLR genes considering its diploid nature. This unbalanced gene duplication occurrences across Arachis species suggest possible role of terminal duplication after the divergence from common ancestors.
We also compared the selection pressure within in the pairs of paralogs from four major subgroups (G4, G7, CCG10-NLR, TIR-NLR). G4 (Median = 0.502) and G7 (Median = 0.534) has the highest values of Ka/Ks as compared to other two major groups TIR-NLR (Median = 0.457) and G10 (Median = 0.427), which were evolving under purifying selection. This observation is consistent with the fact that preferential expansion of G4 and G7 is also observed in other Fabacaeae genus Cicer and Dalbergia (unpublished results). In case of A. monticola higher Ka/Ks values of 1.002 was observed for CCG10 subgroup that suggest that its evolving under neutral selection (Figure S5, S6, Table S3).
Duplication assay
Expanded NLRome of A. cardenasii could be because of multiple evolutionary mechanism including duplication, recombination and transposition. Here we explored the duplication history of Arachis NLRs by comparing the Ks values between paralogs of each subgroup. Notably the Arachis lineage have been rapidly accumulating silent changes (~ 1.4 time faster) since the divergence of the Dalbergioid clade1. The closest estimates for divergence between two progenitor of each AA (A. duranensis) and BB (A. ipaensis) sub-genome is recently computed as 2.12 Mya32. However, the precise estimate of divergence of other species from the common ancestor is still not reported. Collective Ks values obtained from all groups suggest one common duplication curve between 0.04 and 0.1 Ks (2.1–6 Mya) (Fig. 4, Table S3). That strongly suggest NLR gene duplication have occurred before the speciation. Highest frequency for gene duplication was observed in A. cardenasii, where peak value of Ks corresponds 0.08 (~ 4.92 Mya). TNL and subgroups G4-CNL, G7-CNL gene had been amplified dramatically through gene duplication events before speciation. Similarly other species A. monticola (B-subgenome) and A. stenosperma also revealed relatively higher frequencies of gene duplication. Interestingly, the progenitor species A. duranensis and A. ipaensis had the least frequency of Ks value for gene pairs. Furthermore, we also tested gene duplication using orthofinder (v 2.5.4: Fig. 5B, D). Consistent with Ks estimates, it suggests that in both A and B genome species highest duplication were observed in the common ancestor of Arachis. Furthermore, Orthofinder provides evidence for relatively higher terminal duplication in A. cardenasii (95) and A. monticola (83: B-subgenome) (Fig. 5B, D). In short, all species represents a common wave of duplication that led to major expansion in NLRome which occurred in the common ancestor of genus Arachis. In addition, terminal duplication was also observed after speciation in specific species that expanded the repertoire of NLR genes in A. cardenasii and A. monticola (B-subgenome).
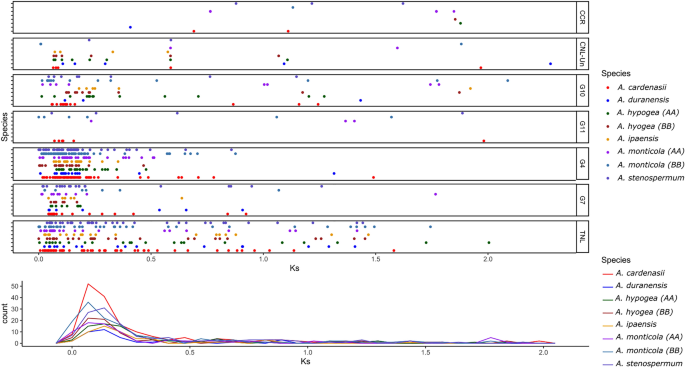
Duplication history of NLR genes in genus Arachis. Ks-values between paralogs of each subdivision are shown for all six species, where tetraploid species are divided into their constituent subgenomes. (A) X and Y represents the Ks values and frequencies, respectively (B). Overall duplication pattern of NLR genes in genus Arachis.
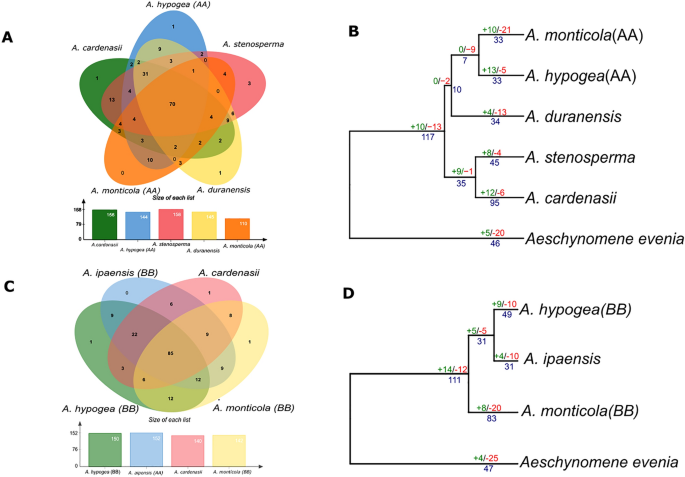
Ortholog and gene gain and loss analysis. (A, C) Venn diagram represents the shared and common genes (Orthologous clusters) distribution found between A genome related species and B genome related species respectively. (B, D) Gene gain and loss are indicated on each nodes with number of gene gain (green), loss (red) and duplication (blue) for A and B genome related species respectively.
Gene gain and loss
A total of 70 common orthogroups were found conserved in A-genome related species whereas as B-subgenome has 85 common orthogroups (Fig. 5A, C). We constructed the phylogenetic tree for each subgenome with birth and death of genic events among members of genus Arachis. Aeschynomeme evenia was considered as most related outgroup for common ancestor of Arachis. Birth and death model of A-subgenome reveals that contraction of NLR gene families occurred in Aesechynomene evenia which is consistent with overall NLR contraction after whole genome duplication following diploidization. In addition, common ancestor of genus Arachis suggest increased number of gene duplication and gains of 10 additional NLR gene families (Fig. 5B, D). Progenitor of A-subgenome A. duranensis and wild tetraploid A. monticola has shown death of gene families except A. hypogaea where expansion in number of NLR families was observed. Similarly, A. cardenasii revealed the highest expansion of number of diverse gene families probably due to terminal duplication and gained 12 gene families (Fig. 5B, D). Similar trend was found in case of B-subgenome evolution, contraction in the outgroup species and expansion of NLRome in the common ancestor Arachis. Especially in case of A. monticola (B-subgenome) where expansion of NLR genes occurred that is consistent with expansion of other gene families including starch and sugar metabolism, linoleic acid metabolism and cutin synthesis32. In short, asymmetric evolution of NLR genes in A and B sub-genome was observed in wild and domesticated tetraploid species.
Impact of natural and artificial selection pressure on NLR genes
We further studied the impact of natural and artificial selection on NLR gene evolution in both wild and domesticated tetraploid species respectively. For this purpose we compared the ka/ks ratio of orthologs present between subgenomes and their progenitor species (Fig. 6). Ka/Ks values for orthologs between A-subgenome of A. monticola and A. duranensis were significantly higher in A (median = 0.479) as compared B-subgenome (median = 0.455). Similarly, ka/ks values were higher in A (median = 0.488) as compared to B subgenome (median = 0.479) of A. hypogaea (Fig. 6). A bias was observed in selection pressure for A sub-genome NLR genes in both wild and domesticated tetraploid. We also studied the nature of selection pressure on two early diverged species of A-subgenome, for this purpose we compared ka/ks values orthologues of A. cardenasii and A. stenosperma with respect to A. duranensis. These species shows highest degree of natural selection as compared to other wild species, especially A. cardenasii with the selection pressure of M = 0.528. that potentially be the reason for expanded repertoire of NLR genes.
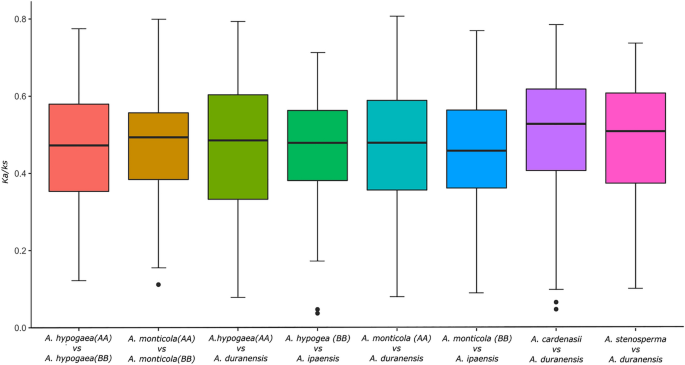
Boxplot represent Ka/Ks values between Arachis species. Middle line between each bare represent median of respective ka/ks.
Expression analysis of NLR genes in Arachis species
We further compared the basal expression level of identified genes in A. hypogaea in three tissue pod, seed and shell. In total 37 NLR genes were constitutively expressed in all three tissues types, notably two genes HV9GRN.1 and 256JRY.1 that belongs to subgroup CCR-NLR and CCG10-NLR respectively shows the highest expression levels in all tissue types (Figure S7). In another study, we evaluated the expression of NLR genes in susceptibe (JL 24) and resistant cultivar (U-475) of A. hypogaea upon Aspergillus flavius infection (Fig. 7). In both cultivars 12 NLR genes were differential expressed and showed strong correlation with disease progresssion. Especially three genes (SMD16A.1, OMH239.1 and WIN0WV.1) revealed higher up-regulation during 3 and 7 dpi in both cultivars (Fig. 8). All three genes are belonged to subgroup G4-CNL which is principal receptor containing coiled coil domain for recogniation of pathogens. Interestingly, no signifcant differences were observed in the expresion profile NLR genes in susceptible and resistant genotype. Presumably other resistance gene including receptor-like kinases (RLK) and receptor-like proteins (RLP) might be responsible for the difference in their genotype.
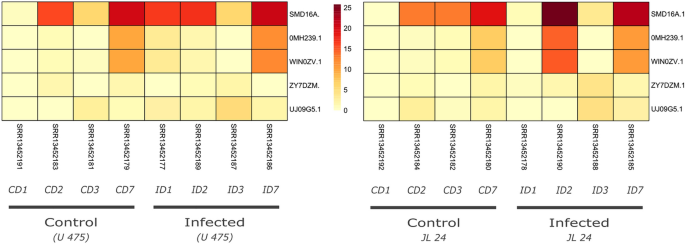
Comparison of NLR gene expression of susceptible (JL-24) and resistant (U-475) cultivar under Aspergillus flavius infection. Four time points including 1, 2, 3, 7 day post infection (dpi) were selected for the evaluation of their expression.
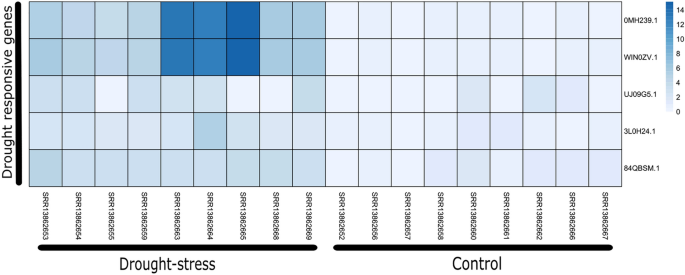
Comparison of NLR gene expression under drought conditions. Five drought responsive genes were identified indicated in left side.
Recently, it was reported that NLR genes also plays important role under the drought stresss conditions36. Here we tested this hypothesis for A. hypogaea by comparing the expression of NLR genes under well watered versus drought conditions. In this dataset we identified five drought responsive genes (OMH239.1, WIN0ZV.1, UJJ09G5.1, 3L0H24.1 and 84QBSM.1) that were overexpressed during drought conditions. Since this dataset contains biological replicate for 5 days, 7 days and 9 days post drought situation (pds), interestingly we observed highest expression upto 14 fold in 9 days (pds) notably for two genes (0MH239.1, WIN0ZV.1) (Fig. 8).
We also evaluated the expression of NLR genes in both tetraploids and their progenitors as well as synthetic nascent interspecific hybrids and neopolyploids. Bertoili et al.37 reconstructed the hybrids of A. duranensis x A. ipaensis and subsequently induced polyploidy through colchicine treatment. RNA-seq analysis was performed on initial diploids, neopolyploids (1st and 9th generation). Conserved NLR genes that are common to major Arachis species has shown expression bias for interspecific diploid and neo-allopolyploids. Higher individual and cummulative expression levels were observed in synthetic interspecific diploid (AB, A. duranensis x A. ipaensis), neopolyploid (4x) and A. monticola as compared to Arachis hypogaea (Figure S8, S9). In short, NLR genes shows higher quantitative expression levels in A. monticola and neopolyploids (Figure S8).
- SEO Powered Content & PR Distribution. Get Amplified Today.
- EVM Finance. Unified Interface for Decentralized Finance. Access Here.
- Quantum Media Group. IR/PR Amplified. Access Here.
- PlatoAiStream. Web3 Data Intelligence. Knowledge Amplified. Access Here.
- Source: https://www.nature.com/articles/s41598-023-36302-1

