Lately, I have been focusing on data storytelling and its importance in effectively communicating the results of data analysis to generate value. However, my technical background, which is very close to the world of data management and its problems, pushed me to reflect on what data management needs to ensure you can build data-driven stories quickly. I came to a conclusion that is often taken for granted but is always good to keep in mind. You can’t rely only on data to build data-driven stories. It is also necessary for a data management system to consider at least two aspects. Do you want to know which ones? Let’s try to find out in this article.
What we’ll cover in this article:
- Introducing Data
- Data Management Systems
- Data Storytelling
- Data Management and Data Storytelling
1. Introducing Data
We continually talk about, use, and generate data. But have you wondered what data is and what types of data exist? Let’s try to define it.
Data is raw facts, numbers, or symbols that can be processed to generate meaningful information. There are different types of data:
- Structured data is data organized in a fixed schema, such as SQL or CSV. The main pros of this type of data are that it’s easy to derive insights. The main drawback is that schema dependence limits scalability. A database is an example of this type of data.
- Semi-structured data is partially organized without a fixed schema, such as JSON XML. The pros are that they are more flexible than structured data. The main cons is that the meta-level structure may contain unstructured data. Examples are annotated text, such as tweets with hashtags.
- Unstructured data, such as audio, video, and text, are not annotated. The main pros are that they are unstructured, so it’s easy to store them. They are also very scalable. However, they are challenging to manage. For example, it’s difficult to extract meaning. Plain text and digital photos are examples of unstructured data.
To organize data whose volume is increasing over time, it’s essential to manage them properly.
2. Data Management
Data management is the practice of ingesting, processing, securing, and storing an organization’s data, which is then utilized for strategic decision-making to improve business outcomes [1]. There are three central data management systems:
- Data Warehouse
- Data Lake
- Data Lakehouse
2.1 Data Warehouse
A data warehouse can handle only structured data post-extraction, transformation, and loading (ETL) processes. Once elaborated, the data can be used for reporting, dashboarding, or mining. The following figure summarizes the structure of a data warehouse.
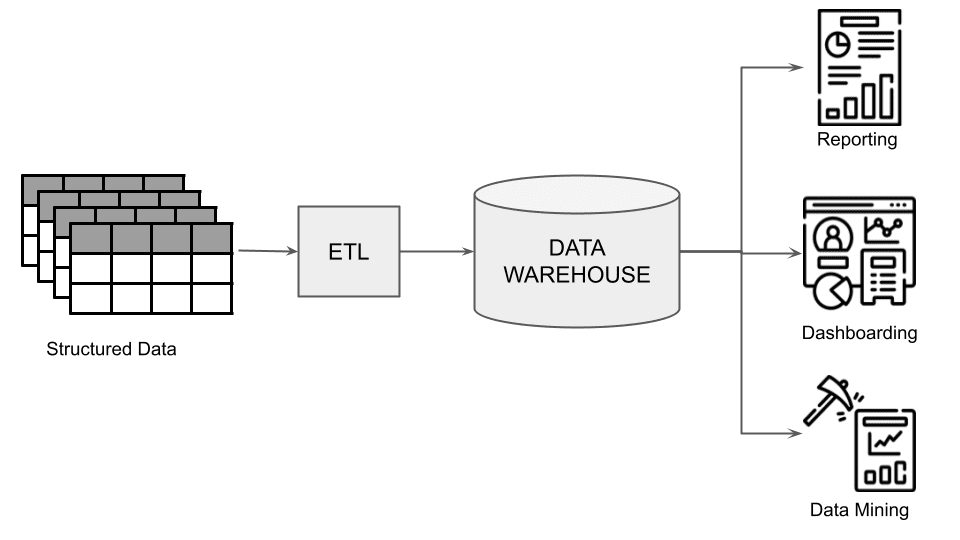
Fig. 1: The architecture of a data warehouse
The main problems with data warehouses are:
- Scalability – they are not scalable
- Unstructured data – they don’t manage unstructured data
- Real-time data – they don’t manage real-time data.
2.2 Data Lake
A Data Lake can ingest raw data as it is. Unlike a data warehouse, a data lake manages and provides ways to consume or process structured, semi-structured, and unstructured data. Ingesting raw data permits a data lake to ingest historical and real-time data in a raw storage system.
The data lake adds a metadata and governance layer, as shown in the following figure, to make the data consumable by the upper layers (reports, dashboarding, and data mining). The following figure shows the architecture of a data lake.
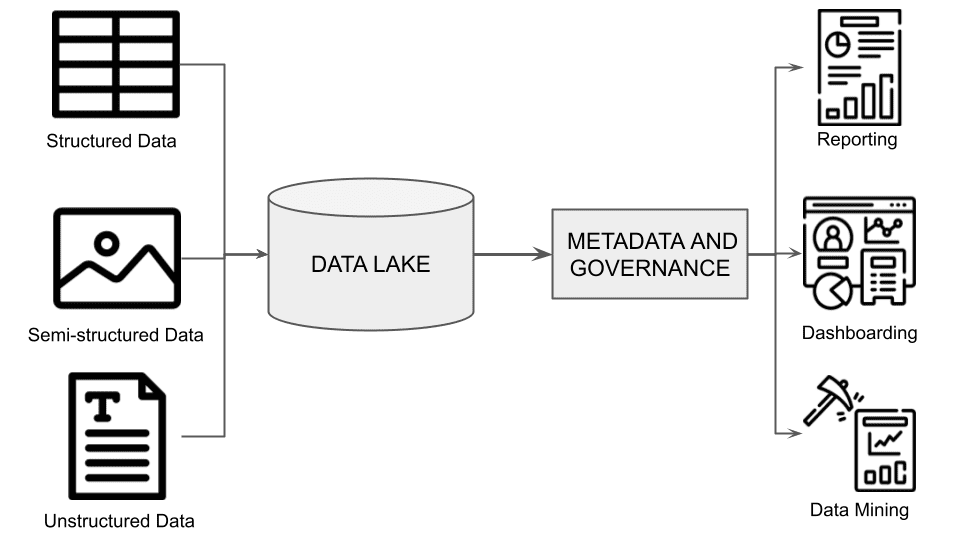
Fig. 2: The architecture of a data lake
The main advantage of a data lake is that it can ingest any kind of data quickly since it does not require any preliminary processing. The main drawback of a data lake is that since it ingests raw data, it does not support the semantics and transactions system of the data warehouse.
2.3 Data Lakehouse
Over time, the concept of a data lake has evolved into the data lakehouse, an augmented data lake that includes support for transactions at its top. In practice, a data lakehouse modifies the existing data in the data lake, following the data warehouse semantics, as shown in the following figure.
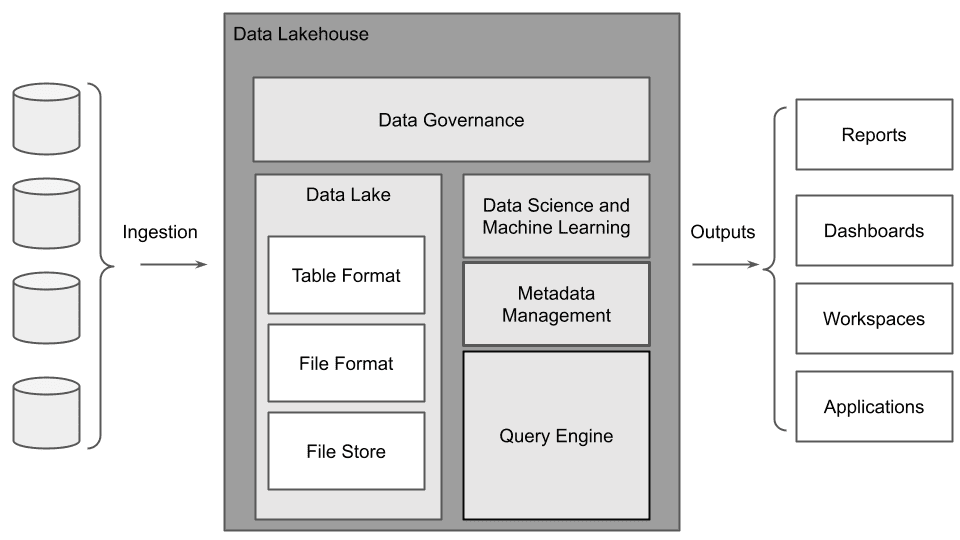
Fig. 3: The architecture of a data lakehouse
The data lakehouse ingests the data extracted from operational sources, such as structured, semi-structured, and unstructured data. It provides it to analytics applications, such as reporting, dashboarding, workspaces, and applications. A data lakehouse comprises the following main components:
- Data lake, which includes table format, file format, and file store
- Data science and machine learning layer
- Query engine
- Metadata management layer
- Data governance layer.
2.4 Generalizing the Data Management System Architecture
The following figure generalizes the data management system architecture.
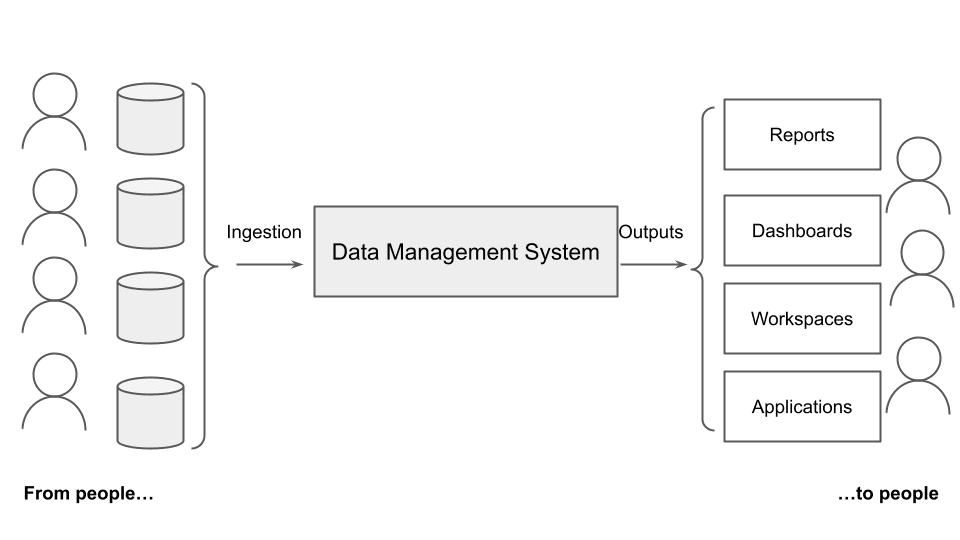
Fig. 4. The general architecture of a data management system
A data management system (data warehouse, data lake, data lakehouse, or whatever) receives data as an input and generates an output (reports, dashboards, workspaces, applications, …). The input is generated by people and the output is exploited again by people. Thus, we can say that we have people in input and people in output. A data management system goes from people to people.
People in input include people generating the data, such as people wearing sensors, people answering surveys, people writing a review about something, statistics about people, and so on. People in output can belong to one of the following three categories:
- General public, whose objective is to learn something or be entertained
- Professionals, who are technical people wanting to understand data
- Executives who make decisions.
In this article, we will focus on executives since they generate value.
But what is value? The Cambridge Dictionary gives different definitions of value [2].
- The amount of money that can be received for something
- The importance or worth of something for someone
- Values: The beliefs people have, especially about what is right and wrong and what is most important in life, that control their behavior.
If we accept the definition of value as the amount of money, a decision maker could generate value for the company they work for and indirectly for the people in the company and the people using the services or products offered by the company. If we accept the definition of value as the importance of something, the value is essential for the people generating data and other external people, as shown in the following figure.
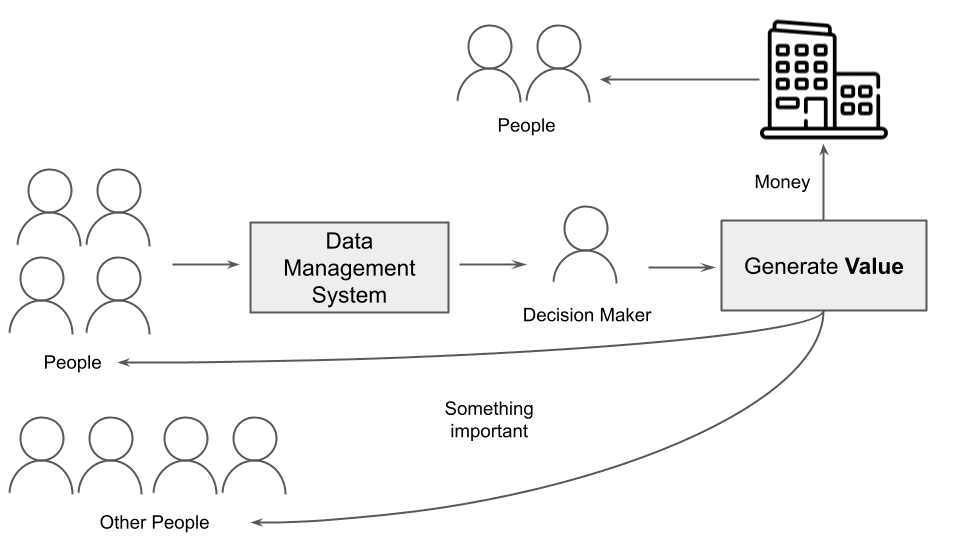
Fig. 5: The process of generating value
In this scenario, properly and effectively communicating data to decision-makers becomes crucial to generating value. For this reason, the entire data pipeline should be designed to communicate data to the final audience (decision-makers) in order to generate value.
3. Data Storytelling
There are three ways to communicate data:
- Data reporting includes data description, with all the details of the data exploration and analysis phases.
- Data presentation selects only relevant data and shows them to the final audience in an organized and structured way.
- Data storytelling builds a story on data.
Let’s focus on data storytelling. Data Storytelling is communicating the results of a data analysis process to an audience through a story. Based on your audience, you will choose an appropriate
- Language and Tone: The set of words (language) and the emotional expression conveyed through them (tone)
- Context: The level of details to add to your story, based on the cultural sensitivity of the audience
Data Storytelling must consider the data and all the relevant information associated with data (context). Data context refers to the background information and pertinent details surrounding and describing a dataset. In data pipelines, this data context is stored as metadata [3]. Metadata should provide answers to the following:
- Who collected data
- What the data is about
- When the data was collected
- Where the data was collected
- Why the data was collected
- How the data was collected
3.1 The Importance of Metadata
Let’s revisit the data management pipeline from a data storytelling perspective, which includes data and metadata (context)
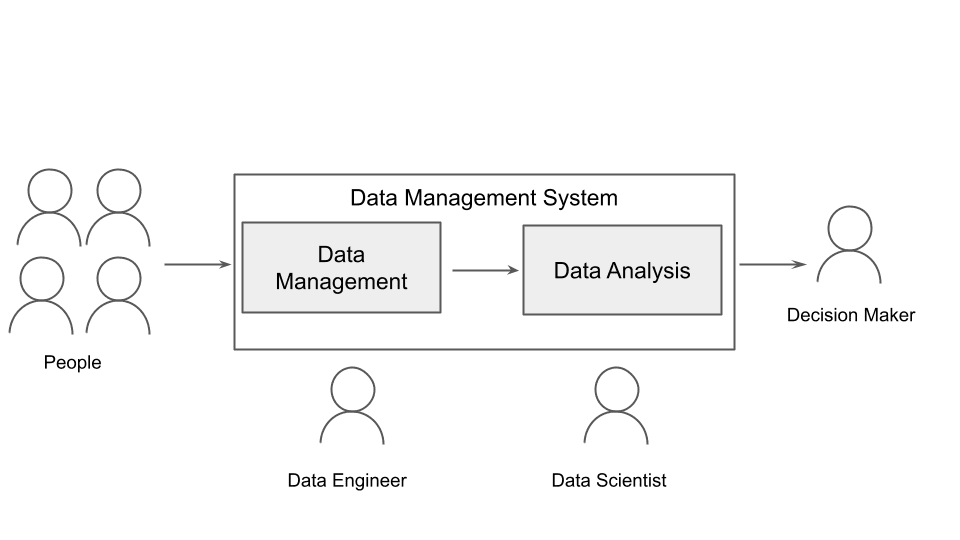
Fig. 6: The data management pipeline from the data storytelling perspective
The Data Management system comprises two elements: data management, where the main actor is the data engineer and data analysis, where the main actor is the data scientist.
The data engineer should focus not only on data but also on metadata, which helps the data scientist to build the context around data. There are two types of metadata management systems:
- Passive Metadata Management, which aggregates and stores metadata in a static data catalog (e.g., Apache Hive)
- Active Metadata Management, which provides dynamic and real-time metadata (e.g., Apache Atlas)
The data scientist should build the data-driven story.
4. Data Management and Data Storytelling
Combining Data Management and Data Storytelling means:
- Considering the final people who will benefit from the data. A Data Management system goes from people to people.
- Consider metadata, which helps build the most powerful stories.
If we look at the entire data pipeline from the desired outcome perspective, we discover the importance of the people behind each step. We can generate value from data only if we look at the people behind the data.
Summary
Congratulations! You have just learned how to look at Data Management from the Data Storytelling perspective. You should consider two aspects, in addition to data:
- People behind data
- Metadata, which gives context to your data.
And, beyond all, never forget people! Data storytelling helps you look at the stories behind the data!
References
[1] IBM. What is data management?
[2] The Cambridge Dictionary. Value.
[3] Peter Crocker. Guide to enhancing data context: who, what, when, where, why, and how
External resources
Using Data Storytelling to Turn Data into Value [talk]
Angelica Lo Duca (Medium) (@alod83) is a researcher at the Institute of Informatics and Telematics of the National Research Council (IIT-CNR) in Pisa, Italy. She is a professor of “Data Journalism” for the Master degree course in Digital Humanities at the University of Pisa. Her research interests include Data Science, Data Analysis, Text Analysis, Open Data, Web Applications, Data Engineering, and Data Journalism, applied to society, tourism, and cultural heritage. She is the author of the book Comet for Data Science, published by Packt Ltd., of the upcoming book Data Storytelling in Python Altair and Generative AI, published by Manning, and co-author of the upcoming book Learning and Operating Presto, by O’Reilly Media. Angelica is also an enthusiastic tech writer.
- SEO Powered Content & PR Distribution. Get Amplified Today.
- PlatoData.Network Vertical Generative Ai. Empower Yourself. Access Here.
- PlatoAiStream. Web3 Intelligence. Knowledge Amplified. Access Here.
- PlatoESG. Carbon, CleanTech, Energy, Environment, Solar, Waste Management. Access Here.
- PlatoHealth. Biotech and Clinical Trials Intelligence. Access Here.
- Source: https://www.kdnuggets.com/combining-data-management-and-data-storytelling-to-generate-value?utm_source=rss&utm_medium=rss&utm_campaign=combining-data-management-and-data-storytelling-to-generate-value

