Public health organizations have a wealth of data about different types of diseases, health trends, and risk factors. Their staff has long used statistical models and regression analyses to make important decisions such as targeting populations with the highest risk factors for a disease with therapeutics, or forecasting the progression of concerning outbreaks.
When public health threats emerge, data velocity increases, incoming datasets can grow larger, and data management becomes more challenging. This makes it more difficult to analyze data holistically and capture insights from it. And when time is of the essence, speed and agility in analyzing data and drawing insights from it are key blockers to forming rapid and robust health responses.
Typical questions public health organizations face during times of stress include:
- Will there be sufficient therapeutics in a certain location?
- What risk factors are driving health outcomes?
- Which populations have a higher risk of reinfection?
Because answering these questions requires understanding complex relationships between many different factors—often changing and dynamic—one powerful tool we have at our disposal is machine learning (ML), which can be deployed to analyze, predict, and solve these complex quantitative problems. We have increasingly seen ML applied to address difficult health-related problems such as classifying brain tumors with image analysis and predicting the need for mental health to deploy early intervention programs.
But what happens if public health organizations are in short supply of the skills required to apply ML to these questions? The application of ML to public health problems is impeded, and public health organizations lose the ability to apply powerful quantitative tools to address their challenges.
So how do we remove these bottlenecks? The answer is to democratize ML and allow a larger number of health professionals with deep domain expertise to use it and apply it to the questions they want to solve.
Amazon SageMaker Canvas is a no-code ML tool that empowers public health professionals such as epidemiologists, informaticians, and bio-statisticians to apply ML to their questions, without requiring a data science background or ML expertise. They can spend their time on the data, apply their domain expertise, quickly test hypothesis, and quantify insights. Canvas helps make public health more equitable by democratizing ML, allowing health experts to evaluate large datasets and empowering them with advanced insights using ML.
In this post, we show how public health experts can forecast on-hand demand for a certain therapeutic for the next 30 days using Canvas. Canvas provides you with a visual interface that allows you to generate accurate ML predictions on your own without requiring any ML experience or having to write a single line of code.
Solution overview
Let’s say we are working on data that we collected from states across the US. We may form a hypothesis that a certain municipality or location doesn’t have enough therapeutics in the coming weeks. How can we test this quickly and with a high degree of accuracy?
For this post, we use a publicly available dataset from the US Department of Health and Human Services, which contains state-aggregated time series data related to COVID-19, including hospital utilization, availability of certain therapeutics, and much more. The dataset (COVID-19 Reported Patient Impact and Hospital Capacity by State Timeseries (RAW)) is downloadable from healthdata.gov, and has 135 columns and over 60,000 rows. The dataset is updated periodically.
In the following sections, we demonstrate how to perform exploratory data analysis and preparation, build the ML forecasting model, and generate predictions using Canvas.
Perform exploratory data analysis and preparation
When doing a time series forecast in Canvas, we need to reduce the number of features or columns according to the service quotas. Initially, we reduce the number of columns to the 12 that are likely to be the most relevant. For example, we dropped the age-specific columns because we’re looking to forecast total demand. We also dropped columns whose data was similar to other columns we kept. In future iterations, it is reasonable to experiment with retaining other columns and using feature explainability in Canvas to quantify the importance of these features and which we want to keep. We also rename the state column to location.
Looking at the dataset, we also decide to remove all the rows for 2020, because there were limited therapeutics available at that time. This allows us to reduce the noise and improve the quality of the data for the ML model to learn from.
Reducing the number of columns can be done in different ways. You can edit the dataset in a spreadsheet, or directly inside Canvas using the user interface.
You can import data into Canvas from various sources, including from local files from your computer, Amazon Simple Storage Service (Amazon S3) buckets, Amazon Athena, Snowflake (see Prepare training and validation dataset for facies classification using Snowflake integration and train using Amazon SageMaker Canvas), and over 40 additional data sources.
After our data has been imported, we can explore and visualize our data to get additional insights into it, such as with scatterplots or bar charts. We also look at the correlation between different features to ensure that we have selected what we think are the best ones. The following screenshot shows an example visualization.

Build the ML forecasting model
Now we’re ready to create our model, which we can do with just a few clicks. We choose the column identifying on-hand therapeutics as our target. Canvas automatically identifies our problem as a time series forecast based on the target column we just selected, and we can configure the parameters needed.
We configure the item_id, the unique identifier, as location because our dataset is provided by location (US states). Because we’re creating a time series forecast, we need to select a time stamp, which is date in our dataset. Finally, we specify how many days into the future we want to forecast (for this example, we choose 30 days). Canvas also offers the ability to include a holiday schedule to improve accuracy. In this case, we use US holidays because this is a US-based dataset.
With Canvas, you can get insights from your data before you build a model by choosing Preview model. This saves you time and cost by not building a model if the results are unlikely to be satisfactory. By previewing our model, we realize that the impact of some columns is low, meaning the expected value of the column to the model is low. We remove columns by deselecting them in Canvas (red arrows in the following screenshot) and see an improvement in an estimated quality metric (green arrow).

Moving on to building our model, we have two options, Quick build and Standard build. Quick build produces a trained model in less than 20 minutes, prioritizing speed over accuracy. This is great for experimentation, and is a more thorough model than the preview model. Standard build produces a trained model in under 4 hours, prioritizing accuracy over latency, iterating through a number of model configurations to automatically select the best model.
First, we experiment with Quick build to validate our model preview. Then, because we’re happy with the model, we choose Standard build to have Canvas help build the best possible model for our dataset. If the Quick build model had produced unsatisfactory results, then we would go back and adjust the input data to capture a higher level of accuracy. We could accomplish this by, for instance, adding or removing columns or rows in our original dataset. The Quick build model supports rapid experimentation without having to rely on scarce data science resources or wait for a full model to be completed.
Generate predictions
Now that the model has been built, we can predict the availability of therapeutics by location. Let’s look at what our estimated on-hand inventory looks like for the next 30 days, in this case for Washington, DC.
Canvas outputs probabilistic forecasts for therapeutic demand, allowing us to understand both the median value as well as upper and lower bounds. In the following screenshot, you can see the tail end of the historical data (the data from the original dataset). You can then see three new lines: the median (50th quantile) forecast in purple, the lower bound (10th quantile) in light blue, and upper bound (90th quantile) in dark blue.
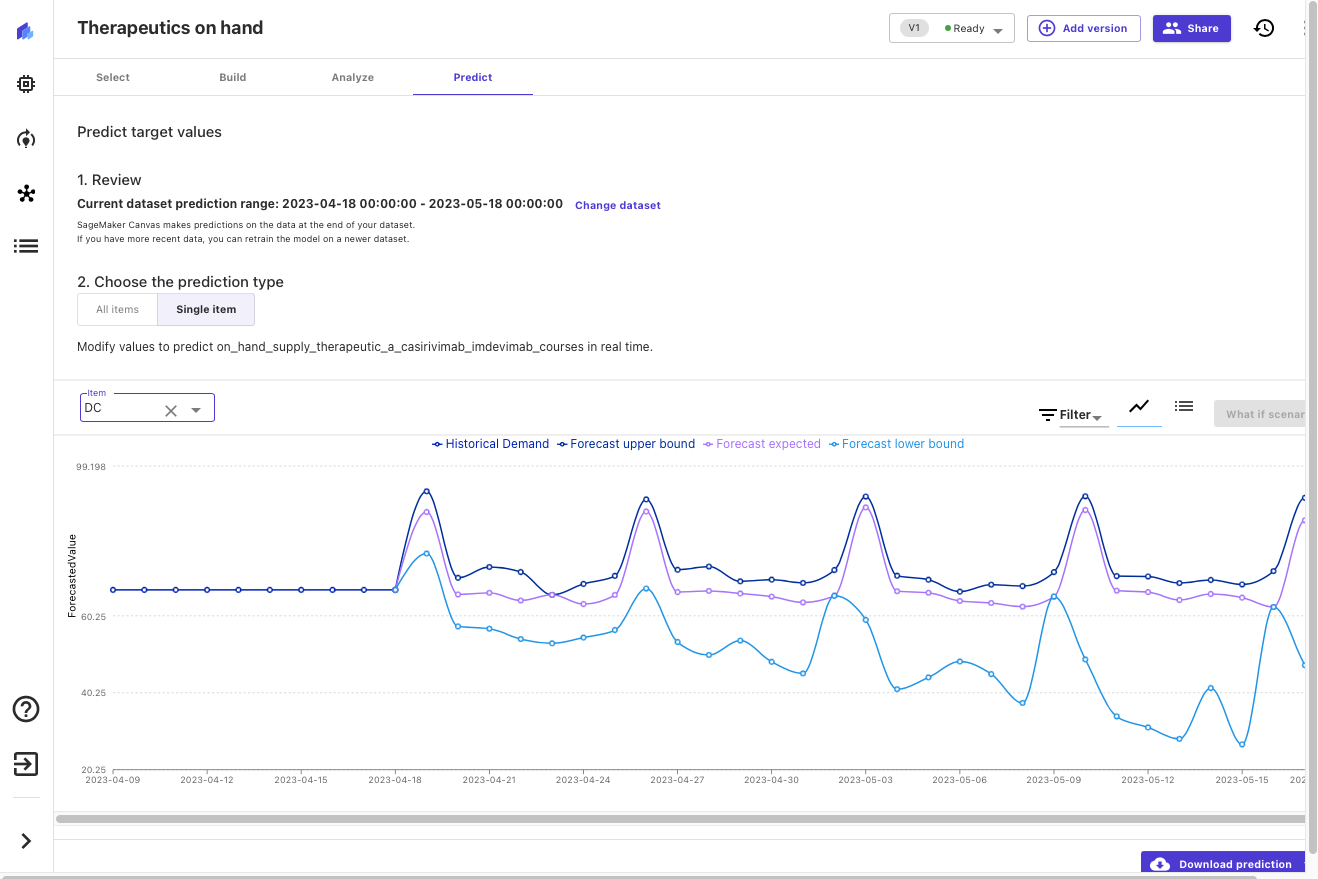
Examining upper and lower bounds provides insight into the probability distribution of the forecast and allows us to make informed decisions about desired levels of local inventory for this therapeutic. We can add this insight to other data (for example, disease progression forecasts, or therapeutic efficacy and uptake) to make informed decisions about future orders and inventory levels.
Conclusion
No-code ML tools empower public health experts to quickly and effectively apply ML to public health threats. This democratization of ML makes public health organizations more agile and more efficient in their mission of protecting public health. Ad hoc analyses that can identify important trends or inflection points in public health concerns can now be performed directly by specialists, without having to compete for limited ML expert resources and slowing down response times and decision-making.
In this post, we showed how someone without any knowledge of ML can use Canvas to forecast the on-hand inventory of a certain therapeutic. This analysis can be performed by any analyst in the field, through the power of cloud technologies and no-code ML. Doing so distributes capabilities broadly and allows public health agencies to be more responsive, and to more efficiently use centralized and field office resources to deliver better public health outcomes.
What are some of the questions you might be asking, and how may low-code/no-code tools be able to help you answer them? If you are interested in learning more about Canvas, refer to Amazon SageMaker Canvas and start applying ML to your own quantitative health questions.
About the authors
 Henrik Balle is a Sr. Solutions Architect at AWS supporting the US Public Sector. He works closely with customers on a range of topics from machine learning to security and governance at scale. In his spare time, he loves road biking, motorcycling, or you might find him working on yet another home improvement project.
 Dan Sinnreich leads Go to Market product management for Amazon SageMaker Canvas and Amazon Forecast. He is focused on democratizing low-code/no-code machine learning and applying it to improve business outcomes. Previous to AWS Dan built enterprise SaaS platforms and time-series risk models used by institutional investors to manage risk and construct portfolios. Outside of work, he can be found playing hockey, scuba diving, traveling, and reading science fiction.
- SEO Powered Content & PR Distribution. Get Amplified Today.
- PlatoData.Network Vertical Generative Ai. Empower Yourself. Access Here.
- PlatoAiStream. Web3 Intelligence. Knowledge Amplified. Access Here.
- PlatoESG. Automotive / EVs, Carbon, CleanTech, Energy, Environment, Solar, Waste Management. Access Here.
- BlockOffsets. Modernizing Environmental Offset Ownership. Access Here.
- Source: https://aws.amazon.com/blogs/machine-learning/capture-public-health-insights-more-quickly-with-no-code-machine-learning-using-amazon-sagemaker-canvas/

