ATF3 is rapidly and transiently induced during SC early activation
To explore the transcriptional regulatory events governing the SC quiescence-to-activation transition, we re-analyzed our previously published transcriptomic profiling datasets36 acquired from SCs in the lineage progression. Briefly, muscles from Pax7-nGFP mice37 were fixed in situ by PFA before subjecting to the standard 3 h long cell dissociation and isolation process, and FACS sorting to obtain QSCs13, or without prior fixation to obtain freshly isolated early activating SCs (FISC) (Fig. 1a and Supplementary Fig. 1a); FISCs were cultured in vitro for 24, 48 or 72 h to obtain fully activated (ASC-24h), proliferating (ASC-48h) or differentiating (DSC-72h) cells. Consistent with the findings from other recent reports38,39,40, AP-1 family genes including Fos, Atf, Jun and Maf sub-families were dramatically induced in FISCs compared to QSCs (Fig. 1b). Notably, Atf3 was sharply induced (42.4 fold) in FISCs but was then rapidly decreased at ACS-24h (Fig. 1c, d); this was also confirmed by RT-qPCR (Fig. 1e), indicating that it is a rapid and transient responsive gene to early activation induced by the isolation. Furthermore, immunofluorescence (IF) staining demonstrated the concomitant induction of ATF3 protein in FISCs and a decrease in ASCs (Fig. 1f). Even on the freshly isolated single myofiber that is believed to preserve the quiescent niche to some extent and minimize SC activation41,42, the associated SCs displayed high expression level of ATF3 protein immediately after 2 h isolation which diminished at 24 h in culture (Fig. 1g), reinforcing the notion that ATF3 is rapidly induced in early activated SCs. To further confirm the ATF3 induction in vivo, BaCl2 was injected into the Tibialis Anterior (TA) muscles of C57BL/6 mice to induce acute muscle damage. In this injury model36,43,44, tissue degeneration with abundant immune cell infiltrates is normally observed at 1 day post injury (dpi); SCs are rapidly activated to expand as proliferating myoblasts which then fuse to form small new myofibers expressing embryonic myosin heavy chain (eMyHC) and characterized by centrally localized nuclei (CLN); these eMyHC+ fibers are readily seen at 5 dpi. At 7dpi, the muscle is mainly composed of larger regenerated myofibers with down-regulated eMyHC expression; muscle damage and inflammatory cells are largely cleared at 14 dpi while the regenerated myofibers continue to grow in size and mature to achieve full regeneration around 30 dpi. As expected, ATF3 protein was not detected on uninjured TA muscles by IF but readily seen at 1dpi; some staining did not merge with Pax7+ cells, which is in line with its reported ubiquitous induction in multiple cells after injury45. At 2dpi ATF3 expression in Pax7+ cells was highly increased, concomitant with the full activation of SCs at this stage (Fig. 1h). Several other AP-1 family members, Atf4, Fos, FosB, and JunB, shared a similar dynamic expression profile (Fig. 1b–d), which was also confirmed by RT-qPCR (Supplementary Fig. 1b) and immunofluorescent staining (Supplementary Fig. 1c) results. Taken together, our findings show that ATF3 and several other AP-1 family members are rapidly and transiently induced during early SC activation, suggesting their potential roles in the regulation of SC early activation.
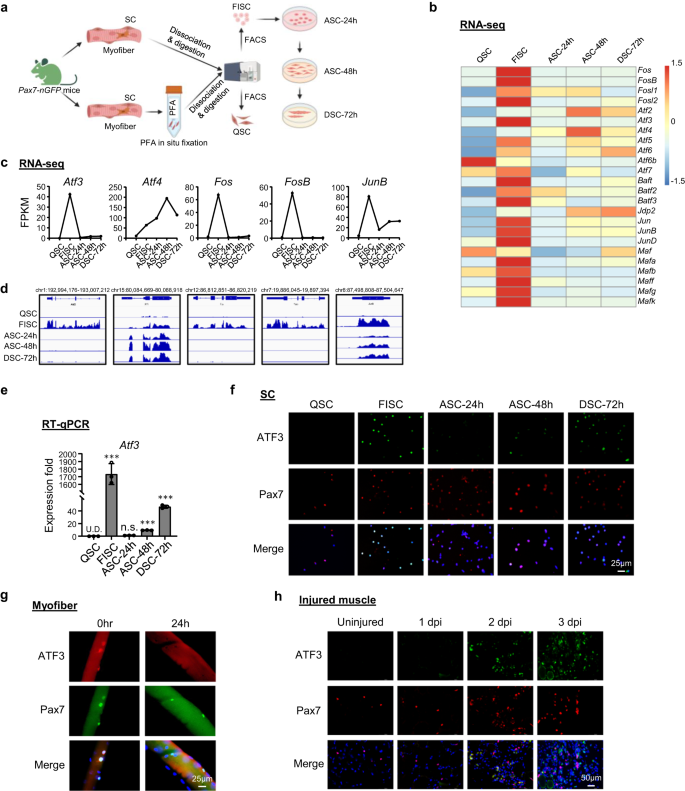
a Schematic for isolation of quiescent satellite cells (QSC) after in situ fixation, freshly isolated SCs (FISC) without prior fixation from muscles of Tg: Pax7-nGFP mice. FISCs were subsequently cultured and activated for 24 (ASC-24h), 48 (ASC-48h), or 72 h (DSC-72h). RNAs were extracted for RNA-Seq analysis. Created with BioRender.com. b Heat maps indicating gene expression levels (Log2[FPKM]) of AP-1 family TFs detected by the RNA-Seq. c, d Expression levels (FPKM) and genomic snapshots of Atf3, Atf4, Fos, FosB, JunB mRNAs from the above RNA-Seq. e RT-qPCR detection of Atf3 in the above cells. n = 3 mice per group. p = 0.000025, 0.12, 0.0000011 and 0.0000052. f Immunofluorescence (IF) staining of ATF3 and Pax7 proteins on the above cells. Scale bar: 50 μm. g IF staining of ATF3 and Pax7 proteins on single myofibers from EDL muscles immediately after isolation or cultured for 24 h. Scale bar: 25 μm. h IF staining of ATF3 and Pax7 protein on TA muscle sections from uninjured mice or 1, 2 and 3 dpi. Scale bar: 50 μm. All the bar graphs are presented as mean ± SD. Student’s t test (two-tailed unpaired) was used to calculate the statistical significance (e): *p < 0.05, **p < 0.01, ***p < 0.001. n.s. no significance. Source data are provided as a Source Data file.
Short-term Atf3 deletion accelerates acute injury-induced muscle regeneration
To facilitate the dissection of ATF3 function in SCs, we crossed the Atf3flox allele46, in which two LoxP sites were inserted onto Atf3 exon2, with Pax7CreERT2/CreERT2-R26RYFP/YFP mouse43 to generate control (Ctrl) (Atf3+/+– Pax7CreERT2/CreERT2-R26RYFP/YFP) and inducible knockout mice of Atf3 (Atf3 iKO) (Atf3 flox/flox– Pax7CreERT2/CreERT2-R26RYFP/YFP) (Supplementary Fig. 2a). After consecutive 5 days of intraperitoneal (IP) injection of Tamoxifen (TMX) (Fig. 2a), successful deletion of ATF3 in FISCs was confirmed by WB (Supplementary Fig. 2b) or IF (Supplementary Fig. 2c); its depletion was further confirmed by IF staining of SCs on single myofibers (Supplementary Fig. 2d). Morphologically, the 2-month-old iKO showed no apparent difference from the Ctrl littermate mice; no changes in body size and weight were detected either (Supplementary Fig. 2e).
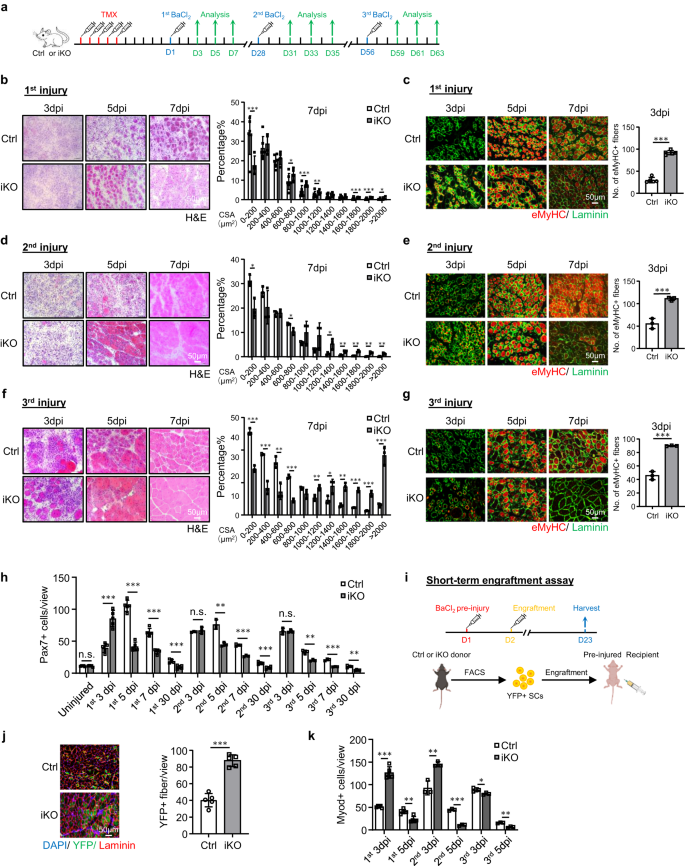
a Schematic of the experimental design. b H&E staining of TA muscles collected at 3, 5 and 7 days post the 1st round injury (dpi). Scale bar: 50 μm. Cross-sectional areas (CSAs) of newly formed fibers were quantified from the TA muscles at 7 dpi. p = 0.000066, 0.018, 0.00069, 0.0087, 0.00082, 0.00047 and 0.046. c IF staining of eMyHC (red) and Laminin (green) was performed on the above TA muscles. Scale bar: 50 μm. p = 0.00000011. d, e H&E and eMyHC staining of the TA muscles post the 2nd round injury. Scale bar: 50 μm. p = 0.012, 0.019, 0.033, 0.0057, 0.0022, 0.0022 and 0.0093 (d); p = 0.00021 (e). f, g H&E and eMyHC staining of the TA muscles post the 3rd round injury. Scale bar: 50 μm. p = 0.00015, 0.00087, 0.0063, 0.000074, 0.0089, 0.035, 0.0014, 0.00011, 0.00042 and 0.00071 (f); p = 0.000023 (g). h Pax7+ SCs per view were quantified on Ctrl and iKO TA muscles on uninjured or post the 3 rounds of injury. p = 0.96, 0.00011, 0.0000013, 0.000014, 0.00066, 0.45, 0.0023, 0.00017, 0.00032, 0.95, 0.0022, 0.00019 and 0.0012. i Schematic for engraftment assay. Created with BioRender.com. j IF staining of YFP (green) and Laminin (red) on the TA muscles 21 days after engraftment. Scale bar: 50 μm. n = 5 mice per group. p = 0.0000091. k Quantification of Myod+ SCs per view on Ctrl and iKO TA muscles post the 3 rounds of injury. p = 0.0000012, 0.0013, 0.0054, 0.000028, 0.041 and 0.0012. n = 5 mice per group for 3, 5, 7 days post the 1st injury and 30 days post the 1st, 2nd and 3rd injury and engraftment assay; n = 3 mice per group for 3, 5, 7 days post 2nd and 3rd injury. All the bar graphs are presented as mean ± SD, Student’s t test (two-tailed unpaired) was used to calculate the statistical significance (b–h, j, k): *p < 0.05, **p < 0.01, ***p < 0.001. n.s. no significance. Source data are provided as a Source Data file.
Considering the rapid induction of ATF3 during early SC activation, we reasoned that its loss might impact SC-mediated muscle regeneration. To test this notion, BaCl2 was injected into the TA muscles of Ctrl or iKO mice to induce acute muscle damage 5 days after TMX deletion (Fig. 2a). By examining the above injured TA muscles at 3, 5, 7 and 30 dpi (Fig. 2a), the iKO muscles displayed a highly accelerated rate of regeneration. By H&E staining (Fig. 2b), at 5 dpi, regenerating fibers with CLNs were already present in the iKO but not the Ctrl muscles. At 7 dpi the damaged muscle was nearly repaired with homogenous fibers and no sign of immune cells in the iKO and the fiber size was also significantly larger compared to the Ctrl (the quantification on the right). These experimental observations were further supported by IF staining of eMyHC (Fig. 2c); eMyHC+ fibers were readily observed in the iKO even at 3 dpi (91.64 in iKO vs. 29.86 in Ctrl) but sharply decreased by 7 dpi. Consistently, the number of Pax7+ cells at 3 dpi was significantly higher in iKO vs. Ctrl but lower at 5 dpi and 7 dpi (Fig. 2h and Supplementary Fig. 2f). In addition, the TA muscles collected from the iKO mice at 30 dpi had increased muscle weight compared to the Ctrl (43.7 vs. 48.4 mg) (Supplementary Fig. 2g) and enlarged muscle fiber size (1137.4 vs. 862.8 μm2) (Supplementary Fig. 2h), reflecting the enhanced repair.
Surprisingly, the enhanced regenerative ability of Atf3 iKO SCs persisted after one more round of BaCl2-induced acute injury given one month later (Fig. 2a). As shown in Fig. 2d, e, the accelerated regeneration remained equally strong based on the increased fiber size at 7 dpi and the number of eMyHC+ fibers at 3 dpi after the 2nd injury. At 30 dpi the iKO muscle also showed increased muscle weight compared to the Ctrl (61.7 vs. 55.8 mg) (Supplementary Fig. 2i) and slightly enlarged muscle fiber size (1724.8 vs. 1633.8 μm2) (Supplementary Fig. 2j). The 3rd round of injury was then given (Fig. 2a) and the expedited repair was still evident (Fig. 2f, g), as the number of eMyHC+ fibers at 3 dpi was still higher in the iKO vs. Ctrl muscles (89.9 vs. 45.7) (Fig. 2g) and a higher number of larger fibers was observed at 7 dpi (Fig. 2f). However, despite slightly increased TA muscle weight in the iKO compared to the Ctrl 30 day post-3rd injury (Supplementary Fig. 2k), there was no significant difference in the average muscle fiber size (Supplementary Fig. 2l), suggesting that the accelerated regeneration in the iKO muscle eventually disappeared after the 3rd injury.
The engraftment assay was then conducted to further validate the enhanced regenerative ability of the iKO SCs. As illustrated in Fig. 2i, 21 days after YFP+ SCs from the Ctrl or iKO mice were injected into the pre-injured TA muscles of receptor nude mice, the TA muscles were collected to evaluate donor cells’ regenerative ability based on YFP expression. Indeed, we observed a higher number of YFP+ myofibers in the receptor mice transplanted with the iKO vs. Ctrl SCs (Fig. 2j). Altogether, our results demonstrate that Atf3 deletion enhances acute injury-induced muscle regeneration.
Atf3 deletion provokes premature SC activation and pseudo-regeneration in homeostatic muscle
To dissect the underlying cause for the improved regenerative capacity upon ATF3 loss, we speculated that the iKO SCs underwent rapid activation upon BaCl2 injury. Indeed, when plotting the dynamics of MyoD+ SCs along the course of the three rounds of injury/regeneration. a much higher number of MyoD+ cells were detected at 3 dpi (Fig. 2k and Supplementary Fig. 2m), but the cell number quickly declined at 5 dpi. Such phenomenon existed during the first two rounds of injuries but disappeared in the third round (Fig. 2k and Supplementary Fig. 2m). Compared to the Ctrl, the faster activation of iKO cells upon acute injury implies the quicker transition from quiescence to activation. Indeed, FISCs from the Atf3-iKO mice displayed a strikingly increased propensity for cell cycle entry based on EdU incorporation 24 h after culture (~23% increase) (Fig. 3a). In addition, Pax7+MyoD+ cells in the iKO exhibited 10% increase compared to the Ctrl 24 h after culture (Fig. 3b). Furthermore, the FISCs from the iKO muscles were also slightly larger in size than the Ctrl ones (86.1 vs. 72.9) (Fig. 3c). Consistently, isolated single myofibers from the iKO muscles had significantly higher EdU incorporation (14% increase) than the Ctrl ones 36 h after culture (Fig. 3d), reinforcing the faster cell cycle entry of the iKO SCs. The iKO SCs on freshly isolated single myofibers also produced 1.90-fold and 2.08-fold more Pax7+MyoD+ cells than those Ctrl SCs without culturing or with 3 h (Fig. 3e, f). Altogether, these results indicate that the loss of ATF3 results in the release from quiescence and thus rapid SC activation without acute injury.
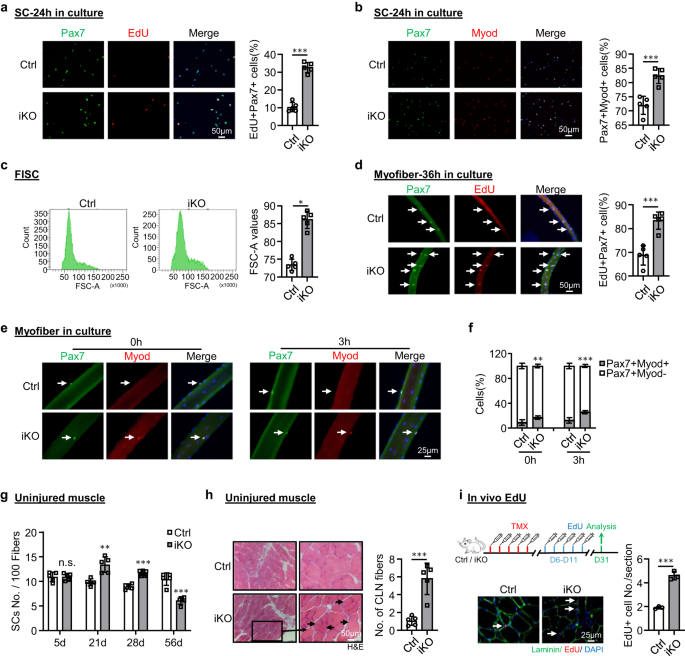
a SCs from Ctrl or iKO mice were cultured for 24 h and treated with EdU for 6 h before staining for EdU (red) and Pax7 (green). Scale bar: 50 μm. p = 0.0000014. b IF staining of Pax7 (green) and MyoD (red) on the above SCs cultured for 24 h. Scale bar: 50 μm. p = 0.00050. c Representative FACS plots showing the size of FISCs sorted from Ctrl or iKO muscles. p = 0.050. d Freshly isolated myofibers from Ctrl or iKO mice were cultured for 36 h and treated with EdU for 6 h before staining for EdU (red) and Pax7 (green). Scale bar: 50 μm. p = 0.00034. e IF staining of Pax7 (green) and MyoD (red) on the above myofibers immediately after isolation or cultured for 3 h. Scale bar: 25 μm. f Quantification of the percentage of Myod-Pax7+ and Myod+Pax7+ SCs. p = 0.0098 and 0.00035. g Quantification of the numbers of Pax7+ SCs per 100 fibers on uninjured Ctrl or iKO muscles 5, 21, 28 and 56 days after TMX injection. p = 0.96, 0.0018, 0.000049 and 0.00018. h H&E staining of the above uninjured muscles 56 days after TMX injection. Scale bar: 50 μm. p = 0.00043. i Upper: Schematic outline of the in vivo EdU assay performed on uninjured Ctrl or iKO muscle; EdU was injected by IP 5 days after TMX. The muscles were collected 21 days later. Lower IF staining of EdU (red) and Laminin (green). Scale bar: 25 μm. p = 0.00024. n = 5 mice per group (a–h); n = 3 mice per group (i). All the bar graphs are presented as mean ± SD, Student’s t test (two-tailed unpaired) was used to calculate the statistical significance (a–d, f–i): *p < 0.05, **p < 0.01, ***p < 0.001. n.s. no significance. Source data are provided as a Source Data file.
The enhanced regenerative ability of iKO SCs prompted us to further test if the ATF3 loss may lead to spontaneous activation and pseudo-regeneration in muscles without injury. Compared to the Ctrl, there was no increase of Pax7+ SCs in the iKO TA muscles at 5 days post-TMX injection but a significant increase of Pax7+ cells in the iKO TA muscles at 21 (13.4 vs. 9.58) and 28 days (11.7 vs. 8.9) (Figs. 3g and S3a), indicating the occurrence of spontaneous activation and expansion of iKO SCs in homeostatic muscles. Interestingly, by 56 days post-TMX injection, the number of Pax7+ cells in the iKO muscles finally declined compared to the Ctrl (Figs. 3g and S3a); this was accompanied by readily seen CLN+ fibers (Fig. 3h), indicating the fusion of the activated SC-derived myoblasts to existing fibers, which is known as pseudo-regeneration47. To confirm these findings, we performed five doses of EdU injections at 5 days post-TMX injection to show that there were more EdU+ cells on the muscle sections of the iKO than the Ctrl at 21 days post-EdU injection (Fig. 3i). Similarly, with a single dose of EdU administrated, EdU+ cells were only detected on the isolated iKO myofibers or TA muscles 12 h later but not on the Ctrl ones (Supplementary Fig. 3b). Altogether, these results suggest that Atf3 deletion provokes the precocious activation of SCs in homeostatic muscles thus ATF3 may function to actively suppress SC activation. This was further strengthened by overexpressing ATF3 in FISCs by a lentivirus (Supplementary Fig. 3c); it significantly inhibited SC activation (Fig. 4a, 20.9% reduction of Pax7+MyoD+ cells and Fig. 4b, 21.3% reduction of EdU+ cells). Moreover, overexpressing ATF3 in vivo by intramuscular injection of the lentivirus particles at 1 dpi (Fig. 4c) delayed the regeneration in Ctrl mice and also blunted the accelerated regeneration in iKO mice (Figs. 4d–h and S3d, e).
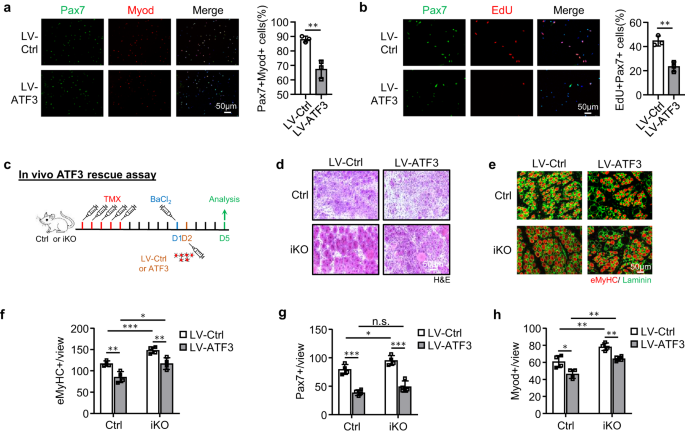
a FISCs from Ctrl or iKO mice were infected with ATF3-overexpressing lentiviruses and stained for Pax7 (green) and Myod (red) after 48 h. Scale bar: 50 μm. p = 0.0050. b EdU assay was performed and EdU+ cells were quantified. Scale bar: 50 μm. p = 0.0031. c Schematic for overexpressing ATF3 in vivo. ATF3 expressing lentiviruses were injected into Ctrl or iKO TA muscles 1 day after BaCl2 injury. The muscles were collected 5 days after infection for analysis. d H&E staining of the above TA muscles. Scale bar: 50 μm. e IF staining of eMyHC (red) and Laminin (green) was performed on the above TA muscles. Scale bar: 50 μm. f The numbers of eMyHC+ fibers per view were quantified. p = 0.0044, 0.00081, 0.015 and 0.0072. g The numbers of Pax7+ cells per view on the above TA muscles were quantified. p = 0.00018, 0.041, 0.098 and 0.00040. h The numbers of Myod+ cells per view on the above TA muscles were quantified. p = 0.016, 0.0058, 0.0010 and 0.0019. n = 3 mice per group (a, b); n = 4 mice per group (d–h). All the bar graphs are presented as mean ± SD. Student’s t test (two-tailed unpaired) was used to calculate the statistical significance (a, b, f–h): *p < 0.05, **p < 0.01, ***p < 0.001. n.s. no significance. Source data are provided as a Source Data file.
In addition, we observed there was 24% increase of MyoD+ MyoG+ differentiating cells in the isolated iKO muscle fibers compared to the Ctrl after 72 h culture (Supplementary Fig. 3f), suggesting that Atf3 deletion may accelerate SC progeny differentiation. This was confirmed by staining for MyoD and MyoG on SCs cultured for 72 h; 9% increase in the double positive cells was detected in the iKO vs. Ctrl (Supplementary Fig. 3g). Interestingly, there was also a slight decrease of Pax7+MyoD− cells in the iKO muscle fibers compared to the Ctrl (10.13% vs. 8.48%) (Supplementary Fig. 3h), suggesting that Atf3 loss may also lead to impaired self-renewal. Consistently, we also noticed a progressive decline in SC number after each round of injury (Fig. 2h and Supplementary Fig. 2f).
Long-term Atf3 deficiency depletes SC pool and impairs muscle regeneration
Next, to test if long-term Atf3 deficiency causes SC exhaustion and impairs muscle regeneration, we induced muscle injury by BaCl2 administration 30 days or 120 days after deleting Atf3 from SCs and examined the injured TA muscles at 3, 5 and 7 dpi (Fig. 5a). Thirty days after the deletion, the muscle regeneration (based on the muscle fiber size and the eMyHC+ fiber number) showed no significant changes compared to the Ctrl mice (Fig. 5b, c). The number of Pax7+ SC was also comparable at 3 and 7 dpi and only slightly lower in the iKO at 5 dpi (Fig. 5d and Supplementary Fig. 4a). In contrast, 120 days after the deletion, the muscle regeneration was obviously compromised in the iKO compared to the Ctrl mice. A significant increase of smaller fibers was observed at 7 dpi (Fig. 5e); the number of eMyHC+ fibers was much lower at 5 dpi but higher at 7 dpi (Fig. 5f); the number of Pax7+ SCs was also significantly reduced at both 3 and 7 dpi (Fig. 5g and Supplementary Fig. 4b). These results demonstrate that the long-term Atf3 deficiency is detrimental to regeneration by shrinking the SC pool. Interestingly, when the same number of YFP+ cells isolated from the Ctrl or iKO mice 4 months after TMX injection were used in the engraftment assay (Fig. 5h), a higher number of YFP+ myofibers were observed in the recipient nude mice transplanted with the iKO cells (59.28 vs. 31.72, Fig. 5i), suggesting that enhanced regenerative ability of the iKO cells persists after long term ATF3 loss and the impaired muscle regeneration indeed arises from the reduced cell pool.
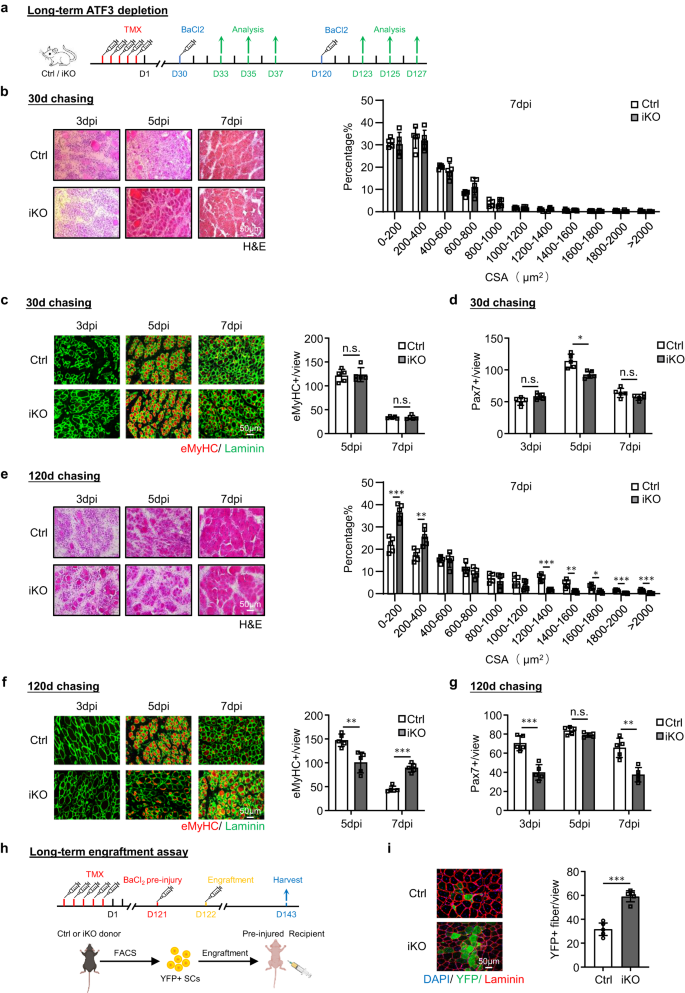
a Schematic outline of the experimental design for testing the effect of long-term Atf3 deletion on muscle regeneration process. 30 or 120 days chasing after TMX injection was given before BaCl2 injection. b Left: H&E staining of the TA muscles collected at 3, 5 and 7 dpi after the 30 days chasing period. Scale bar: 50 μm. n = 5 mice per group. Right: CSAs of newly formed fibers were quantified from the above-stained TA muscle at 7 dpi and the distribution is shown. n = 5 mice per group. c Left: IF staining of eMyHC (red) and Laminin (green) was performed on the above TA muscles. Scale bar: 50 μm. Right: Quantification of the numbers of eMyHC+ fibers per view at 5 and 7 dpi. n = 5 mice per group. p = 0.83 and 0.98. d Quantification of the numbers of Pax7+ SCs per view. n = 5 mice per group. p = 0.054, 0.0047 and 0.11. e–g The above assays/quantifications were performed on the Ctrl or iKO muscles collected at 3, 5 and 7 dpi after the 120 days chasing period. Scale bar: 50 μm. n = 5 mice per group. p = 0.00020, 0.0047, 0.000068, 0.0024, 0.013, 0.00019 and 0.00057 (e); p = 0.0034 and 0.000018 (f); p = 0.00031, 0.063 and 0.0010 (g). h Schematic for the engraftment assay. 120 days after TMX injection, FISCs from donor mice (Ctrl/ iKO) were injected into pre-injured recipient nude mice. TA muscles were collected 21 days after engraftment for analysis. Created with BioRender.com. i Left: IF staining of YFP (green) and Laminin (red) on the above TA muscles. Scale bar: 50 μm. Right: the numbers of YFP+ fibers per view were quantified. n = 5 mice per group. p = 0.000047. All the bar graphs are presented as mean ± SD. Student’s t test (two-tailed unpaired) was used to calculate the statistical significance (b–g, i): *p < 0.05, **p < 0.01, ***p < 0.001. n.s. no significance. Source data are provided as a Source Data file.
To further establish the importance of Atf3 in SC establishment and maintenance, we successfully deleted Atf3 in Pax7+ myogenic progenitors by crossing the Atf3flox allele with a non-inducible Pax7Cre-R26RYFP transgenic mouse strain48, in which the Cre recombinase is expressed in Pax7+ progenitor cells in as early as E9.5 (Supplementary Fig. 5a–c). Interestingly, the cKO muscles exhibited 84% increase of Pax7+ SCs compared to the Ctrl around 1 month after birth when SC pool was established49, but 79% decrease in two-month-old adult mice (Supplementary Fig. 5e), indicating that ATF3 is required for SC maintenance at adulthood but dispensable for SC establishment. A decreased TA muscle weight was detected in cKO at 1-month-old (29.42 mg vs. 34.88 mg, Supplementary Fig. 5f) but no significant difference in the body weight (12.66 mg vs. 12.42 mg, Supplementary Fig. 5d) and fiber size (861.96 μm2 vs. 848.71 μm2, Supplementary Fig. 5g), it is thus hard to conclude whether muscle hypertrophy occurs in the young cKO mice. Expectedly, when the adult SCs were isolated and cultured, cKO cells displayed a much higher propensity for activation assessed by both Pax7+Myod+ staining (Supplementary Fig. 5h, 23.8% increase in cKO vs. Ctrl) and EdU assay (Supplementary Fig. 5i, 99.9% increase). Correspondingly, the regenerative capacity after acute injury was evidently compromised in cKO muscles (Supplementary Fig. 5j–l). Therefore, the loss of ATF3 induces precocious SC activation and leads to the eventual reduction of the SC pool.
Atf3 deletion enhances SC activation during voluntary and endurance exercises
Short term and non-strenuous voluntary exercise (VE) fails to cause SC activation but endurance exercise (EE) activates SCs50,51,52,53,54. To further prove the function of ATF3 in preventing SC activation, we sought to determine if the ATF3 depletion influences the VE-induced SC activation. Immediately after five doses of TMX injection, Ctrl and iKO mice were subject to an established voluntary wheel running regime; the mice were provided with access to free rotating running wheels; a stable VE routine was reached within 7 days of training and continued for another 21 days long VE (Fig. 6a). The daily running distance was recorded and no significant difference was detected between Ctrl (14.38 km) vs. iKO (13.78 km) mice (Supplementary Fig. 6a, b).
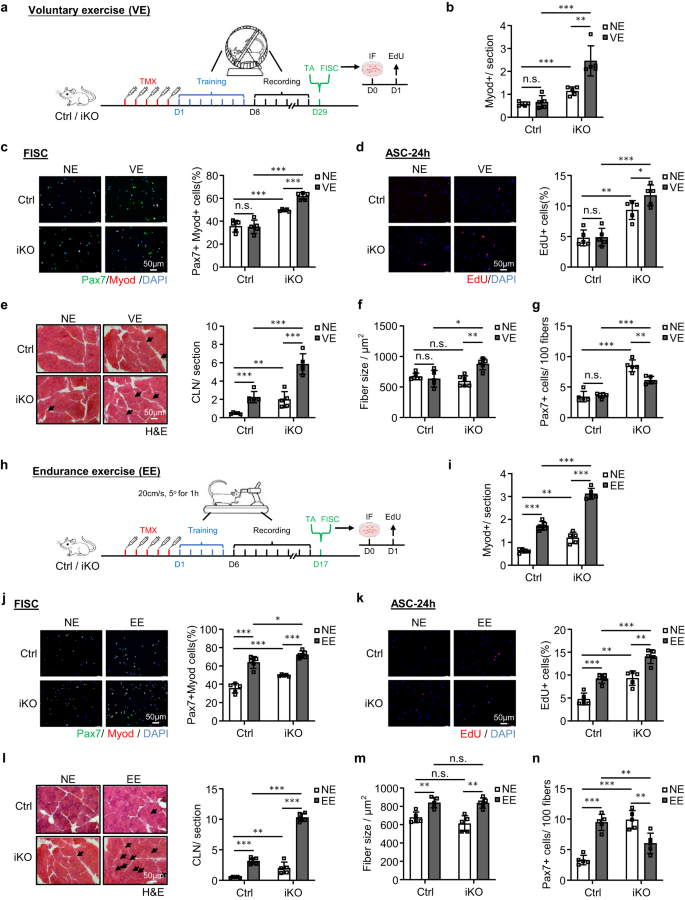
a Schematic of the experimental design for VE. b Quantification of Myod+ cells on the above TA muscles. p = 0.54, 0.00024, 0.00049 and 0.0024. c IF staining of Pax7 (green) and MyoD (red) on SCs isolated from the above mice and cultured for 24 h sorted. Scale bar: 50 μm. p = 0.91, 0.00035, 0.000018 and 0.000032. d EdU (red) was stained on SCs sorted from the above mice and cultured for 24 h. Scale bar: 50 μm. p = 0.90, 0.0010, 0.00013 and 0.046. e H&E staining of the above TA muscles. Scale bar: 50 μm. p = 0.00043, 0.0073, 0.00021 and 0.00047. f Fiber size of the above TA muscles (e). p = 0.54, 0.19, 0.012 and 0.0017. g Quantification of Pax7+ SCs on the above TA muscles. p = 0.66, 0.000023, 0.000052 and 0.0017. h Schematic of the experimental design (EE). i Quantification of Myod+ cells on the TA muscles collected from the above Ctrl and iKO mice with or without EE. p = 0.0000026, 0.0010, 0.0000073 and 0.0000015. j IF staining of Pax7 (green) and MyoD (red) on SCs sorted from the above mice and cultured for 24 h. Scale bar: 50 μm. p = 0.000062, 0.00035, 0.035 and 0.0000018. k EdU (red) was stained on SCs isolated from the above mice and cultured for 24 h. Scale bar: 50 μm. p = 0.00031, 0.0010, 0.00034 and 0.0012. l H&E staining of the above TA muscles. Scale bar: 50 μm. p = 0.0000039, 0.0073, 0.000000071 and 0.00000026. m Fiber size of the above TA muscles (l). p = 0.0022, 0.19, 0.91 and 0.0012. n Quantification of Pax7+ SCs per on the above TA muscles. p = 0.000018, 0.000024, 0.0067 and 0.0049. n = 5 mice per group (b–g, i–n). All the bar graphs are presented as mean ± SD. Student’s t test (two-tailed unpaired) was used to calculate the statistical significance (b–g, i–n): *p < 0.05, **p < 0.01, ***p < 0.001. n.s. no significance. Source data are provided as a Source Data file.
Expectedly, the expressions of AP-1 family members were induced by the VE in Ctrl SCs (Supplementary Fig. 6c). Also consistent with prior reports54, the VE did not induce SC activation in the Ctrl mice as no MyoD+ cells were detected on the muscle sections before and after the VE (Fig. 6b and Supplementary Fig. 6d); consistently, Pax7+MyoD+ staining of FISCs (Fig. 6c) or EdU staining of ASCs cultured for 24 h (Fig. 6d) did not reveal increased activation rate before and after the VE. In contrast, the iKO cells were readily activated by the VE (Fig. 6b–d and Supplementary Fig. 6d). Consistently, in the iKO muscles, we also detected a significantly increased number of CLN fibers (136% increase) (Fig. 6e) and evident hypertrophy (fiber size increased by 43.3%) after the VE (Fig. 6f). In the Ctrl muscles, the number of CLN was increased after the VE but not enough to cause hypertrophic growth (Fig. 6e, f). The above findings thus reinforce the notion that ATF3 loss induces rapid activation of SCs by the VE. As a result, there was reduced SC pool (38.2 % decrease of Pax7+ FISCs) at the end of the VE regime (Fig. 6g and Supplementary Fig. 6e).
Since EE is known to cause SC activation and muscle hypertrophy50,51,52,53, we next examined if the Atf3 deficiency affects the EE-induced SC activation. To this end, Ctrl and iKO mice were subject to a treadmill running regime55,56 in which the treadmill was set at a 5° incline and a speed of 20 cm/s for 60 min. After five doses of TMX injection, the mice were trained for a 5-day adaption period, then followed by a 10-day endurance training (+EE) or, as the control condition, without any training (NE) (Fig. 6h). As expected, the expressions of AP-1 family members were rapidly induced by the EE in SCs (Supplementary Fig. 6c). Furthermore, the EE caused evident SC activation in the Ctrl muscles, but the activation was much stronger in the iKO muscles (Fig. 6i–k and Supplementary Fig. 6f). Consistently, CLN fibers were induced in both Ctrl and iKO muscles after the EE; and a higher increase of CLN fibers was seen in the iKO compared to the Ctrl muscles (Fig. 6l). In addition, both Ctrl and iKO muscles showed hypertrophic growth after the EE but no difference was detected (Fig. 6m). At the end of the EE regime, the number of Pax7+ FISCs was significantly increased in the Ctrl but decreased in the iKO (Fig. 6n and Supplementary Fig. 6g), indicating the rapid exhaustion of the iKO SC pool. Altogether, these findings indicate that the loss of ATF3 provokes SC activation by VE and also enhances SC activation by EE.
ATF3 regulates H2B gene expression and nucleosome patterning
Altogether the above results suggest an essential role of ATF3 induction in preventing precocious SC activation, to illuminate the underlying molecular mechanism, we profiled the ATF3 transcriptional output by performing RNA-Seq in FISCs collected from the Ctrl and iKO muscles (Fig. 7a). A total of 1866 transcripts (red dots) (79.9%) were up-regulated in the iKO compared to the Ctrl, while 469 (blue dots) (20.1%) were down-regulated (Fig. 7b, Supplementary Fig. 7a and Supplementary Data 1), suggesting that the ATF3 loss induced global transcriptional activation. The GO analysis revealed that the up-regulated genes were enriched for “mitochondrion” “extracellular matrix”, etc. (Fig. 7c and Supplementary Data 1). Of note, elevated mitochondrial activity and extracellular matrix expression have previously been described in the GAlert cells10, suggesting that ATF3 functions to repress the expression of these activating genes, thus preventing premature SC activation. The down-regulated genes were interestingly enriched for “nucleosome” and “nucleosome assembly”, etc. (Fig. 7d and Supplementary Data 1). Notably, the genes encoding Histone proteins were highly represented among the down-regulated genes (Fig. 7e), which was also confirmed by RT-qPCR (19–46% decrease) (Supplementary Fig. 7b). Histone encoding genes are typically organized into multigene clusters and H2B protein is encoded by 2 gene clusters with 15 on Chr13 forming a Hist1h2b cluster and 2 on Chr3 forming a Hist2h2b cluster (Supplementary Fig. 7c). Remarkably, 13 out of the 17 H2b genes were down-regulated in the iKO SCs (Fig. 7e). Additionally, we also performed RNA-Seq on FISCs isolated from the Ctrl and Atf3-cKO mice and similar results were obtained (Supplementary Fig. 7d–g and Supplementary Data 3). These results demonstrate that the ATF3 loss decreases H2b gene expression.
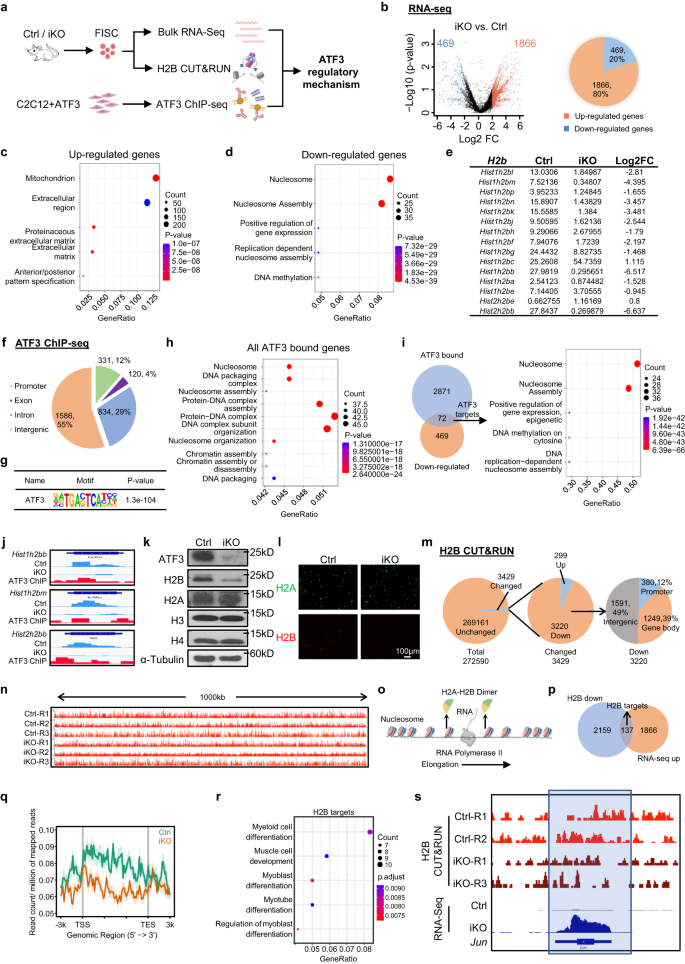
a Schematic of the experimental design. Created with BioRender.com. b DEGs were identified from the above Ctrl vs. iKO RNA-seq. c, d GO analysis of the above up and down-regulated genes. e FPKM and Log2FC of H2b genes in iKO vs. Ctrl. f Genomic distribution of 2871 ATF3 binding peaks. g Enrichment of canonical ATF3 motifs in the above binding regions. h GO analysis for all the above genes with ATF3 binding. i Left: Venn diagrams showing the overlapping (72 genes) between the above identified ChIP-Seq target (2871) and the down-regulated genes (469). Right: GO analysis of the above 72 genes revealed an extreme enrichment of histone-related terms. j Genomic snapshots of 3 of the above identified H2b genes with ATF3 binding in their TSSs (ChIP-Seq tracks) and down-regulated by ATF3 deletion (RNA-Seq tracks). k ATF3, H2A, H2B, H3 and H4 proteins were measured by western blot in FISC from Ctrl and iKO mice. α-Tubulin was used as a loading control. l IF staining of H2A (green) and H2B (red) on the above FISCs. Scale bar: 100 μm; n = 3 mice per group. m Pie charts showing the number of bins with H2B changed (3429, 299 up and 3220 down) and unchanged (269161) (left and middle), and the genomic distribution of down-regulated H2B signals (right). n Genomic snapshots of a 1000 kb region Integrative Genomics Viewer (IGV) track of H2B signal in Ctrl vs. iKO on Chr4. o Schematic of the RNA Polymerase II elongation process during DNA transcription. Created with BioRender.com. p Venn diagrams showing the overlapping (137 genes) between the above regions with down-regulated H2B CUT&RUN signals (2159) and the up-regulated genes (1866) from the above (A) RNA-Seq. q Metaplots showing average H2B CUT&RUN signals 3 kb up- to down-stream of TSS. r GO analysis of the above 252 genes from (P). s Genomic snapshots of Jun gene showing down-regulated H2B CUT&RUN signal and up-regulated RNA-Seq signal in iKO vs. Ctrl. Regions with H2B signal reduction in iKO vs. Ctrl are highlighted in blue frame. Source data are provided as a Source Data file.
Next, we performed ChIP-Seq on the C2C12 myoblasts with exogenous ATF3 over-expression as a surrogate system to define direct binding targets of ATF3 (Fig. 7a and Supplementary Fig. 7h). A total of 2871 binding peaks were identified in 869 genes with 60%, 28% and 9% located in intergenic regions, introns and promoters, respectively (Fig. 7f and Supplementary Data 2). These peaks were enriched for the known ATF3 binding motif, TGACTCA (Fig. 7g), attesting to the good data quality. GO analysis of these ATF3 bound genes indicated remarkable enrichment for the terms related to nucleosome (Fig. 7h and Supplementary Data 2). By integrating the RNA-Seq and ChIP-Seq results, 72 down-regulated genes contained ATF3 binding sites and again they were enriched for nucleosome related GO terms and many were histone genes (Fig. 7i and Supplementary Data 2). Notably, 8 of the 13 down-regulated H2b genes had ATF3 binding sites in their promoters (Fig. 7i, j, Supplementary Fig. 7i and Supplementary Data 2). Meanwhile, 112 up-regulated genes possessed ATF3 binding and were enriched for mitochondrion related GO terms (Supplementary Fig. 7j and Supplementary Data 2). The Western blot (Fig. 7k) and IF staining (Fig. 7l) results confirmed a substantial reduction or near loss of H2B protein in the iKO FISCs while other histone proteins such as H3, H4 and H2A remained unaltered. These results demonstrate that H2b genes are bona fide transcriptional targets of ATF3.
Global diminution of histones leads to decreased amount of nucleosomes, augmented nucleosome spacing, and alters nucleosome occupancy thus affecting transcription57,58,59, to determine if the H2B loss in the iKO SCs alters nucleosome positioning and occupancy, CUT&RUN assay60,61 was performed to map the genomic localization of H2B in Ctrl and iKO cells (Fig. 7a). A total of 272590 bins were defined genome-wide from the three replicates (Supplementary Data 4). Unexpectedly, the average H2B CUT&RUN signals were largely unaltered in the iKO vs. Ctrl with only 3429 bins (1.4%) showing changes (Fig. 7m, n). Nevertheless, 3220 out of the altered bins indeed showed decreased H2B enrichment in various genomic regions, including promoter (12%), gene body (39%) and intergenic regions (49%) (Fig. 7m). Since the nucleosome is partly dissembled through the removal of one H2A-H2B dimer to facilitate Pol II transcription61 (Fig. 7o), we hypothesized that the local loss of H2B could facilitate nucleosome destabilization to promote the transcription of associated genes. Indeed, by intersecting with RNA-Seq data, 137 up-regulated genes showed decreased H2B signals on their promoters or gene bodies (Fig. 7p, q and Supplementary Data 4). These H2B target genes were enriched for GO terms related to muscle differentiation and also included Id3, IGF-1 and Jun, etc. (Fig. 7r, s), which was consistent with the activation state of the iKO SCs11,62,63. Taken together, these findings demonstrate that the decreased H2B level could mediate the precocious SC activation following the ATF3 loss.
H2B mediates ATF3 function in SC activation and muscle regeneration
To solidify the functional link between ATF3 and H2B in SC activation and muscle regeneration, we found that overexpressing H2B by transfecting a pcDNA-H2B plasmid in FISCs indeed repressed the accelerated activation of Atf3 iKO cells but no impact on Ctrl cells (Fig. 8a, b). And in vivo, we also overexpressed H2B (Supplementary Fig. 7k) by intramuscular injection of lentiviral particles at 1dpi (Fig. 8a). As shown in Fig. 8c–g, this also restored the acute injury induced regeneration in the Atf3-iKO mice: a significantly lower number of eMyHC+ fibers were observed 5 dpi (Fig. 8d, e), which was accompanied by reduced numbers of Pax7+ cells (Fig. 8f) and MyoD+ cells (Fig. 8g). Altogether these findings validate that H2B loss mediates the precocious SC activation and enhanced muscle regeneration observed upon ATF3 loss.
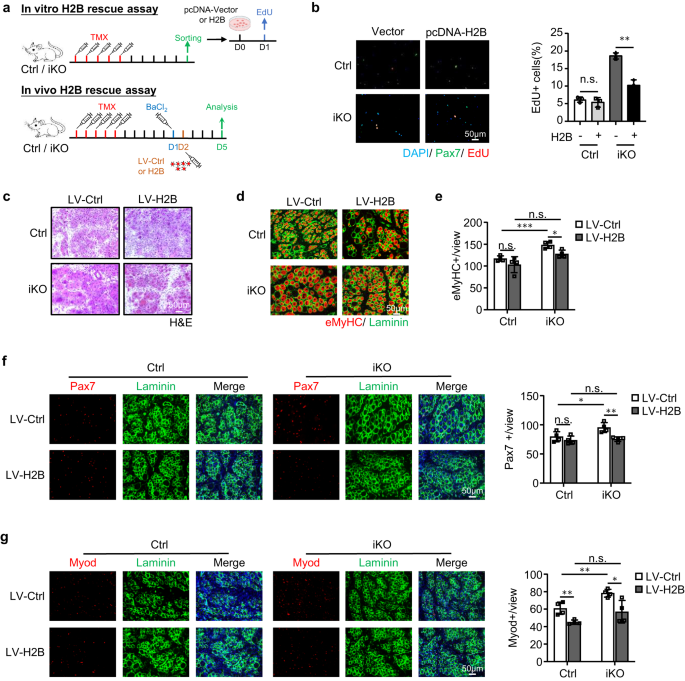
a Upper: Schematic for overexpressing H2B in vitro. FISCs from Ctrl or iKO mice were transfected with a control (Ctrl) or pCDNA-H2B plasmid and EdU assay was performed for assessing SC activation. Lower: Schematic for overexpressing H2B in vivo via lenti virus. H2B expressing lentivirus was injected into Ctrl or iKO TA muscles 1 day after BaCl2 injury and the muscles were collected 5 days after infection for analysis. b Left: The above transfected cells were cultured for 24 h before treated with EdU for 6 h; EdU positive cells were stained and quantified. Scale bar: 50 μm; n = 3 mice per group. p = 0.44 and 0.0013. c H&E staining of the above TA muscles collected at 5 dpi after infection. Scale bar: 50 μm. n = 4 mice per group. d IF staining of eMyHC (red) and Laminin (green) was performed on the above TA muscles. Scale bar: 50 μm. e The numbers of eMyHC+ fibers per view were quantified. n = 4 mice per group. From left to right, p = 0.20, 0.00081, 0.052 and 0.012. f Left: IF staining of Pax7 (red) and Laminin (green) was performed on the above TA muscles. Scale bar: 50 μm. Right: the numbers of Pax7+ cells per view were quantified. n = 4 mice per group. From left to right, p = 0.33, 0.041, 0.67 and 0.0052. g Left: IF staining of Myod (red) and Laminin (green) was performed on the above TA muscles. Scale bar: 50 μm. Right: the numbers of Myod+ cells per view were quantified. n = 4 mice per group. From left to right, p = 0.0053, 0.0058, 0.12 and 0.020. All the bar graphs are presented as mean ± SD. Student’s t test (two-tailed unpaired) was used to calculate the statistical significance (b, e–g): *p < 0.05, **p < 0.01, ***p < 0.001. n.s. no significance. Source data are provided as a Source Data file.
H2B loss increases DNA damage and senescence in Atf3 iKO SCs
To further elucidate the consequence of H2B loss in SCs, we examined genome instability and cellular senescence considering histone proteins are important for chromatin integrity and genome stability57,59. FISCs from iKO or Ctrl muscles were treated with various dosages (0, 1000 or 2000J) of UV light and comet assay was performed. Indeed, a substantial increase in the comet tail length was observed under all three dosages in the iKO as compared to the Ctrl (Fig. 9a), suggesting that H2B decrease causes genomic instability. This was further confirmed by a much higher percentage of γH2AX+ cells in the cultured iKO cells compared to the Ctrl (Fig. 9b, c). To examine if the genomic instability leads to cellular senescence, cells were cultured in growth medium for 9 days and β-Gal staining was performed; a 19% increase of β-Gal+ cells was detected in the iKO compared to the Ctrl (Fig. 9d). Consistently, a significant up-regulation of p16, p21, and p53 mRNAs (Fig. 9e) and a higher level of p21 and p53 proteins were also detected in the iKO (Fig. 9f). Altogether, the above findings demonstrate that H2B loss leads to increased genome instability and cellular senescence in the Atf3 iKO cells. Expectedly, H2B over-expression in the iKO cells reduced the DNA damage accumulation and inhibited cellular senescence as assessed by decreased p21 protein (Fig. 9g) as well as p16, p21 and p53 mRNAs (Fig. 9h). These results indicate that the decreased H2B expression causes SCs to undergo replicative senescence.
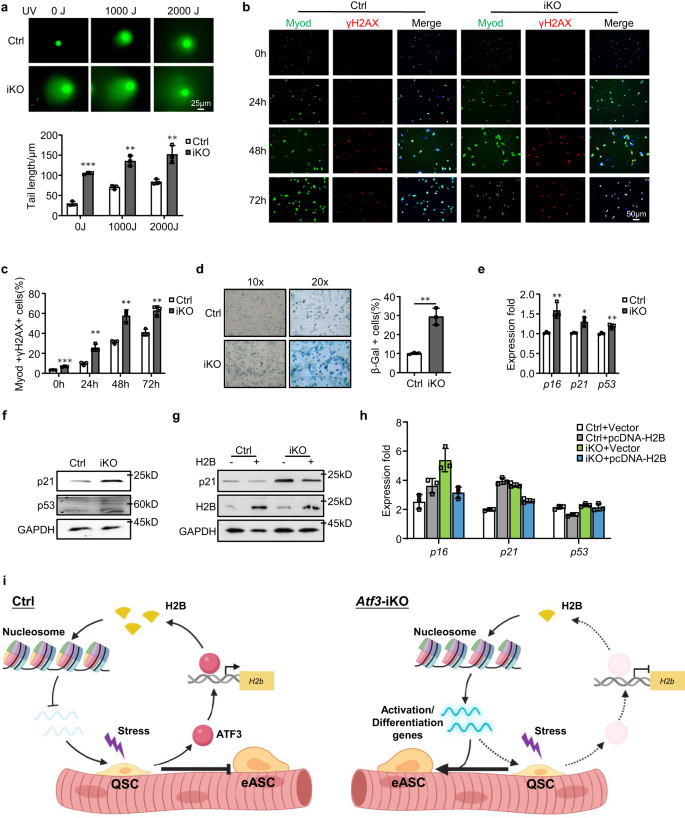
a Comet assay was performed on Ctrl or iKO SCs after 0, 1000 or 2000J UV treatment. Scale bar: 25 μm. n = 3 mice per group. p = 0.000029, 0.0012, and 0.0071. b IF staining of γH2AX (red) and Myod (green) was performed on SCs from Ctrl or iKO mice after cultured for 0, 24, 48 or 72 h. Scale bar: 50 μm. c Quantification of the percentages of Myod+/γH2AX+ cells; n = 3 mice per group. p = 0.00014, 0.0024, 0.0021 and 0.0031. d β-Gal (blue) staining was performed on SCs from Ctrl or iKO mice after cultured for 9 days. n = 3 mice per group. p = 0.0017. e Expression of the selected senescence marker genes including p16, p21 and p53 in SCs from Ctrl and iKO was quantified by RT–qPCR. p = 0.0078, 0.011 and 0.0061. f p21 and p53 protein levels were detected by Western blotting in SCs from Ctrl and iKO mice. GAPDH was used as a loading control. g, h SCs from Ctrl and iKO mice were transfected with an H2B-overexpressing or vector control plasmid. 96 h after transfection, expression of the indicated genes was detected by Western blotting and RT–qPCR. GAPDH was used as a loading control. i Schematic model depicting the functional role of ATF3 in preventing SC precocious activation. In homeostatic muscle, the rapid induction of ATF3 upon minor stress promotes H2b expression to maintain proper nucleosome positioning and suppress the expression of activation genes, thus preventing precocious activation of SCs. Upon ATF3 loss, H2B deficiency occurs which leads to altered nucleosome positioning and up-regulation of activation genes, causing SCs to break quiescence and enter early activating stage. Created with BioRender.com. All the bar graphs are presented as mean ± SD. Student’s t test (two-tailed unpaired) was used to calculate the statistical significance (a, c–e): *p < 0.05, **p < 0.01, ***p < 0.001. n.s. no significance. Source data are provided as a Source Data file.
Screening of other functional AP-1 family members in SCs and regeneration
After the above holistic characterization of the function and mechanism of ATF3 in SCs, we sought to expand the study by asking if other AP-1 family TFs such as ATF4, FOS, FOSB, and JUNB, also play functional roles in SCs considering their similar rapid and transient induction dynamics during SC early activation (Figs. 1b–d and S1c). To test the idea, we conducted a functional screening using our recently developed Pax7Cas9/AAV-sgRNA mediated in vivo genome editing platform64, which is based on a Cre-dependent Cas9 knock-in mice and AAV-mediated sgRNAs delivery. Briefly, one pair of sgRNAs targeting each TF were selected and packaged into AAV9 virus particles; 4 × 10¹¹ viral genomes (vg)/mouse of AAV9-sgRNA was intramuscularly (IM) injected into the TA muscles of Pax7Cas9 mice at postnatal (P) age of 10 days (P10). For the control (Ctrl) group, the same dose of AAV9 virus containing pAAV9-sgRNA vector backbone without any sgRNA insertion was injected. The mice were then sacrificed for SC isolation and analysis after eight weeks (Fig. S8a). Successful DNA editing efficiency was confirmed for all four TFs (Supplementary Fig. 8b–e); consistently, knock down (KD) of each protein to various degrees (52.4%–83.6%) was detected by WB (Supplementary Fig. 7b–e) or IF (Supplementary Fig. 8f) despite unaltered mRNA levels (Supplementary Fig. 8g).
To examine the effect of the above AP-1 TF KD on SC activation, FISCs from each mutant were cultured for in vitro EdU assay (Supplementary Fig. 8a). Similar to Atf3 KO, the Fos-KD cells showed accelerated SC activation while the JunB-KD displayed blunted activation; the Atf4 or FosB-KD, on the other hand, did not have any impact (Supplementary Fig. 8h). When measuring Pax7+ cells on the ~2 month-old uninjured muscles, interestingly, reduced numbers were observed upon the Atf4, Fos or JunB-KD (Supplementary Fig. 8i), suggesting a loss of SC pool. Since the Atf4 or JunB-KD did not lead to precocious SC activation, the SC number loss may be caused by other reasons considering the deletion occurred very early in the postnatal stage64. The FosB-KD did not have any impact on the Pax7+ SC pool.
To further investigate the impact on muscle regenerative ability, BaCl2 was injected 7 weeks after the AAV injection (Supplementary Fig. 8a) and the regeneration was assessed by H&E (Supplementary Fig. 8j), eMyHC (Supplementary Fig. 8k), Pax7 (Supplementary Fig. 8l) and MyoD (Supplementary Fig. 8m) staining at 5 dpi. An impaired regeneration was revealed in the Atf4 and Fos-KD presumably because of the exhaustion of SCs after its long-term deletion; The regeneration in the JunB-KD was also compromised probably due to a reduced SC pool; consistently, no impact on the regeneration was observed in the FosB-KD. Altogether, our results that these AP-1 family members may play diverse functions in SC activation and muscle regeneration.
- SEO Powered Content & PR Distribution. Get Amplified Today.
- PlatoData.Network Vertical Generative Ai. Empower Yourself. Access Here.
- PlatoAiStream. Web3 Intelligence. Knowledge Amplified. Access Here.
- PlatoESG. Automotive / EVs, Carbon, CleanTech, Energy, Environment, Solar, Waste Management. Access Here.
- PlatoHealth. Biotech and Clinical Trials Intelligence. Access Here.
- ChartPrime. Elevate your Trading Game with ChartPrime. Access Here.
- BlockOffsets. Modernizing Environmental Offset Ownership. Access Here.
- Source: https://www.nature.com/articles/s41467-023-40465-w

