Introduction
Learning about Window Functions in PySpark can be challenging but worth the effort. Window Functions are a powerful tool for analyzing data and can help you gain insights you may not have seen otherwise. By understanding how to use Window Functions in Spark; you can take your data analysis skills to the next level and make more informed decisions. Whether you’re working with large or small datasets, learning Window Functions in Spark will allow you to manipulate and analyze data in new and exciting ways.

In this blog, we will first understand the concept of window functions and then discuss how to use them with Spark SQL and PySpark DataFrame API. So that by the end of this article, you will understand how to use window functions with real datasets and get essential insights for business.
Learning Objectives
- Understand the concept of window functions.
- Working with window functions using datasets.
- Find out the insights using the window functions.
- Use Spark SQL and DataFrame API to work with window functions.
This article was published as a part of the Data Science Blogathon.
Table of contents
What are Window Functions?
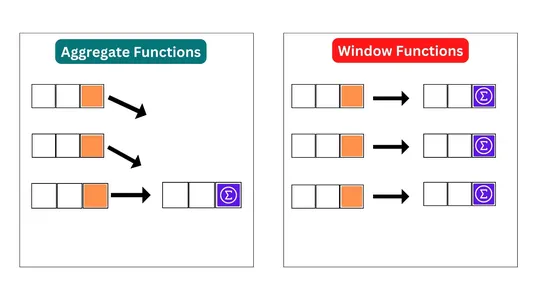
Window functions help analyze data within a group of rows that are related to each other. They enable users to perform complex transformations on the rows of a dataframe or dataset associated with each other based on some partitioning and ordering criteria.
Window functions operate on a specific partition of a dataframe or dataset defined by a set of partitioning columns. The ORDER BY clause partitions the data in a window function to arrange it in a specific order. Window functions then perform calculations on a sliding window of rows that includes the current row and a subset of the preceding either ‘and’/’or’ following rows, as specified in the window frame.
Some common examples of window functions include calculating moving averages, ranking or sorting rows based on a specific column or group of columns, calculating running totals, and finding the first or last value in a group of rows. With Spark’s powerful window functions, users can perform complex analyses and aggregations over large datasets with relative ease, making it a popular tool for big data processing and analytics.
Window Functions in SQL
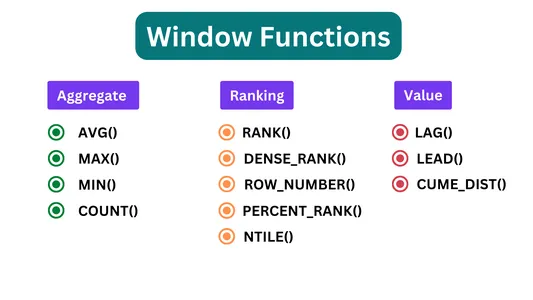
Spark SQL supports three kinds of window functions:
- Ranking Functions:- These functions assign a rank to each row within a partition of the result set. For example, the ROW_NUMBER() function gives a unique sequential number to each row within the partition.
- Analytics Functions:- These functions compute aggregate values over a window of rows. For example, the SUM() function calculates the sum of a column over a window of rows.
- Value Functions:- These functions compute an analytic value for each row in a partition, based on the values of other rows in the same partition. For example, the LAG() function returns the value of a column from the previous row in the partition.
DataFrame Creation
We will create a sample dataframe so, that we can practically work with different window functions. Also we will try to answer some questions with the help of this data and window functions.
The dataframe have employees details like their Name, Designation, Employee Number, Hire Date, Salary etc. Total we have 8 columns which are as follow:
- ’empno’: This column contains the employee’s number.
- ‘ename’: This column has employee names.
- ‘job’: This column contains information about employees’ job titles.
- ‘hiredate’: This column shows the employee’s hire date.
- ‘sal’: Salary details contains in this column.
- ‘comm’: This column has employee commission details, if any.
- ‘deptno’: The department number to which the employee belongs is in this column.
# Create Sample Dataframe
employees = [
    (7369, "SMITH", "CLERK", "17-Dec-80", 800, 20, 10),
    (7499, "ALLEN", "SALESMAN", "20-Feb-81", 1600, 300, 30),
    (7521, "WARD", "SALESMAN", "22-Feb-81", 1250, 500, 30),
    (7566, "JONES", "MANAGER", "2-Apr-81", 2975, 0, 20),
    (7654, "MARTIN", "SALESMAN", "28-Sep-81", 1250, 1400, 30),
    (7698, "BLAKE", "MANAGER", "1-May-81", 2850, 0, 30),
    (7782, "CLARK", "MANAGER", "9-Jun-81", 2450, 0, 10),
    (7788, "SCOTT", "ANALYST", "19-Apr-87", 3000, 0, 20),
    (7629, "ALEX", "SALESMAN", "28-Sep-79", 1150, 1400, 30),
    (7839, "KING", "PRESIDENT", "17-Nov-81", 5000, 0, 10),
    (7844, "TURNER", "SALESMAN", "8-Sep-81", 1500, 0, 30),
    (7876, "ADAMS", "CLERK", "23-May-87", 1100, 0, 20)
]
# create dataframe
emp_df = spark.createDataFrame(employees,
["empno", "ename", "job", "hiredate", "sal", "comm", "deptno"])
emp_df.show()
# Output:
+-----+------+---------+---------+----+----+------+
|empno| ename| job| hiredate| sal|comm|deptno|
+-----+------+---------+---------+----+----+------+
| 7369| SMITH| CLERK|17-Dec-80| 800| 20| 10|
| 7499| ALLEN| SALESMAN|20-Feb-81|1600| 300| 30|
| 7521| WARD| SALESMAN|22-Feb-81|1250| 500| 30|
| 7566| JONES| MANAGER| 2-Apr-81|2975| 0| 20|
| 7654|MARTIN| SALESMAN|28-Sep-81|1250|1400| 30|
| 7698| BLAKE| MANAGER| 1-May-81|2850| 0| 30|
| 7782| CLARK| MANAGER| 9-Jun-81|2450| 0| 10|
| 7788| SCOTT| ANALYST|19-Apr-87|3000| 0| 20|
| 7629| ALEX| SALESMAN|28-Sep-79|1150|1400| 30|
| 7839| KING|PRESIDENT|17-Nov-81|5000| 0| 10|
| 7844|TURNER| SALESMAN| 8-Sep-81|1500| 0| 30|
| 7876| ADAMS| CLERK|23-May-87|1100| 0| 20|
+-----+------+---------+---------+----+----+------+Now we will check the schema:
# Checking the schema

emp_df.printSchema()

# Output:-
root
 |-- empno: long (nullable = true)
 |-- ename: string (nullable = true)
 |-- job: string (nullable = true)
 |-- hiredate: string (nullable = true)
 |-- sal: long (nullable = true)
 |-- comm: long (nullable = true)
 |-- deptno: long (nullable = true)
Create a temporary view of the DataFrame ’emp_df’ with the name “emp”. It allows us to query the DataFrame using SQL syntax in Spark SQL as if it were a table. The temporary view is only valid for the duration of the Spark Session.
emp_df.createOrReplaceTempView("emp")Solving Problem Statements Using Window Functions
Here we will be solving several problem statements using windows functions:
Q1. Rank the salary within each department.
# Using spark sql

rank_df = spark.sql(
        """SELECT empno, ename, job, deptno, sal,
        RANK() OVER (PARTITION BY deptno ORDER BY sal DESC) AS rank FROM emp""")
rank_df.show()

# Using PySpark

windowSpec = Window.partitionBy(col('deptno')).orderBy(col('sal').desc())
            ranking_result_df = emp_df.select('empno', 'ename', 'job', 'deptno', 'sal',
            F.rank().over(windowSpec).alias('rank'))
ranking_result_df.show()

# Output:-
+-----+------+---------+------+----+----+
|empno| ename|      job|deptno| sal|rank|
+-----+------+---------+------+----+----+
| 7839|  KING|PRESIDENT|    10|5000|   1|
| 7782| CLARK|  MANAGER|    10|2450|   2|
| 7369| SMITH|    CLERK|    10| 800|   3|
| 7788| SCOTT|  ANALYST|    20|3000|   1|
| 7566| JONES|  MANAGER|    20|2975|   2|
| 7876| ADAMS|    CLERK|    20|1100|   3|
| 7698| BLAKE|  MANAGER|    30|2850|   1|
| 7499| ALLEN| SALESMAN|    30|1600|   2|
| 7844|TURNER| SALESMAN|    30|1500|   3|
| 7521|  WARD| SALESMAN|    30|1250|   4|
| 7654|MARTIN| SALESMAN|    30|1250|   4|
| 7629|  ALEX| SALESMAN|    30|1150|   6|
+-----+------+---------+------+----+----+
Approach for PySpark Code
- The Window function partitions the data by department number using partitionBy(col(‘deptno’)) and then orders the data within each partition by salary in descending order using orderBy(col(‘sal’).desc()). The variable windowSpec holds the final window specification.
- ’emp_df’ is the dataframe that contains employee data, including columns for empno, ename, job, deptno and sal.
- The rank function is applied to the salary column using ‘F.rank().over(windowSpec)’ within the select statement. The resulting column has an alias name as ‘rank’.
- It will create a dataframe, ‘ranking_result_df’, which includes empno, ename, job, deptno, and salary. It also has a new column, ‘rank’, that represents the rank of the employee’s salary within their department.
Output:
The outcome has salary rank in each department.
Q2. Dense rank the salary within each department.
# Using Spark SQL
dense_df = spark.sql(
        """SELECT empno, ename, job, deptno, sal,
        DENSE_RANK() OVER (PARTITION BY deptno ORDER BY sal DESC)
        AS dense_rank FROM emp""")
dense_df.show()

# Using PySpark
windowSpec = Window.partitionBy(col('deptno')).orderBy(col('sal').desc())
dense_ranking_df=emp_df.select('empno', 'ename', 'job', 'deptno', 'sal',
                      F.dense_rank().over(windowSpec).alias('dense_rank'))
dense_ranking_df.show()

# Output:-
+-----+------+---------+------+----+----------+
|empno| ename|      job|deptno| sal|dense_rank|
+-----+------+---------+------+----+----------+
| 7839|  KING|PRESIDENT|    10|5000|         1|
| 7782| CLARK|  MANAGER|    10|2450|         2|
| 7369| SMITH|    CLERK|    10| 800|         3|
| 7788| SCOTT|  ANALYST|    20|3000|         1|
| 7566| JONES|  MANAGER|    20|2975|         2|
| 7876| ADAMS|    CLERK|    20|1100|         3|
| 7698| BLAKE|  MANAGER|    30|2850|         1|
| 7499| ALLEN| SALESMAN|    30|1600|         2|
| 7844|TURNER| SALESMAN|    30|1500|         3|
| 7521|  WARD| SALESMAN|    30|1250|         4|
| 7654|MARTIN| SALESMAN|    30|1250|         4|
| 7629|  ALEX| SALESMAN|    30|1150|         5|
+-----+------+---------+------+----+----------+
Approach for PySpark Code
- First, create a window specification using the Window function, which partitions the ’emp_df’ DataFrame by deptno and orders it by descending the ‘sal’ column.
- Then, the dense_rank() function gets applied over the window specification, which assigns a dense rank to each row within each partition based on its sorted order.
- Finally, a new DataFrame called ‘dense_ranking_df’ is created by selecting specific columns from emp_df (i.e., ’empno’, ‘ename’, ‘job’, ‘deptno’, and ‘sal’) and adding a new column ‘dense_rank’ that contains the dense ranking values calculated by the window function.
- Last, display the resulting DataFrame in tabular format.
Output:
The outcome has a salary-wise dense rank.
Q3. Number the row within each department.
# Using Spark SQL
row_df = spark.sql(
        """SELECT empno, ename, job, deptno, sal,
        ROW_NUMBER() OVER (PARTITION BY deptno ORDER BY sal DESC)
         AS row_num FROM emp """)
row_df.show()

# Using PySpark code
windowSpec = Window.partitionBy(col('deptno')).orderBy(col('sal').desc())
row_num_df = emp_df.select('empno', 'ename', 'job', 'deptno', 'sal',
               F.row_number().over(windowSpec).alias('row_num'))
row_num_df.show()

# Output:-
+-----+------+---------+------+----+-------+
|empno| ename|      job|deptno| sal|row_num|
+-----+------+---------+------+----+-------+
| 7839|  KING|PRESIDENT|    10|5000|      1|
| 7782| CLARK|  MANAGER|    10|2450|      2|
| 7369| SMITH|    CLERK|    10| 800|      3|
| 7788| SCOTT|  ANALYST|    20|3000|      1|
| 7566| JONES|  MANAGER|    20|2975|      2|
| 7876| ADAMS|    CLERK|    20|1100|      3|
| 7698| BLAKE|  MANAGER|    30|2850|      1|
| 7499| ALLEN| SALESMAN|    30|1600|      2|
| 7844|TURNER| SALESMAN|    30|1500|      3|
| 7521|  WARD| SALESMAN|    30|1250|      4|
| 7654|MARTIN| SALESMAN|    30|1250|      5|
| 7629|  ALEX| SALESMAN|    30|1150|      6|
+-----+------+---------+------+----+-------+
Approach for PySpark code
- The first line defines a window specification for the calculation using the Window.partitionBy() and Window.orderBy() functions. This window is partitioned by the deptno column and ordered by the sal column in descending order.
- The second line creates a new DataFrame called ‘row_num_df’, a projection of ’emp_df’ with an additional column called ‘row_num’ and it contain the row numbers details.
- The show() function displays the resulting DataFrame, which shows each employee’s empno, ename, job, deptno, sal, and row_num columns.
Output:
The output will have the row number of each employee within their department based on their salary.
Q4. Running total sum of salary within each department.
# Using Spark SQL
running_sum_df = spark.sql(
          """SELECT empno, ename, job, deptno, sal,
          SUM(sal) OVER (PARTITION BY deptno ORDER BY sal DESC)
          AS running_total FROM emp
          """)
running_sum_df.show()

# Using PySpar
windowSpec = Window.partitionBy(col('deptno')).orderBy(col('sal').desc())
running_sum_sal_df= emp_df.select('empno', 'ename', 'job', 'deptno', 'sal',
                         F.sum('sal').over(windowSpec).alias('running_total'))
running_sum_sal_df.show()

# Output:-
+-----+------+---------+------+----+-------------+
|empno| ename|      job|deptno| sal|running_total|
+-----+------+---------+------+----+-------------+
| 7839|  KING|PRESIDENT|    10|5000|         5000|
| 7782| CLARK|  MANAGER|    10|2450|         7450|
| 7369| SMITH|    CLERK|    10| 800|         8250|
| 7788| SCOTT|  ANALYST|    20|3000|         3000|
| 7566| JONES|  MANAGER|    20|2975|         5975|
| 7876| ADAMS|    CLERK|    20|1100|         7075|
| 7698| BLAKE|  MANAGER|    30|2850|         2850|
| 7499| ALLEN| SALESMAN|    30|1600|         4450|
| 7844|TURNER| SALESMAN|    30|1500|         5950|
| 7521|  WARD| SALESMAN|    30|1250|         8450|
| 7654|MARTIN| SALESMAN|    30|1250|         8450|
| 7629|  ALEX| SALESMAN|    30|1150|         9600|
+-----+------+---------+------+----+-------------+
Approach for PySpark code
- First, a window specification is defined using the “Window.partitionBy()” and “Window.orderBy()” methods. The “partitionBy()” method partitions the data by the “deptno” column, while the “orderBy()” method orders the data by the “sal” column in descending order.
- Next, the “sum()” function is applied to the “sal” column using the “over()” method to calculate the running total of salaries within each department. The result will be in a new DataFrame called “running_sum_sal_df”, which contains the columns ’empno’, ‘ename’, ‘job’, ‘deptno’, ‘sal’, and ‘running_total’.
- Finally, the “show()” method is called on the “running_sum_sal_df” DataFrame to display the output of the query. The resulting DataFrame shows each employee’s running total of salaries and other details like name, department number, and job.
Output:
The output will have a running total of each department’s salary data.
Q5: The next salary within each department.
To find the next salary within each department we use LEAD function.
The lead() window function helps to get the value of the expression in the next row of the window partition. It returns a column for each input column, where each column will contain the value of the input column for the offset row above the current row within the window partition. The syntax for the lead function is:- lead(col, offset=1, default=None).
# Using Spark SQL
next_sal_df = spark.sql(
    """SELECT empno, ename, job, deptno, sal, LEAD(sal, 1)
    OVER (PARTITION BY deptno ORDER BY sal DESC) AS next_val FROM emp
    """)
next_sal_df.show()

# Output:-
+-----+------+---------+------+----+--------+
|empno| ename|      job|deptno| sal|next_val|
+-----+------+---------+------+----+--------+
| 7839|  KING|PRESIDENT|    10|5000|    2450|
| 7782| CLARK|  MANAGER|    10|2450|     800|
| 7369| SMITH|    CLERK|    10| 800|    null|
| 7788| SCOTT|  ANALYST|    20|3000|    2975|
| 7566| JONES|  MANAGER|    20|2975|    1100|
| 7876| ADAMS|    CLERK|    20|1100|    null|
| 7698| BLAKE|  MANAGER|    30|2850|    1600|
| 7499| ALLEN| SALESMAN|    30|1600|    1500|
| 7844|TURNER| SALESMAN|    30|1500|    1250|
| 7521|  WARD| SALESMAN|    30|1250|    1250|
| 7654|MARTIN| SALESMAN|    30|1250|    1150|
| 7629|  ALEX| SALESMAN|    30|1150|    null|
+-----+------+---------+------+----+--------+

# Using PySpark
windowSpec = Window.partitionBy(col('deptno')).orderBy(col('sal').desc())
next_salary_df = emp_df.select('empno', 'ename', 'job', 'deptno', 'sal',
               F.lead('sal', offset=1, default=0).over(windowSpec).alias('next_val'))
next_salary_df.show()

# Output:-
+-----+------+---------+------+----+--------+
|empno| ename|      job|deptno| sal|next_val|
+-----+------+---------+------+----+--------+
| 7839|  KING|PRESIDENT|    10|5000|    2450|
| 7782| CLARK|  MANAGER|    10|2450|     800|
| 7369| SMITH|    CLERK|    10| 800|       0|
| 7788| SCOTT|  ANALYST|    20|3000|    2975|
| 7566| JONES|  MANAGER|    20|2975|    1100|
| 7876| ADAMS|    CLERK|    20|1100|       0|
| 7698| BLAKE|  MANAGER|    30|2850|    1600|
| 7499| ALLEN| SALESMAN|    30|1600|    1500|
| 7844|TURNER| SALESMAN|    30|1500|    1250|
| 7521|  WARD| SALESMAN|    30|1250|    1250|
| 7654|MARTIN| SALESMAN|    30|1250|    1150|
| 7629|  ALEX| SALESMAN|    30|1150|       0|
+-----+------+---------+------+----+--------+
Approach for PySpark code
- First, the window function helps to partition the DataFrame’s rows by department number (deptno) and order the salaries in descending order within each partition.
- The lead() function is then applied to the ordered ‘sal’ column within each partition to return the salary of the following employee (with an offset of 1), and the default value is 0 in case there is no next employee.
- The resulting DataFrame ‘next_salary_df’ contains columns for the employee number (empno), name (ename), job title (job), department number (deptno), current salary (sal), and next salary (next_val).
Output:
The output contains the salary of the next employee in the department based on the order of descending salary.
Q6. Previous salary within each department.
To calculate the previous salary, we use the LAG function.
The lag function returns the value of an expression at a given offset before the current row within the window partition. The syntax of the lag function is:- lag(expr, offset=1, default=None).over(windowSpec).
# Using Spark SQL
preious_sal_df = spark.sql(
    """SELECT empno, ename, job, deptno, sal, LAG(sal, 1)
           OVER (PARTITION BY deptno ORDER BY sal DESC)
           AS prev_val FROM emp
         """)
preious_sal_df.show()

# Output:-
+-----+------+---------+------+----+--------+
|empno| ename|      job|deptno| sal|prev_val|
+-----+------+---------+------+----+--------+
| 7839|  KING|PRESIDENT|    10|5000|    null|
| 7782| CLARK|  MANAGER|    10|2450|    5000|
| 7369| SMITH|    CLERK|    10| 800|    2450|
| 7788| SCOTT|  ANALYST|    20|3000|    null|
| 7566| JONES|  MANAGER|    20|2975|    3000|
| 7876| ADAMS|    CLERK|    20|1100|    2975|
| 7698| BLAKE|  MANAGER|    30|2850|    null|
| 7499| ALLEN| SALESMAN|    30|1600|    2850|
| 7844|TURNER| SALESMAN|    30|1500|    1600|
| 7521|  WARD| SALESMAN|    30|1250|    1500|
| 7654|MARTIN| SALESMAN|    30|1250|    1250|
| 7629|  ALEX| SALESMAN|    30|1150|    1250|
+-----+------+---------+------+----+--------+

# Using PySpark
windowSpec = Window.partitionBy(col('deptno')).orderBy(col('sal').desc())
prev_sal_df = emp_df.select('empno', 'ename', 'job', 'deptno', 'sal',
                F.lag('sal', offset=1, default=0).over(windowSpec).alias('prev_val'))
prev_sal_df.show()

# Output:-
+-----+------+---------+------+----+--------+
|empno| ename|      job|deptno| sal|prev_val|
+-----+------+---------+------+----+--------+
| 7839|  KING|PRESIDENT|    10|5000|       0|
| 7782| CLARK|  MANAGER|    10|2450|    5000|
| 7369| SMITH|    CLERK|    10| 800|    2450|
| 7788| SCOTT|  ANALYST|    20|3000|       0|
| 7566| JONES|  MANAGER|    20|2975|    3000|
| 7876| ADAMS|    CLERK|    20|1100|    2975|
| 7698| BLAKE|  MANAGER|    30|2850|       0|
| 7499| ALLEN| SALESMAN|    30|1600|    2850|
| 7844|TURNER| SALESMAN|    30|1500|    1600|
| 7521|  WARD| SALESMAN|    30|1250|    1500|
| 7654|MARTIN| SALESMAN|    30|1250|    1250|
| 7629|  ALEX| SALESMAN|    30|1150|    1250|
+-----+------+---------+------+----+--------+
Approach for PySpark code
- The window.partitionBy(col(‘deptno’)) specifies the window partition. It means that the window function works separately for each department.
- Then orderBy(col(‘sal’).desc()) specifies the order of the salary and will order the salaries within each department in descending order.
- F.lag(‘sal’, offset=1, default=0).over(windowSpec).alias(‘prev_val’) creates a new column called prev_val in the DataFrame ‘prev_sal_df’.
- For each row, this column contains the value of the ‘sal’ column from the previous row within the window defined by the windowSpec.
- The offset=1 parameter indicates that the previous row should be one row before the current row, and default=0 specifies the default value for the first row in each partition (since there is no previous row for the first row).
- Finally, prev_sal_df.show() displays the resulting DataFrame.
Output:
The output represents the previous salary for each employee within each department, based on ordering the salaries in descending order.
Q7. First Salary within each department and comparing against every member within each department.
# Using Spark SQL
first_val_df = spark.sql("""SELECT empno, ename, job, deptno, sal,
                   FIRST_VALUE(sal) OVER (PARTITION BY deptno ORDER BY sal DESC)
                   AS first_val FROM emp """)
first_val_df.show()

# Using PySpark
windowSpec = Window.partitionBy(col('deptno')).orderBy(col('sal').desc())
first_value_df = emp_df.select('empno', 'ename', 'job', 'deptno', 'sal',
                   F.first('sal').over(windowSpec).alias('first_val'))
first_value_df.show()

# Output:-
+-----+------+---------+------+----+---------+
|empno| ename|      job|deptno| sal|first_val|
+-----+------+---------+------+----+---------+
| 7839|  KING|PRESIDENT|    10|5000|     5000|
| 7782| CLARK|  MANAGER|    10|2450|     5000|
| 7369| SMITH|    CLERK|    10| 800|     5000|
| 7788| SCOTT|  ANALYST|    20|3000|     3000|
| 7566| JONES|  MANAGER|    20|2975|     3000|
| 7876| ADAMS|    CLERK|    20|1100|     3000|
| 7698| BLAKE|  MANAGER|    30|2850|     2850|
| 7499| ALLEN| SALESMAN|    30|1600|     2850|
| 7844|TURNER| SALESMAN|    30|1500|     2850|
| 7521|  WARD| SALESMAN|    30|1250|     2850|
| 7654|MARTIN| SALESMAN|    30|1250|     2850|
| 7629|  ALEX| SALESMAN|    30|1150|     2850|
+-----+------+---------+------+----+---------+
Approach for PySpark code
- First, create a WindowSpec object that partitions the data by department number (deptno) and orders it by salary (sal) in descending order.
- Then applies the first() analytical function to the ‘sal’ column over the window defined by windowSpec. This function returns the first value of the ‘sal’ column within each partition (i.e. each deptno group) ordered by descending ‘sal’. The resulting column has a new name, ‘first_val’.
- Now assigns the resulting DataFrame, which contains the selected columns and a new column, ‘first_val’, that shows the first highest salary for each department based on the descending order of salary values, to a new variable called ‘first_value_df’.
Output:
The output shows the first highest salary for each department in an employee DataFrame.
Conclusion
In this article, we learn about window functions. Spark SQL has three kinds of window functions: Ranking functions, Aggregate functions and Value functions. Using this function, we worked on a dataset to find some important and valuable insights. Spark Window Functions offer powerful data analysis tools like ranking, analytics, and value computations. Whether analyzing salary insights by department or employing practical examples with PySpark & SQL, these functions provide essential tools for effective data processing and analysis in Spark.
Key Takeaways
- We learned about the window functions and worked with them using Spark SQL and PySpark DataFrame API.
- We use functions such as rank, dense_rank, row_number, lag, lead, groupBy, partitionBy, and other functions to provide proper analysis.
- We have also seen the detailed step-by-step solutions to the problem and analyzed the output at the end of each problem statement.
This case study helps you better understand the PySpark functions. If you have any opinions or questions, then comment down below. Connect with me on LinkedIn for further discussion. Keep Learning!!!
The media shown in this article is not owned by Analytics Vidhya and is used at the Author’s discretion.
- SEO Powered Content & PR Distribution. Get Amplified Today.
- PlatoData.Network Vertical Generative Ai. Empower Yourself. Access Here.
- PlatoAiStream. Web3 Intelligence. Knowledge Amplified. Access Here.
- PlatoESG. Carbon, CleanTech, Energy, Environment, Solar, Waste Management. Access Here.
- PlatoHealth. Biotech and Clinical Trials Intelligence. Access Here.
- Source: https://www.analyticsvidhya.com/blog/2024/03/working-with-window-functions-in-pyspark/

