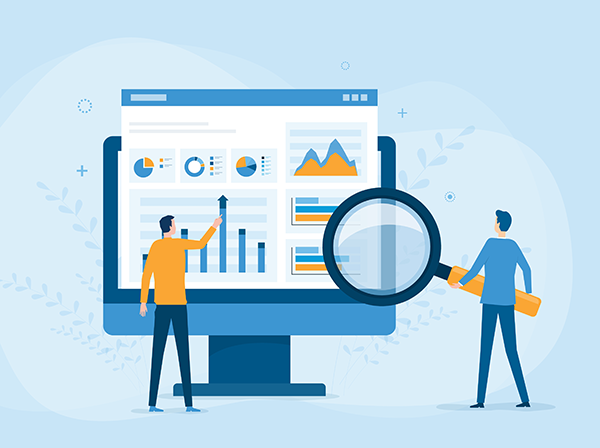

Data observability tools have become increasingly important as businesses rely more and more on data-driven decision-making. These tools are used to support the data’s reliability, consistency, and accuracy throughout the business. Data observability has become necessary for developing trustworthy data and diagnosing data flow problems that interfere with the business’s objectives. Data observability tools normally provide end-to-end visibility into a business’s data systems and will proactively find errors.
Data observability can be described as a process that provides the ability to locate and correct problems with the data. Tools are used to monitor an organization’s data for accuracy, usefulness, and health. Data observability also includes observing processes such as data lineage and data cleansing.
Using data observability tools allows staff, ranging from data engineers to marketing staff, to work with reliable data they can trust not to freeze up or shut down their computers.
Data observability tools can provide automated alerts and diagnostics to identify and evaluate problems with the data flow. Using these tools will reduce downtime and communication errors by identifying and resolving Data Quality issues before they have an impact.
Data Observability vs. Data Monitoring
Data monitoring came first and is a solution for detecting problems and notifying the appropriate person or team – after the problem has occurred.
Comparatively speaking, data monitoring is a passive process, while data observability can be considered a proactive process that attempts to deal with the problem before it occurs, or as it occurs in real time. If data observability doesn’t allow you to preempt the problem, it will help you to understand why the problem exists and develop a solution. Data observability is not limited to the flow of data but offers an overview of the organization’s data assets.
Data monitoring, however, is still a process that is useful and can be considered a subdivision of data observation. It is also still necessary for building and operating microservice-based systems.
The Three Pillars of Data Observability Tools
Data observability uses three pillars to support the process of maintaining and managing data: traces, metrics, and logs. When these “pillars” are combined, they can provide a holistic view of how the data is being used and altered.
A single pillar may not provide the information needed to detect a problem or provide a diagnosis, but all three should be able to. These pillars can be applied to websites, clouds, servers, and microservice environments.
Data observability tools typically use machine learning algorithms to observe the accuracy and speed of the data’s delivery.
The fairly newer concept of traces is designed to record a chain of distributed events and what takes place between them. Distributed traces create a record of the user’s journey, and then aggregate the “observations.“ A trace also shows user requests, processed requests end-to-end, and backend systems. Traces can be shown visually on a dashboard.
An open-source tracing tool called Zipkin is available.
Distributed tracing is especially useful when data is processed through multiple containerized microservices. Traces are generated automatically and are standardized. Because they show the length of time each step takes the user, they are both functional and easy to use.
The benefits of tracing are:
- Bottlenecks can be corrected much more quickly.
- Automatic notification of anomalies, or if the site has gone down completely.
- Tracing will provide an overview of the organization’s distributed microservices.
Observability metrics are software that covers a range of KPIs (key performance indicators) that can offer insights into the performance of an organization’s differing systems. For example, while observing a website, the metrics include the response time, the peak load, and the requests that were served. While observing a server, the metrics will include memory usage, latency, error rates, and CPU capacity.
An open-source tool named Prometheus is specifically designed for using metrics.
The KPIs can also provide insights into the system’s health and performance. By measuring the system’s performance, actionable insights for improvements can be developed.
Metrics also provide alerts, so teams can monitor the system in real-time. Metric alerts can be used to monitor events within the system for anomalous activities. (By itself, metrics can be difficult to use for diagnostics, and a tagging system that is typically used with it can quickly become cost-prohibitive because of the computing power and storage needed for all the data the tagging system generates.)
Logs and log files software keeps track of events that take place within a computer system, such as problems, errors, and information on the business’s current operations. These events can take place in the operating system and other software.
Log files are computer-generated and contain information about activities, usage patterns, and operations. Logs will provide some of the organization’s most useful historical data records. They use timestamps (very useful) and “structured” logs that combine metadata with plain text, making querying and organization easier. Logs can provide the answers to “what, when, who, and how” questions about data activity.
A log aggregation tool called Grafana Loki is available for storing and querying logs from all the organization’s applications and infrastructure. (Loki uses a unique approach and only indexes the metadata. This tool integrates with Grefana, Prometheus, and Kubernetes.)
Traces vs. Logs
Traces are generated automatically, with data visualization available, making it easier to observe problems and fix them. Traces work better than logs in providing context for events. However, logs provide code-level visibility into problems that traces won’t provide.
Data Pipelines and Observability
Data pipeline observability describes observing a pipeline’s internal processes for data anomalies and problems. It provides an understanding of how the data moves and is transformed in the pipeline, and can be used with logging, metrics, and tracing data pipelines.
Data pipelines often include a series of steps with data being collected, transformed, and stored. It may include processes such as data transformation, data cleansing, and downloading of the data. Each step can use different processes and has the potential to impact the data’s quality and reliability.
The software used for data pipeline observability provides information about each step of the data pipeline’s functions. The software also offers information about the pipeline’s inner workings, and how they correlate with specific types of outputs. This information allows data techs to understand what went wrong and fix it.
Data pipelines collect data from different sources. They transform and enrich the data, making it available for storage, business operations, and analytics. The management of multiple processing stages requires continuous observation. Identifying data issues before they impact downstream applications is necessary for resolving problems quickly and efficiently.
Databand.ai is a unified data observability platform built for data engineers. Databand.ai centralizes the pipeline’s metadata to provide end-to-end observability and can identify the source of a problem quickly.
Logstash is a free, open data processing pipeline that comes with its own observability tools. Logstash provides pipeline viewer features for easy observation.
How to Select a Data Observability Platform
Choosing the best data observability platform for your organization begins with an examination of the existing data architecture and finding a platform that integrates easily with your system.
Ideally, a data observability platform that will monitor the data at rest and as it flows through the system. A functional data observability platform will come with these tools:
- A dashboard
- The ability to trace data
- Data logs
- Observability metrics
Here are just a few of the data observability platforms that support the three basic pillars and come with a dashboard:
Datadog: A data observation platform that can provide performance metrics and event monitoring for an organization’s infrastructure and cloud services. Datadog’s platform can observe the flow of data through servers, databases, and tools.
Sentry: An open-source data observation platform that helps to identify bottlenecks and errors. Sentry’s distributed tracing also allows the platform to organize data coming from different sources. This process provides a very useful overview of the data at each checkpoint the data passes through.
Logit.io: Their distributed tracing solution allows key events to be tracked, and shows how resources are being employed across any application. The platform also allows techs to access the business’s metrics, events, logs, and traces. Metrics can be used to create dashboards, reports, and alerts. The Logit.io platform can also be used for infrastructure monitoring, log management, and deep metrics analysis.
Grafana Cloud: A data observability platform designed for metrics, logs, and traces, and described as supporting the best dashboarding platform. Grafana Cloud is an open and composable observability platform. It provides the flexibility to host metrics, logs, and traces in Grafana Cloud, and supports mix-and-match tools to avoid vendor lock-in.
New Relic: Occasionally referred to as “New Relic One,” New Relic lets you detect, diagnose, and eliminate errors quickly. It supports end-to-end observability and will integrate with over 440 other technologies. It has customizable dashboards and will also spot anomalies or performance issues, automatically, across all the organization’s apps, services, and logs.
Image used under license from Shutterstock.com
- SEO Powered Content & PR Distribution. Get Amplified Today.
- PlatoData.Network Vertical Generative Ai. Empower Yourself. Access Here.
- PlatoAiStream. Web3 Intelligence. Knowledge Amplified. Access Here.
- PlatoESG. Carbon, CleanTech, Energy, Environment, Solar, Waste Management. Access Here.
- PlatoHealth. Biotech and Clinical Trials Intelligence. Access Here.
- Source: https://www.dataversity.net/understanding-data-observability-tools/


