Executive Summary
- Liquidity, volatility, and volumes continue to compress across the digital asset market, with many metrics falling back to 2020 pre-bull levels.
- Stablecoins are experiencing a persistent decline in supply as redemptions are made across all major stablecoin assets with the exception of Tether (USDT).
- The Long-Term Holder cohort are steadfast in their holdings, spending remarkably little of it.
- Short-Term holders on the other hand are teetering on the edge of profitability, with a large majority of their supply acquired above the current price range.
The digital asset market has returned to a remarkably narrow trading range, experiencing a regime of compressed volatility, and exceptionally light volumes. All in all, it can be argued that extreme apathy and boredom best describe the prevailing sentiment. In recent weeks, we have explored how this is being expressed in both derivatives markets (WoC 32) and on-chain data (WoC 33). In last week’s video report, we detailed some of the driving factors, primarily related to a regime of net capital outflows.
In this edition, we will further explore this drying up of liquidity, and how we can use on-chain data to better characterize this market structure.
Stable Supply Declines
We will begin our study with a macro view of capital flows into the industry. Here, we consider the aggregate invested capital held within the three major assets, Bitcoin, Ethereum, and stablecoins.
- 🟢 Stablecoins have experienced a persistent decline in supply since April 2022, as redemption commenced following the collapse of LUNA-UST.
- Both 🟠 BTC and 🔵 ETH experienced a net inflow of capital since the start of the year, seeing their Realized Cap’s climb by up to $6.8B/mth (BTC) and $4.8B/mth, respectively.
- Since late August however, all three assets have seen a return to neutral or negtative inflows, suggesting a degree of stagnation and uncertainty has taken over.

If we isolate stablecoins, we can see that a total of $43B in capital has been redeemed, representing a total decline of 26% since the high set in March 2022. This can be argued to be a result of both capital leaving due to bear market conditions, but also a reflection of the opportunity cost of higher interest rates, which are not passed onto non-yielding stablecoins.

Breaking down the three largest stablecoins, we can that these dynamics are not evenly distributed:
- 🟢 USDT supplies have actually expanded by +$13.3B since the current cycle lows set in Nov 2022.
- 🔵 USDC has seen an almost equal and opposite decline of -$16.7B, likely in part a reflection of US based institutions moving capital towards higher interest rate markets.
- 🟡 BUSD has seen a dramatic decline of $20.4B (-89%), largely due to issuer Paxos moving into a redemption only mode following SEC enforcement.

If we look at it through the lends of relative dominance, we can see just how significant the expansion of Tether’s market share is. USDT now represents 69% of the stablecoin market, a stark reversal from the 44% low in dominance hit in June 2022.
BUSD dominance has fallen to 2.1%, and USDC to just 21.7%, a significant fall from the peak of 38% reached a little over a year ago.

On a shorter term horizon, we can look at the relative buy-side vs sell-side for the three major assets flowing into exchanges. Here we make a set of simple assumptions:
- We assume the USD value of BTC and ETH flowing into exchanges is a proxy for ‘sell-side’ pressure.
- We assume the USD value of stablecoins flowing into exchanges is a proxy for ‘buy-side’ pressure.
The chart below calculates the net USD difference between Stablecoin inflows (+ve) and BTC + ETH inflows. What we are looking for is less the absolute magnitude (as there will be error bars around these assumptions), but more-so any significant regime shifts.
- 🟢 Positive values suggest a net buy-side regime, where buy-side of stablecoins exceed BTC+ETH sell-side.
- 🔴 Negative values suggest a net sell-side regime, where buy-side of stablecoins are less than BTC+ETH sell-side.
The 2021 bull cycle was clearly dominated by net sell-side pressure as investors took profits during the mania of the uptrends. The collapse of LUNA-UST and 3AC in mid 2022 signified a shift back towards net accumulation, as investors worked to establish a market floor.
Since April this year however, the market has returned to a relatively neutral level, aligned with the slow-down in BTC and ETH capital inflows, and the market becoming increasingly apathetic and uncertain.

It is Quiet On-chain…
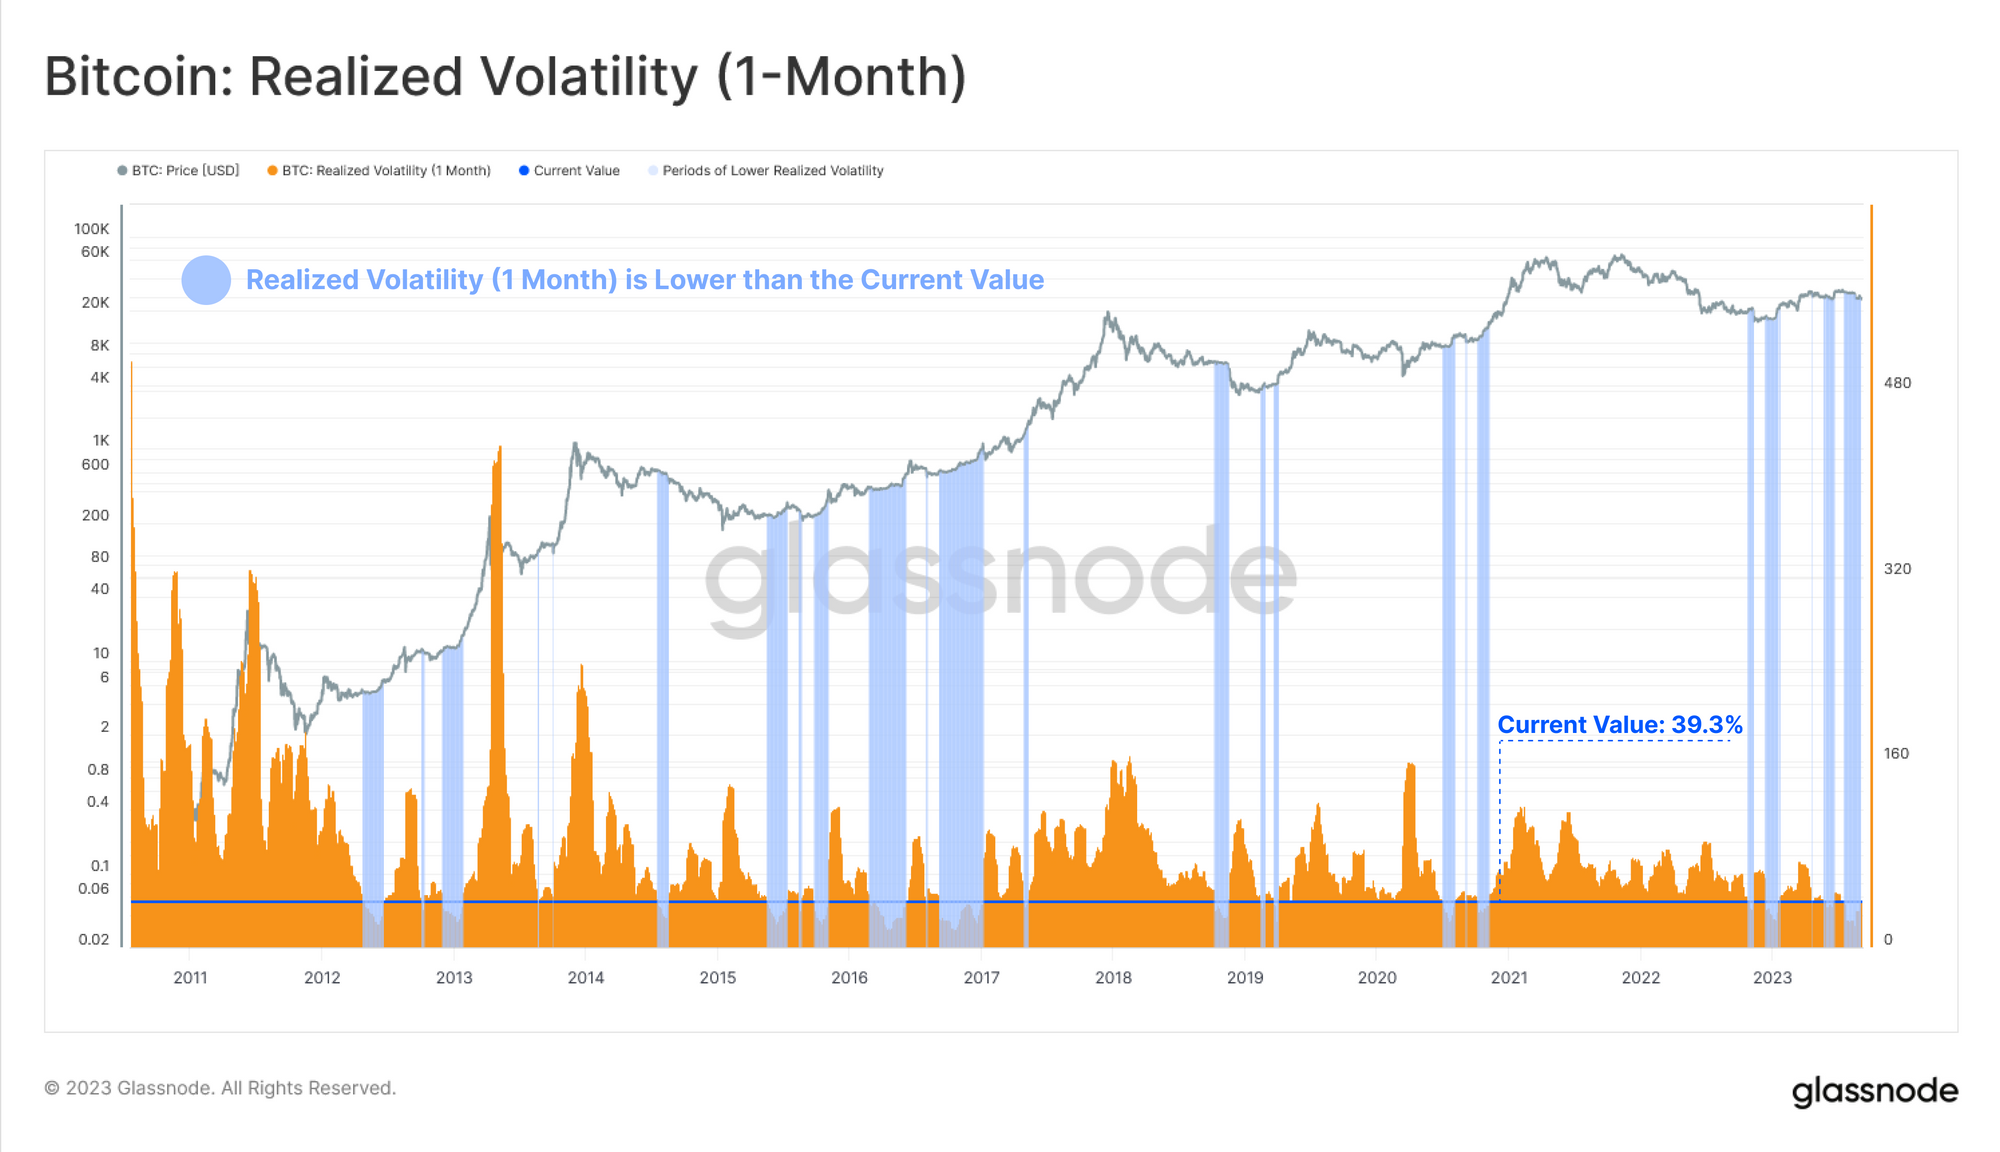
Despite the volatility spike experienced during the recent sell-off to $26k, and then again during following Grayscale’s successful challenge of the SEC in the courts, Realized Volatility has remained remarkably low. The market is still in a historically low volatility environment, which is usually a precursor to heightened volatility down the road.
This low liquidity and low volatility environment is also reflected across Bitcoin network settlement volumes. The total USD volume of coins changing hands (using our entity-adjustment clustering) is languishing around cycle lows of $2.44B/day, and has returned to October 2020 levels.

If we look at the realized value settled on-chain (being the delta between coin acquisition and disposal prices) we see that this remains extremely quiet. There is minimal profit or loss being locked in by the market overall, suggesting a majority of the coins which are transacting are within close proximity to their original acquisition price.
Realized Profit and Loss are similarly at levels equivalent to the 2020 market, highlighting what is arguably a complete and total wash-out of the exuberance from the 2021 bull market.

We can also track this on-chain illiquidity and apathetic sentiment by observing the proportion of wealth held in the most active and liquid subsection of the market, the ‘Hot Supply’ cohort (coins moved within the last week).
The realized value held in this ‘Hot Supply’ cohort old resides at historical lows, suggesting that very few coins which are older than 1-week are transacting at present.

It Is Quiet Off-chain Too…
Moving across to off-chain derivatives markets, we can see that futures trading volumes have succumbed to a similar fate, hitting historical lows of $12B/day. The only period with lighter trade volume was the lull at the end of 2022, where the Bitcoin price traded within a $557 range for over two weeks (WoC 2).

We have noticed an interesting divergence in Options markets however, where trade volumes have increased meaningfully in 2023, currently at $437M/day. This could be a reflection of the market preferring to use the leverage and capital efficiency of options to express their view during a period of tighter overall liquidity conditions.
It is important to note that whilst options markets now have a comparable magnitude of open interest relative to futures markets, options trade volumes remain an order of magnitude smaller.

Again, despite a few days of sharp volatility over the last month, options markets continue to price in relatively low implied volatility. The initial uptick in volatility premium was short-lived, with 1-month implied volatility trading back at historical lows of 33.9% once again.

The Market HODLs On
With both the on- and off-chain domains being exceptionally quiet, it is of no surprise that the supply held by the Long-Term Holder cohort has reached a new ATH of 14.74M BTC. Conversely, the supply held within the Short-Term cohort, representing the more active portion of the market, has fallen to the lowest supply held since 2011.
HODLing certainly remains the primary market dynamic, which both signals a steady conviction amongst existing holders, but highlights that these investors are likely the only ones who remain.

We can find confluence within the Liveliness metric, which elegantly compares the balance of all time Coinday Destruction to Coinday Creation. In other words, Liveliness represents the relative balance of ‘investor holding time’ across the market.
Aligned with the net sell-side regime we covered above, 2021 saw a significant uptick in Liveliness, as older coins were spent and took profits. As the 2022 bear market set in between May and Dec 2021, a strong downtrend was established. This marked an inflection point from a traders market, towards a HODLer market.
Liveliness has now reset to late 2020 conditions, and is seeing a progressively steeper downtrend. This indicates that aggregate ‘investor holding time’ is increasing, and investors are increasingly unwilling to spend and part with their held coins.

A key insight from this work was the development of the True Market Mean price, which we argue is the most accurate ‘cost basis’ model for active Bitcoin investors. This model is currently located at $29.6k, and has formed a psychological resistance level since April of this year. The traditional Realized Price is trading at $20.3k, with both models bounding much of the years price action.

Market Sensitivity
If we apply these two pricing models as psychological boundaries to the URPD chart, we can better characterize the supply acquired between these two models. At present, over 4.81M BTC have a cost basis between $20.3k and $29.6k.
We can also see that with prices trading just under $26k at the time of writing, Short-Term Holders 🔴 are almost entirely underwater on their position. It could be argued that this puts this more price sensitive cohort a little bit on edge.

The chart below shows the percent of Short-Term Holder supply in Profit. We can see that the vast majority of their supply has been plunged into an unrealized loss, with only 16.3% of their supply still held ‘in profit’.

For the Long-Term Holder cohort, their profitability is gradually increasing, although is still historically low, and has only left the minus one standard deviation band a few months ago. Whilst this is a constructive trend, over 26.7% of LTH supply is underwater relative to their acquisition price, and well below the all-time-mean.
Whilst 2023 has been a fairly reasonable recovery for Bitcoin and digital assets, these findings would suggest there are still several psychological cost basis barriers that must still be overcome.

Summary and Conclusions
Volatility, liquidity, trade volumes and on-chain settlement volumes are at historical lows. This reinforces the probability that the market has entered a period of extreme apathy, exhaustion, and arguably boredom.
The Long-Term HODLer cohort remain steadfast, relinquishing very little of their held supply. The Short-Term Holder cohort on the other hand are teetering on the edge of profitability, with many coins holding a cost basis above the current $26k trading range. This suggests that this cohort are increasingly price sensitive, and that many psychological price levels are yet to be overcome.
Disclaimer: This report does not provide any investment advice. All data is provided for information and educational purposes only. No investment decision shall be based on the information provided here and you are solely responsible for your own investment decisions.

- SEO Powered Content & PR Distribution. Get Amplified Today.
- PlatoData.Network Vertical Generative Ai. Empower Yourself. Access Here.
- PlatoAiStream. Web3 Intelligence. Knowledge Amplified. Access Here.
- PlatoESG. Automotive / EVs, Carbon, CleanTech, Energy, Environment, Solar, Waste Management. Access Here.
- PlatoHealth. Biotech and Clinical Trials Intelligence. Access Here.
- ChartPrime. Elevate your Trading Game with ChartPrime. Access Here.
- BlockOffsets. Modernizing Environmental Offset Ownership. Access Here.
- Source: https://insights.glassnode.com/the-week-onchain-week-37-2023/

