
Crypto financial statements are the investor’s secret weapon.
Most people don’t even know these financial statements exist. Sure, public companies are required to disclose their financials, but crypto?
True, crypto financial statements are still new and evolving. Various companies offer these statements, but our favorite is Token Terminal, which we’ll use for this guide.
For a quick snapshot, the three most important metrics to evaluate a crypto investment are:
- Active Users (Daily): Also known as Daily Active Users (DAU), this is like the number of customers of a traditional company. More DAU = a more valuable crypto company.
- Fees: This is the money generated by the crypto company, like revenue of a traditional company. (Confusingly, there’s another line called “Revenue” – just think of Fees like revenues.)
- Price/Market cap: This gives you a snapshot of what people are paying for the token (i.e., shares of the company), and the total value of the crypto company.
See our guide on How to Value Crypto Investments for more on these three important metrics.
Why We Need Crypto Financial Statements
The idea of creating crypto financial statements may have started with James Wang, who created one for Ethereum in Q1 2021. It was a clever concept: public companies are required to disclose their quarterly financials; why not do the same thing for crypto “companies”?
Since blockchain technology is transparent, these financial statements would be much better than those of traditional companies. They wouldn’t be prepared by an in-house financial team, shrouded in secrecy, and released weeks later. They would be available to anyone, instantly.
The SEC, which prides itself on requiring clear and transparent financial information for investors, should be praising crypto financial statements. They are so much better than the way it’s done with public companies.
For long-term crypto investors, these financial statements are a superpower. They cut through the hype and the headlines, and give you the cold, hard facts about any listed crypto project (Token Terminal currently lists several hundred companies).
Today I’ll show you how to read crypto financial statements, and some of the quick numbers you can pull to see whether a crypto investment might be worth your hard-earned money.
Understanding the Income Statement
| Term | What it is | Public-company equivalent |
| Fees | Money taken in from users of the product | Revenue |
| Supply-side fees | Fees that go to miners or validators | Salaries, COGS |
| Revenue | Value that is passed to token holders (fee-sharing or token burning) | Dividends, stock buybacks |
| Token incentives | Free tokens given to users for using the product | Discounts, rebates (but paid by issuing new shares) |
| Earnings | Token incentives minus earnings | Share dilution (or buyback) |
If you’re used to reading traditional income statements, you’ll have to wrap your head around these confusing names, so I’ll break them down.
- What they call “fees” is like a traditional company’s “revenue.” As every crypto investor knows, you have to pay fees to use crypto products. The crypto company takes in these fees, like revenues of a traditional company.
- “Supply-side fees” are the share of these fees that go to the miners or validators: the ones who maintain the network. In a traditional company, this might be like your salaries paid to employees, or what you pay to make the product (also known as Cost of Goods Sold, or COGS).
- What they call “Revenue” is transaction fees that are paid to token holders, or (in some cases) tokens that are burned. Think of this more like “dividends” and “stock buybacks”: it’s revenue that’s benefiting the “shareholders” or “owners” (i.e., those who hold the token).
- “Token incentives” are “extra rewards” paid to users to get them to use the product. Compound, for example, pays COMP tokens to lenders and borrowers. This encourages usage of the product, but continually dilutes the value of COMP for everyone else. This is a useful metric, and I don’t think there’s a public-company equivalent: it would be like if Uber paid stock to get you to use their product in the early days. (More info here.)
- Finally, what they call “Earnings” are the aforementioned “Revenue” minus “Token incentives.” (Think of it as value that accrues to shareholders, minus value that is taken away.) Earnings is incredibly valuable, even if it’s confusingly-named, because it tells you whether owners/shareholders are gaining value or losing it.
Let’s take a few real-life examples, and the “story” that you can tell from each. To tell the story, we read the statements from right to left, or past to present.
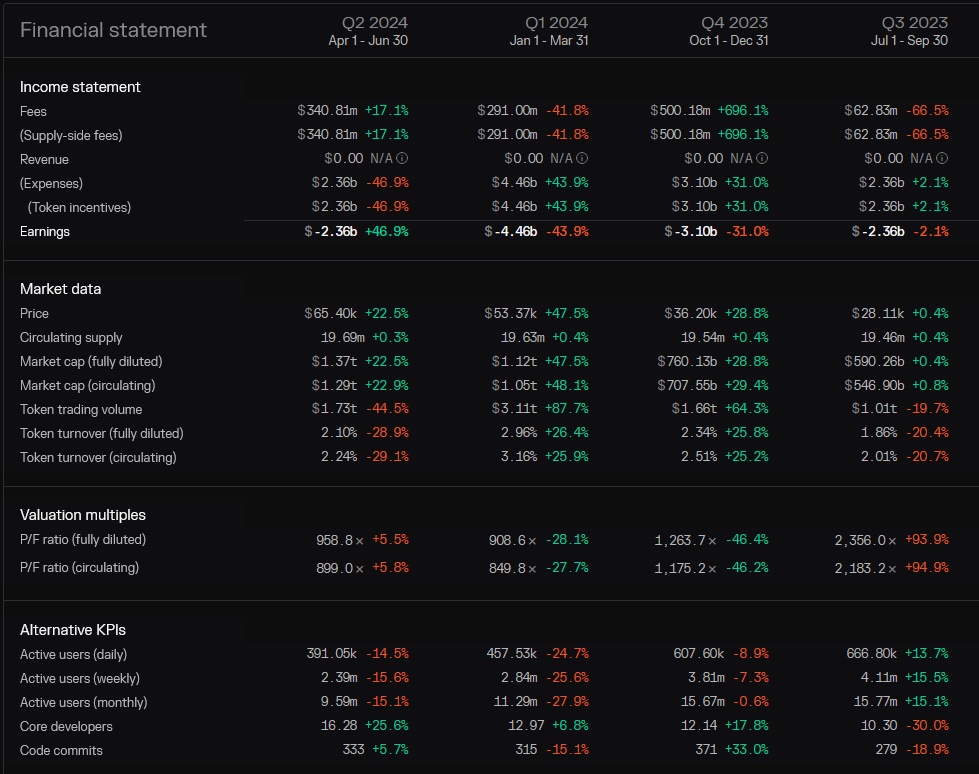
Bitcoin Income Statement
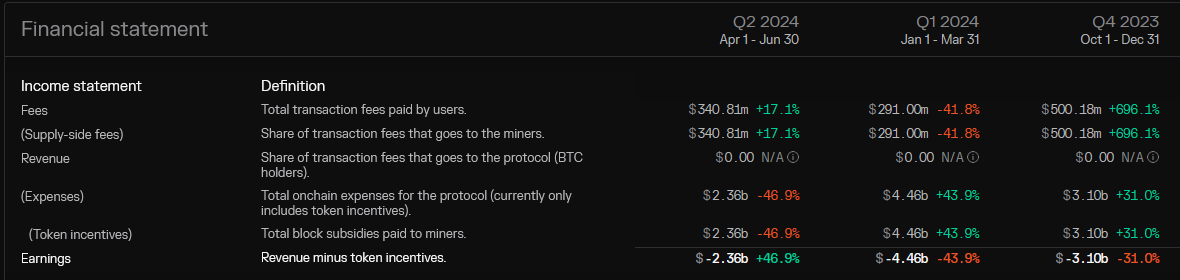
The story: Bitcoin’s transaction fees have increased to $340.8 million this quarter, which reflects excitement around the recent halving event. This also cut miner rewards by half, which led to a significant 46.9% drop in token incentives, which improved earnings to -2.36 billion.
Calling the bottom line “Earnings” looks like the bitcoin company is losing money every quarter, which isn’t really accurate, but it does highlight an important point: all bitcoin fees are going to miners, and none to the owners (or BTC investors).
In these reports, negative Earnings are not necessarily bad. They just mean you (the owner/shareholder) are not getting additional value, on top of the value of your underlying BTC.
As an analogy, some traditional investors only want to buy companies that pay dividends. Others don’t care about regular payments, as long as the company has good long-term growth prospects. Bitcoin would appeal to the second type of investor.
Ethereum Income Statement
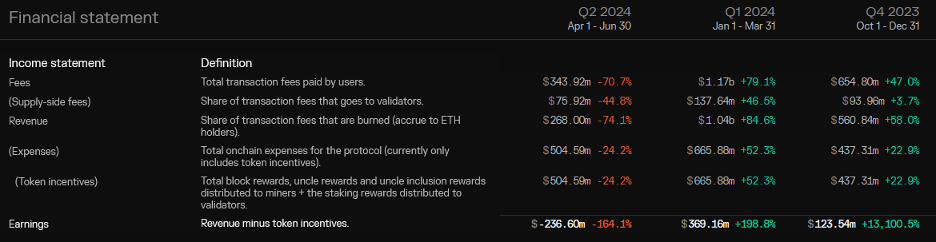
The story: Not a great financial picture. Fees (think: revenues) are down, and earnings (think: the value of your investment) is going from positive to negative. This is a bad quarter for ETH investors, though we would hope the inflows to Ethereum ETFs will turn things around.
Uniswap Income Statement
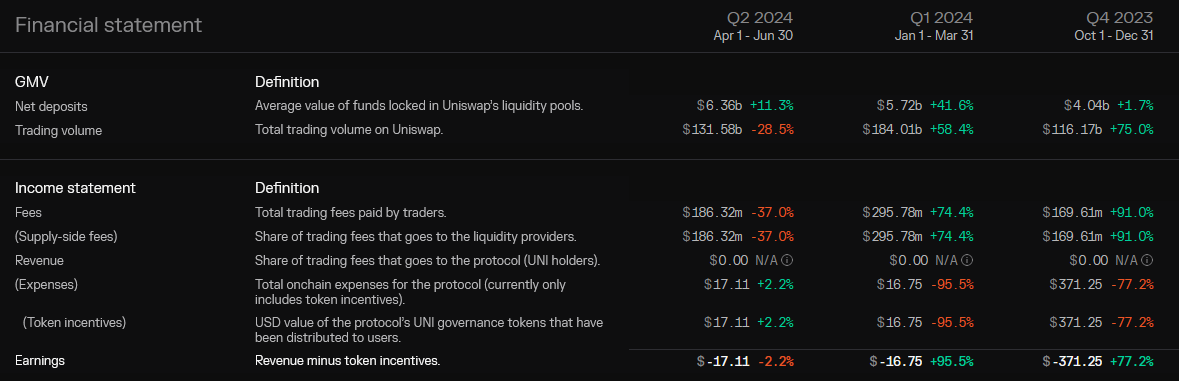
We have a new metric here, which is the confusingly-named GMV, or “Gross Merchandise Volume.” While this sounds like something a clothing manufacturer would measure, GMV is really just how much money is in their system. On a decentralized exchange like Uniswap, it’s their deposits and trading volume. With a lending company like Compound, it’s the value of their active loans.
The story: A mixed picture, with Uniswap deposits increasing to $6.36 billion, but trading volume down to $131 billion. Trading fees are down as a result; note that all the fees earned by Uniswap go to the liquidity providers (you can read more about LPs in our Investor’s Guide to Uniswap). As with bitcoin, UNI investors are betting on the company (i.e., that UNI price will rise), not on any payments to shareholders.
Understanding the Treasury
| Term | What it is | Public-company equivalent |
| Treasury | Funds set aside to grow the business | Retained earnings |
Forward-thinking crypto companies keep a “Treasury” – a bit like “retained earnings” for traditional companies – that can be used to grow the business.
You might use Treasury to create new developer incentives, fund related startups, pay executives, or anything else that might cost real money. (Even though it’s held in tokens, it can be converted into cash.) Communities usually vote on where to spend Treasury.
Here’s a look at Compound’s Treasury:
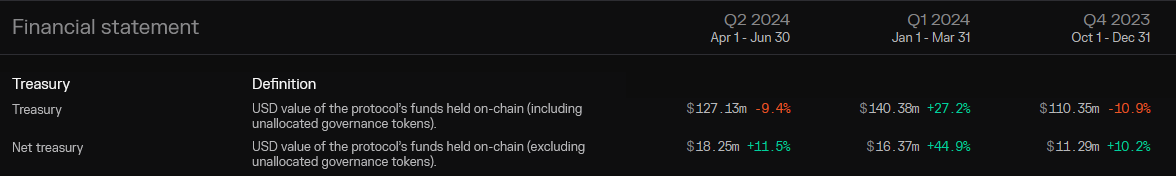
The story: When you see the Treasury growing from $110 to $127 million (top row, right to left), it paints a positive picture of a company that is making and saving money.
However, everything is affected by the macro market: when crypto is down, the demand for Compound loans is down. The same goes for the value of their Treasury: since it’s likely held in COMP tokens, the value of the token affects the value of the Treasury.
Which brings us to…
Understanding Market Data
You’re already familiar with “Price”: unfortunately, it’s the only metric most crypto investors use. (That’s why these reports are your secret weapon.)
Token Terminal gives you two market cap metrics, and the difference is how many tokens have been minted vs. how many have been promised:
- “Fully Diluted Market Cap” is the total value of the crypto company when all tokens are minted, according to their promised rules;
- “Circulating Market Cap” is the total value of all the tokens in circulation today.
“Trading Volume” shows you the value of tokens traded during the quarter, and “Tokenholders” tells you how many individual wallets hold the token (imperfect number, since people can hold more than one wallet, but probably close enough).
Here’s the Market Data for Balancer (BAL):
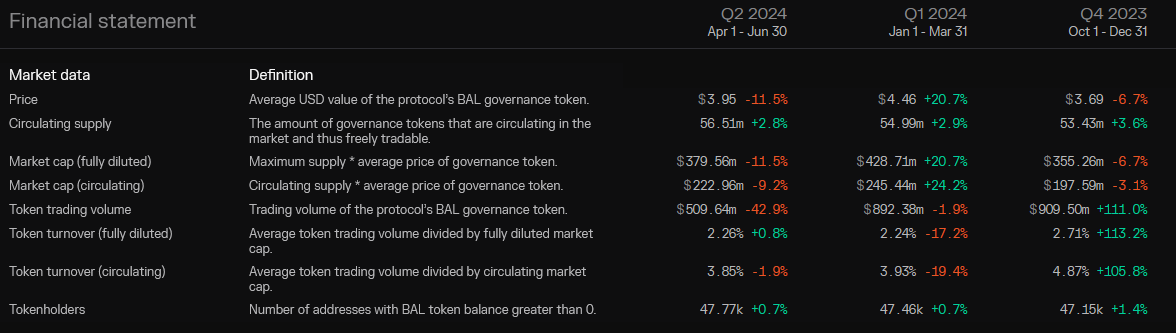
The story: The price of BAL has remained relatively flat over the last few quarters, as have the number of BAL tokenholders. There are roughly $223 million in tokens issued, out of $380 million that can eventually be minted. On the whole, BAL is not really moving up or down: it’s balanced.
Understanding Valuation Multiples
| Term | What it is | Public-company equivalent |
| P/F ratio (circulating) | Total value of all tokens, divided by fees (revenue) | P/E ratio |
In traditional investing, a valuation multiple is a ratio of one financial metric to another. They’re useful for comparing different companies, apples to apples.
Token Terminal reports list four valuation multiples:
- P/F ratio (fully diluted): Fully diluted market cap / annualized fees.
- P/F ratio (circulating): Circulating market cap / annualized fees.
- P/S ratio (fully diluted): Fully diluted market cap / annualized revenue.
- P/S ratio (circulating): Circulating market cap / annualized revenue.
The most helpful here is probably P/F ratio (circulating), which gives you the total value of all tokens, divided by the fees (or revenue) generated. Think of this like P/E ratio in traditional investing.
(Technically it should be called “T/F ratio,” for Tokens/Fees, but I guess they’re trying to match the “P/E ratio” of traditional earnings.)
The rule of thumb is that stocks with higher P/E ratios may be overvalued, while those with lower P/E ratios may be undervalued. As value investors, we hope to buy good companies with lower P/E ratios: these are the “hidden gems.”
Here are the valuation multiples for Lido (LDO):
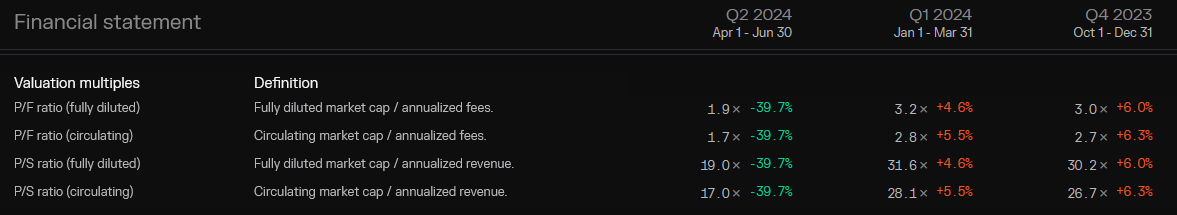
The story: Lido declined from a 3.2x P/F ratio to a 1.9x P/F ratio, and is therefore potentially a better bargain. It suggests that the market is now valuing Lido at a lower multiple of its fees than previously. It’s also remarkably low compared to many other crypto projects (Ethereum, for example, is selling at a 175x P/F ratio).
Understanding Alternative KPIs
Finally, the Alternative KPIs gives you key information to gauge the health of the business:
“Daily Active Users” is like the number of loyal customers. DAU is one of the most important metrics in blockchain, due to network effects. (Please read our piece on Daily Active Users.) Note that Token Terminal reports active users by day, week, and month. More = better.
“Active Developers” and “Code Commits” shows you how many people are actually behind these projects. Think of this like the size of the tech team, and how many big updates they are making each quarter.
Let’s compare these metrics for bitcoin and Ethereum:
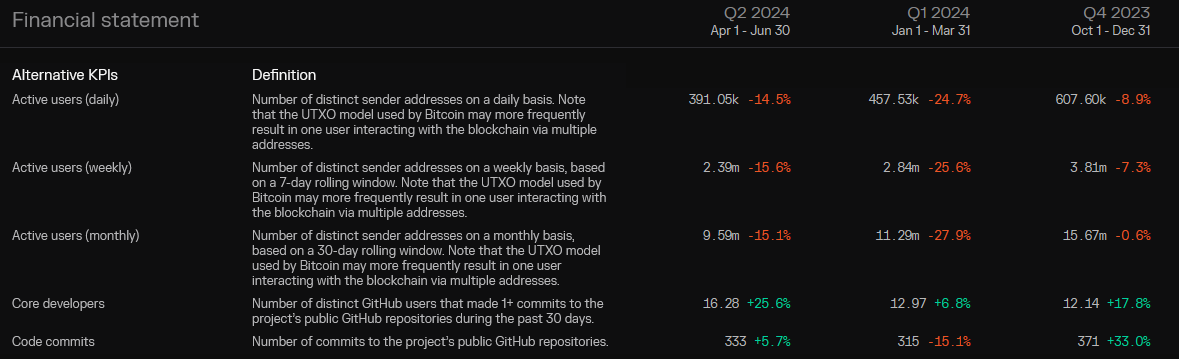
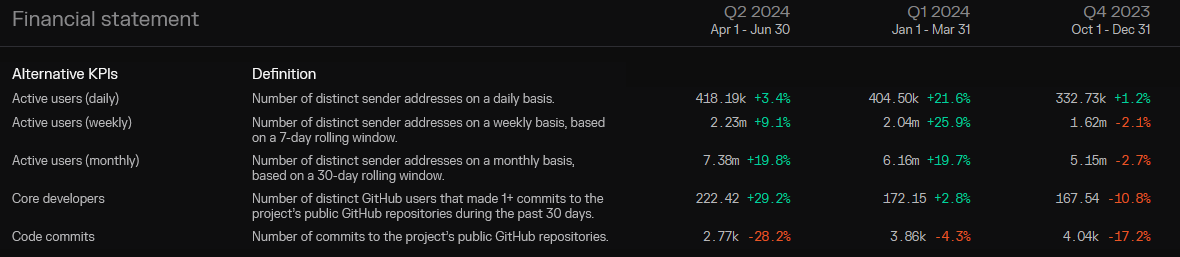
The story: Active users for bitcoin have been on the decline over the last three quarters, while Ethereum’s DAUs are going up. This might reflect that more people are HODLing bitcoin as a long-term store of value, but it’s definitely good news for Ethereum, as more active users = more value.
You’ll also be surprised to learn that bitcoin had only 16 active developers last quarter, while Ethereum had 222. The team made just 333 changes (code commits) for bitcoin, versus 2,770 for Ethereum. This paints a picture of Ethereum as a growing, vibrant ecosystem, with bitcoin a tiny squad of developers keeping the lights on. (And as the Wall Street Journal reported, this is indeed the case.)
Putting it All Together
These financial reports are a significant milestone for the crypto industry. They’re not perfect. They could be more intuitive. But they’re the start of something really great: a picture of financial health over time.
No more do we have to rely on hype and headlines to make investing decisions: we can now evaluate the businesses ourselves, using reason and reporting over FUD and FOMO.
These reports are still a work in progress, since there are no Generally Accepted Accounting Principles (GAAP) for crypto. In fact, most people won’t even admit that cryptos are companies. Which is why these reports are a godsend for the serious crypto investor.
We’ve been saying for years the obvious truth: even if they’re not technically companies, we can think of cryptos like companies. With these new financial reports, we now have a powerful new tool to evaluate their corporate performance.
They’re the crypto investor’s secret weapon.
- SEO Powered Content & PR Distribution. Get Amplified Today.
- PlatoData.Network Vertical Generative Ai. Empower Yourself. Access Here.
- PlatoAiStream. Web3 Intelligence. Knowledge Amplified. Access Here.
- PlatoESG. Carbon, CleanTech, Energy, Environment, Solar, Waste Management. Access Here.
- PlatoHealth. Biotech and Clinical Trials Intelligence. Access Here.
- Source: https://www.bitcoinmarketjournal.com/how-to-read-crypto-financial-statements/

