Executive Summary
- Bitcoin has broken above the psychological $40k level, posting an impressive +140% year-to-date return, and firmly outperforming its hard money analogue, Gold.
- Compared to previous cycles, the BTC return profile is eerily similar to the 2015-17 and 2018-22 cycles in terms of recovery duration, and drawdown since the ATH.
- With such an impressive year for Bitcoin, a super-majority of Bitcoin investors are now back in the black, with several metrics crossing into ‘enthusiastic uptrend’ territory.
Bitcoin crossed over the $40k mark to open December, providing another reminder of just how remarkable 2023 has been for the asset. In this week’s edition, we will compare the relative performance of Bitcoin to other assets in 2023, and in past cycles. We will also assess on-chain indicators related to the investor response to yet another powerful week in the market.
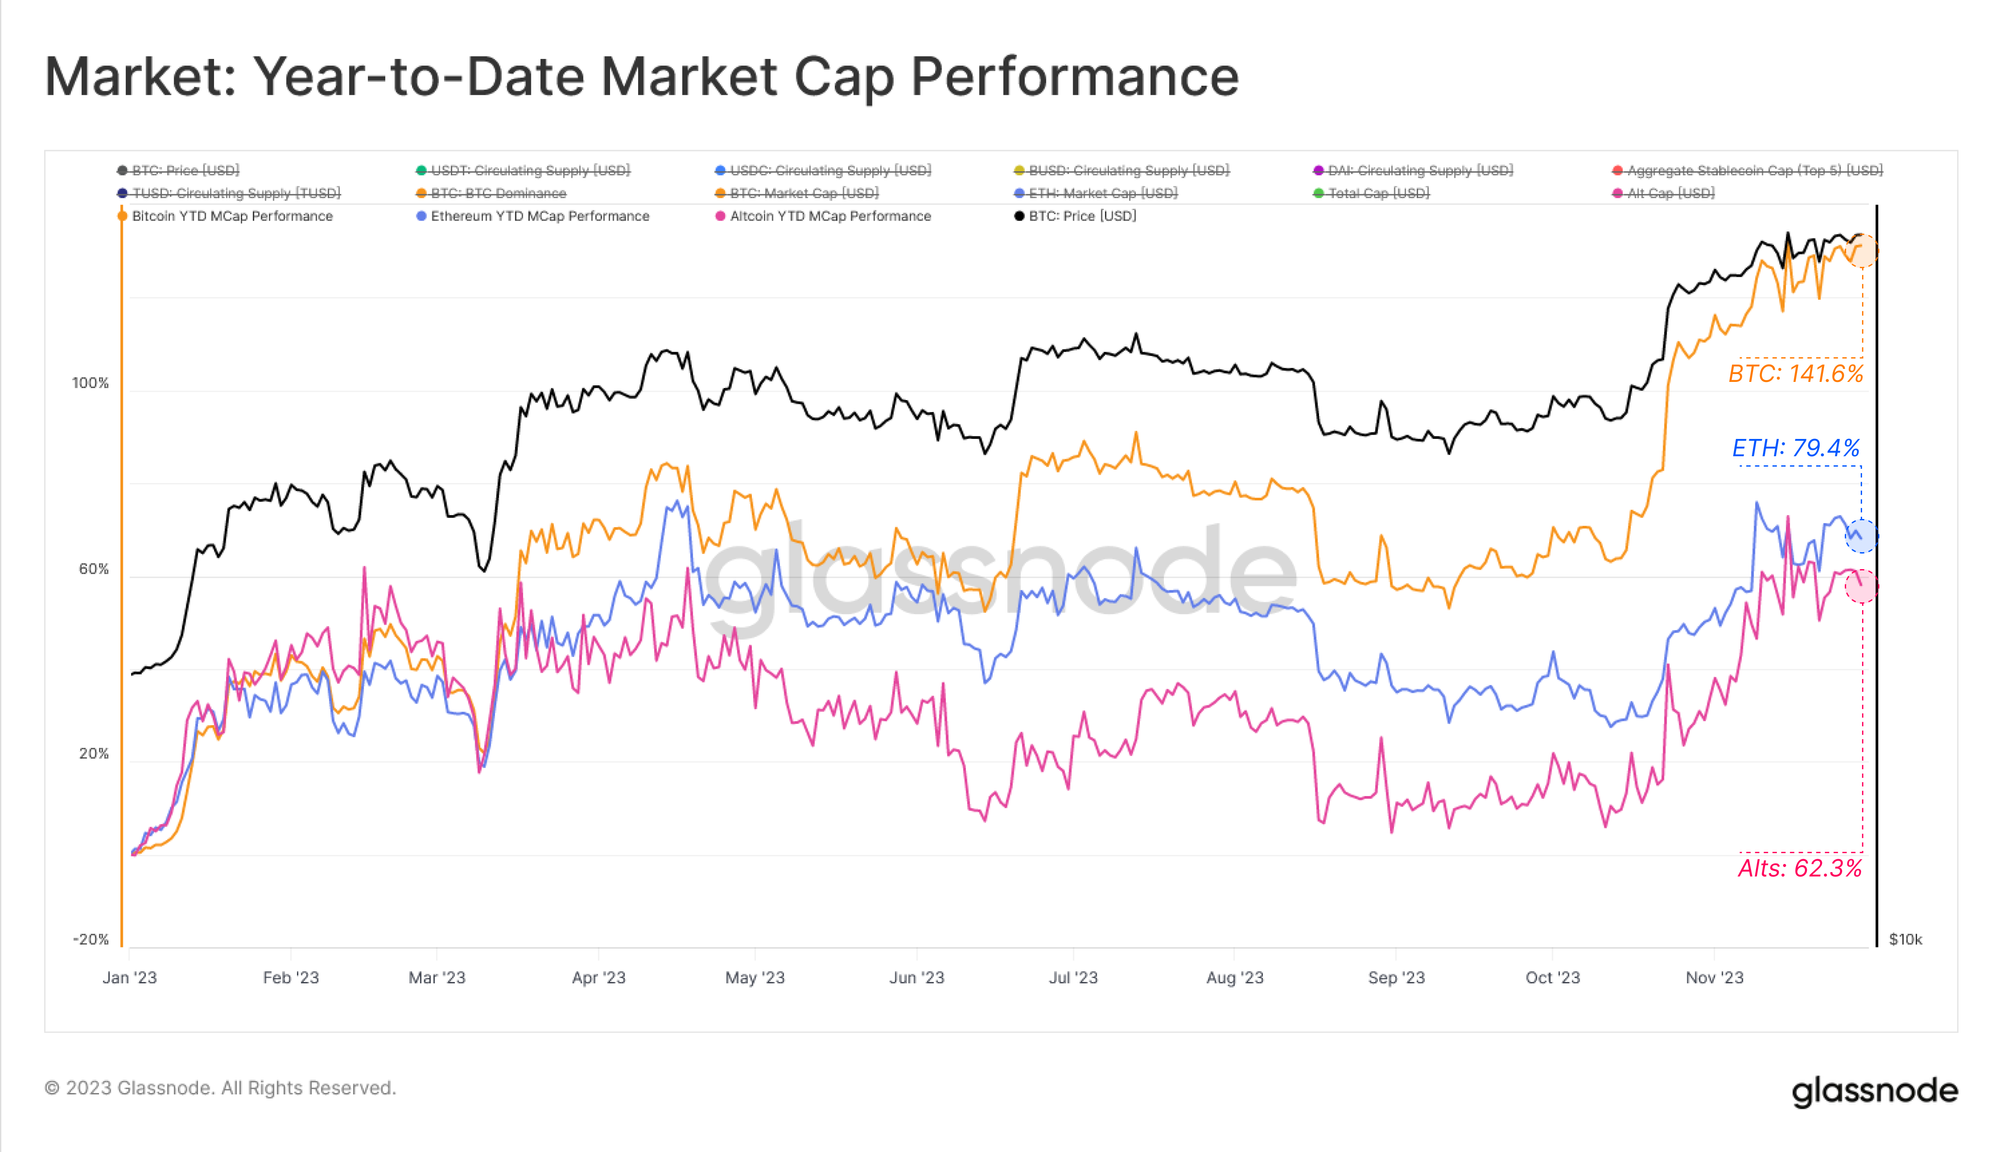
Of note, Gold also pushed to new all-time-highs over $2,110 relative to the USD this week, setting a new historical high against all fiat currencies. Indexed to the start of the year, BTC has outperformed both USD and Gold denominators:
- 🟠 BTC vs USD: +141.6%
- 🟡 BTC vs Gold: +106.6%

Bitcoin has consistently posted the strongest performance amongst the digital asset ecosystem this year as well, with Ethereum and wider Altcoin sectors only experiencing an uptick in relative strength over recent months. The total YTD growth in the market cap for these sectors is impressive:
- 🟠 Bitcoin: +141.6%
- 🔵 Ethereum: +79.4%
- 🔴 Altcoins (excl ETH and Stablecoins): +62.3%
🛠️
Workbench Tip: This chart indexes prices to the 1-Jan-2023 by using the value_at(m1,”2023-01-01″) function, returning price at the reference date.
Market performance for BTC since the cycle high is also strikingly similar to both the 2013-17 and 2017-21 periods. Note that here we use the April 2021 market top as the cycle peak, which we argue is a better reference point for comparing cycle duration. This is on the basis of a very broad spectrum of metrics which signalled that this was the zenith in market sentiment, adoption rates, and investor confidence (see WoC-4 from Jan 2022 titled Sizing Up a Bitcoin Bear).
- 🔴 2013-17: down -42% from ATH
- 🔵 2017-21: down -39% from ATH
- ⚫ 2021-23: down -37% from ATH
🛠️
Workbench Tip: This chart uses a combination of subset and shift functions to isolate price over a specified date range, and then shift traces to the same starting x-ordinate.

If we assess cycle performance from the opposite extreme, the cycle low, we see similar points of comparison with the 2015-18 and 2018-22 cycles. BTC prices are up +146% since the FTX lows set in November 2022, making for the strongest ~1yr returns out of the last two cycles. Overall performance remains very much in line with past cycles over the same recovery duration.
- 🔵 2015-18: +119%
- 🟢 2018-22: +128%
- ⚫ 2022-23: +146%

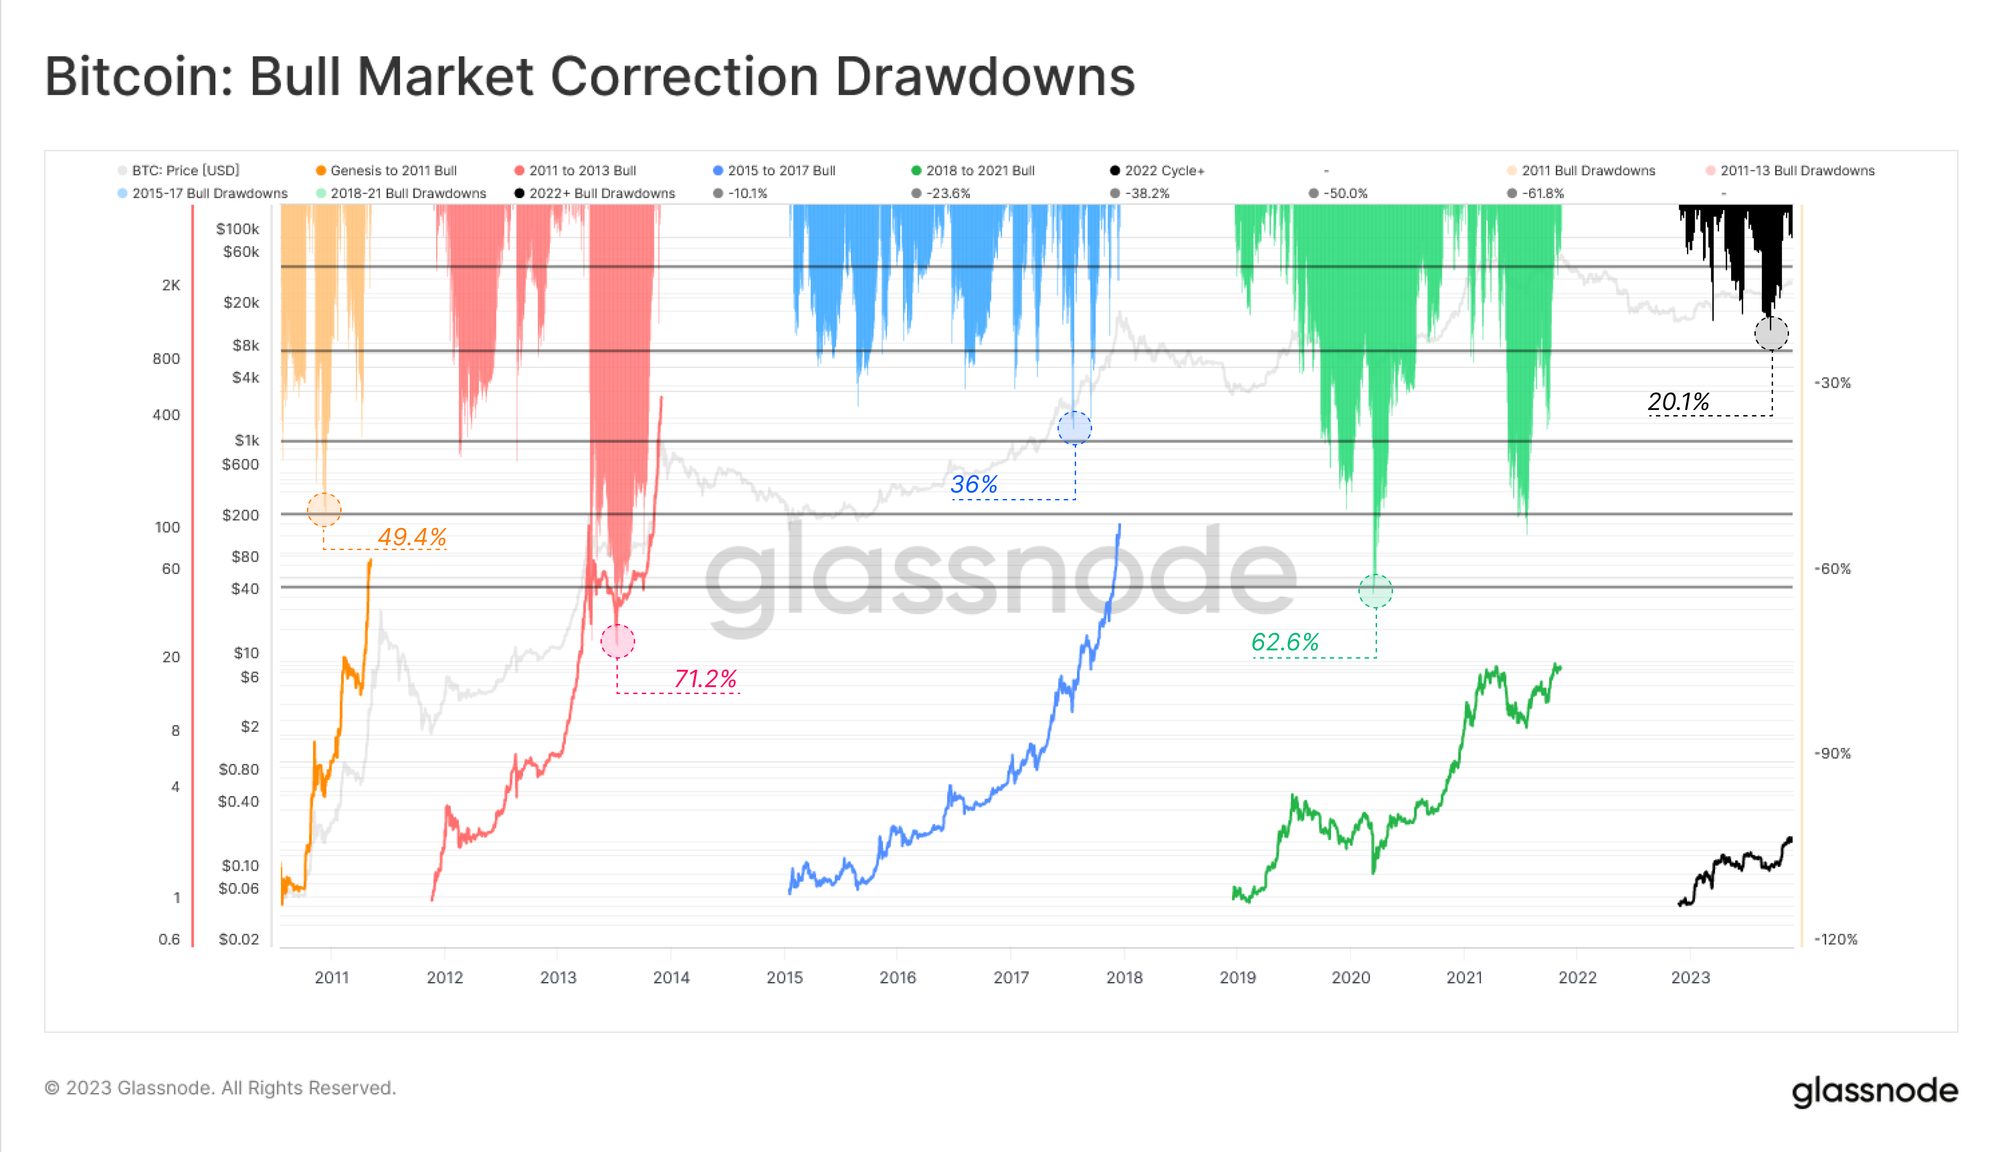
Another framework for considering the relative strength of this uptrend is to measure the depth of pullbacks from the most recent local high. The deepest correction in 2023 has been a remarkably shallow -20.1%, standing out as the shallowest of any historical macro uptrend.
The 2016-17 bull market saw regular corrections exceeding -25%, whilst 2019 pulled back from the July-2019 high of $14k by over -62%. This suggests a level of underlying demand support in 2023 which aligns with the increasingly tight supply dynamics we covered in WoC-45 and WoC-46.
📊
An Uptick in Exchange Activity
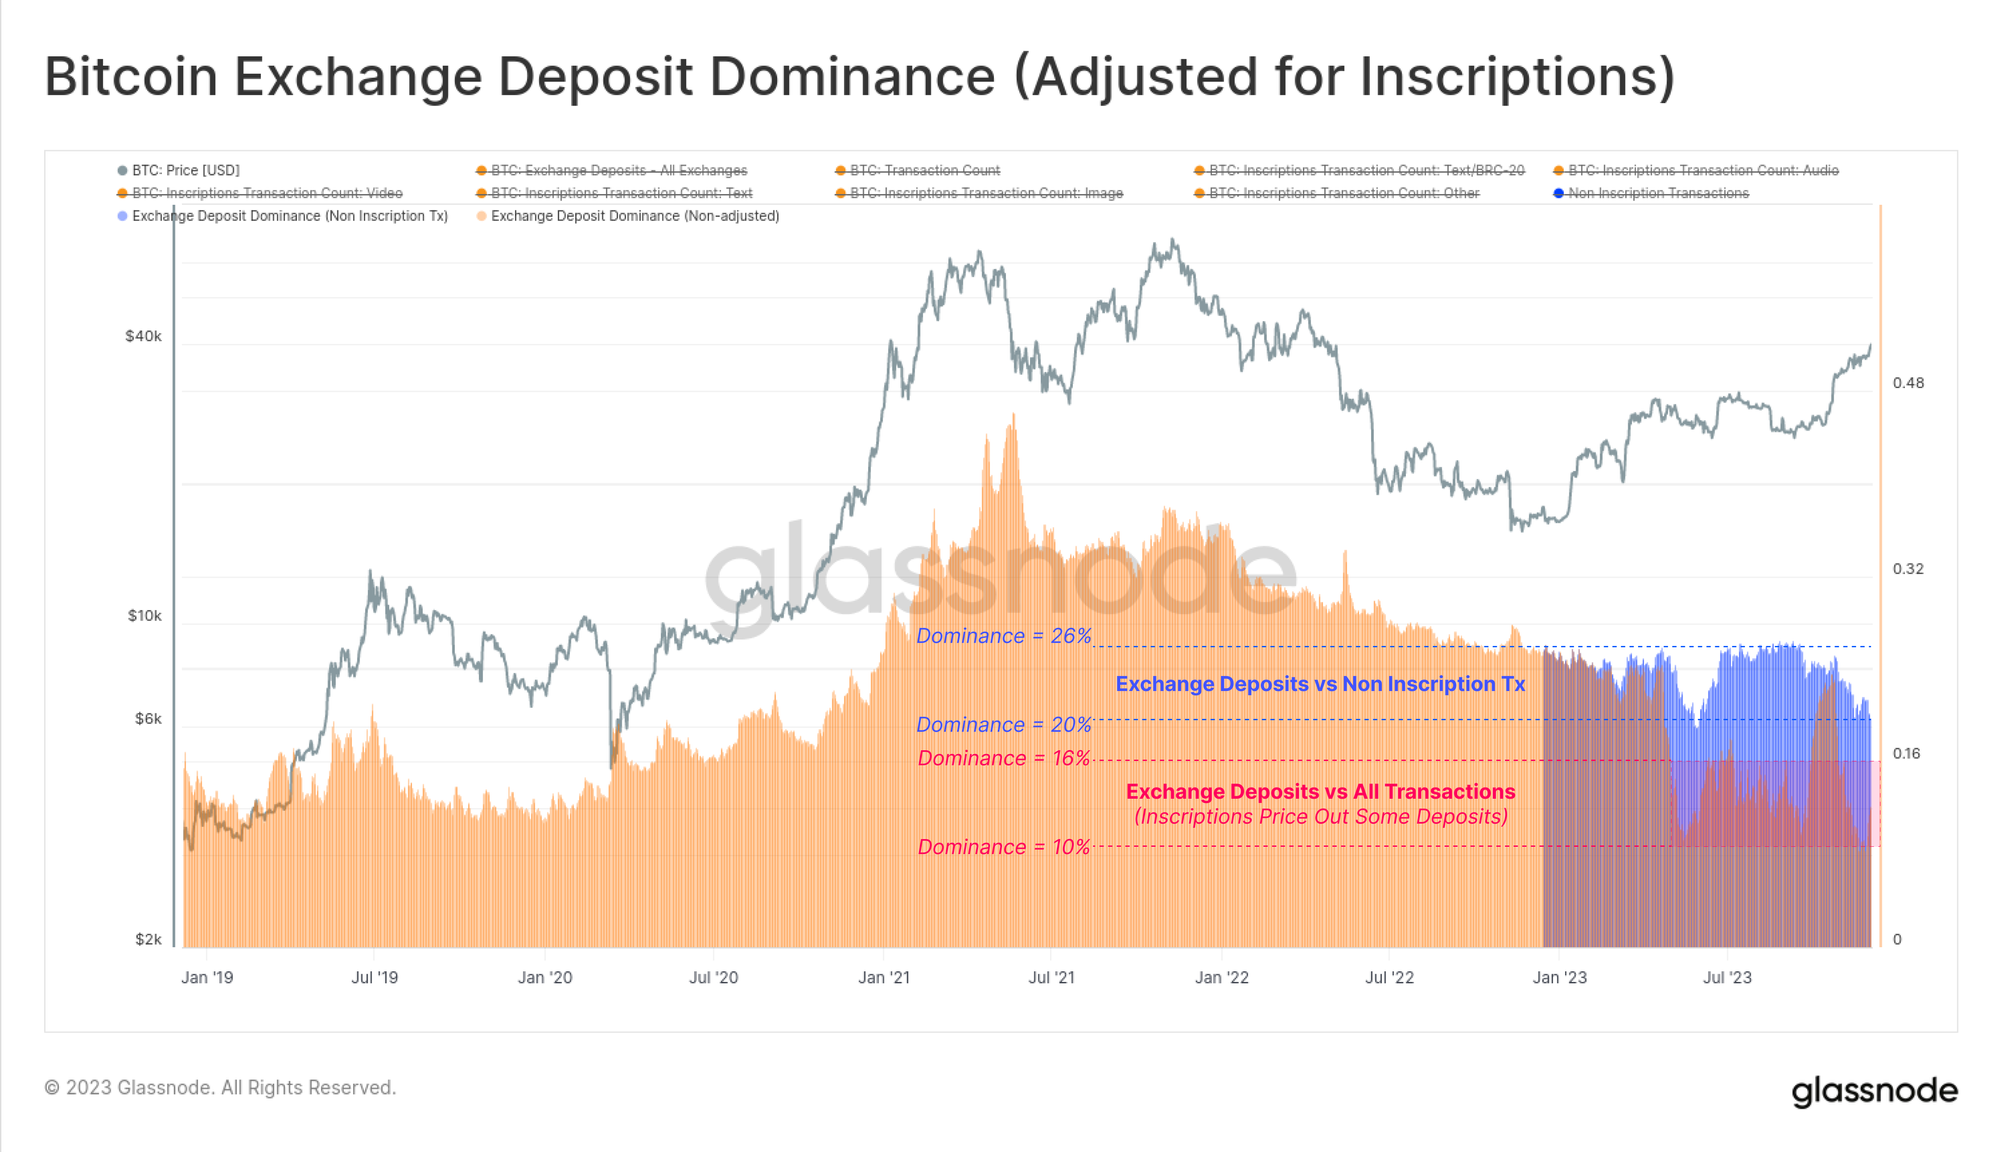
Following periods of impressive performance, it becomes prudent to monitor transactions related to Exchanges, seeking any notable deviations in activity or capital flows. Despite a strong year thus far, the number of transactions depositing funds to Exchanges continues to plummet to multi-year lows, making for a counter intuitive observation.

However, unlike prior cycles, we must now consider transaction counts within the context of a new buyer of blockspace: Inscriptions. Since each Bitcoin block has a constrained block-space data limit, periods where Inscriptions are paying higher fees can ‘price out’ exchange deposits which are paying lower fees.
If we look at Exchange Deposits as a percentage of all transactions 🟠, it would suggest they have dropped from around 26% in May to just 10% today. However if we adjust for Inscriptions, comparing deposits only to non-inscription transactions 🔵, we see the decline is more modest to around 20%.
This suggests that Inscriptions are currently willing to pay a higher priority fee than Exchange related deposits.
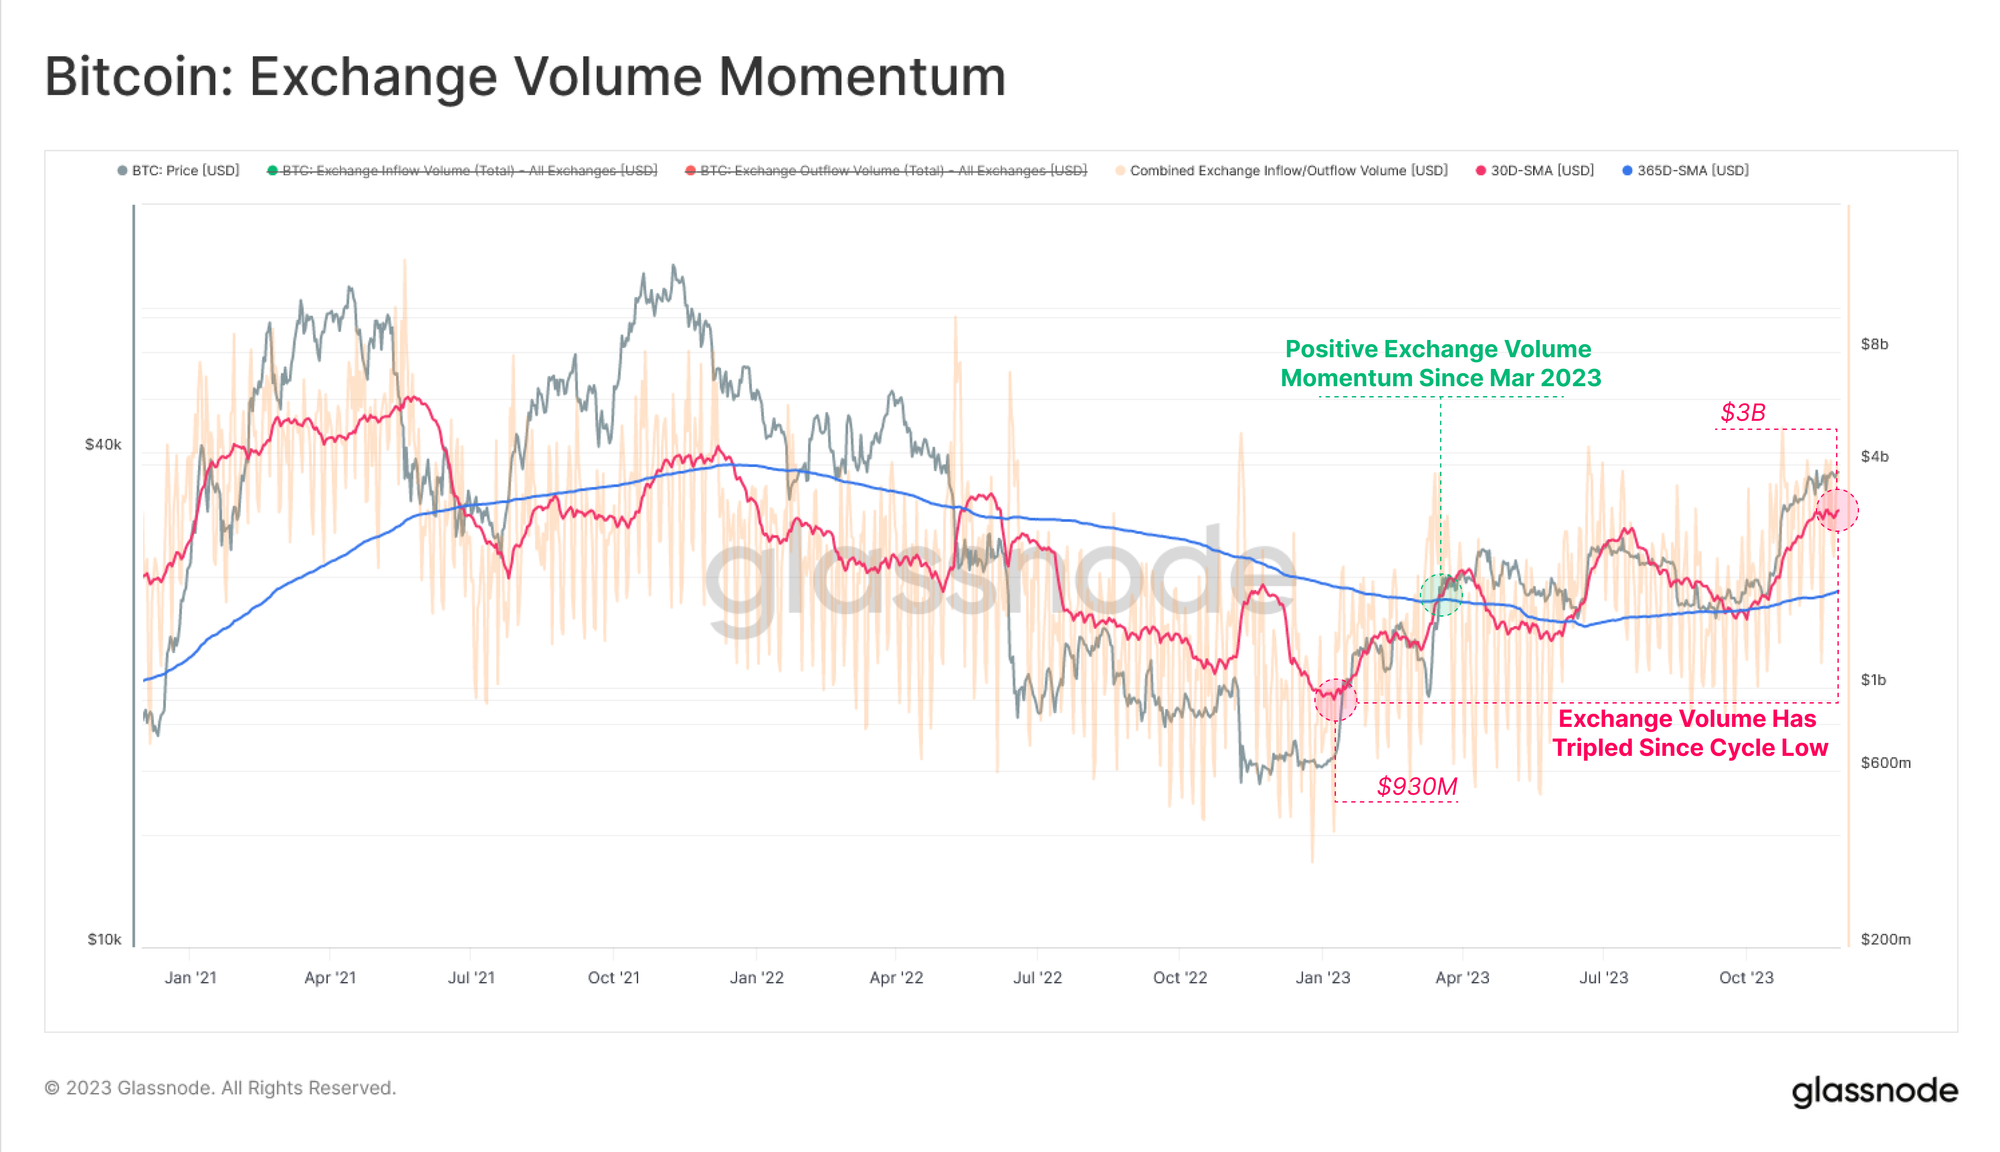
Looking at this from the on-chain volume domain, we can see that YTD flows in and out of Exchanges has grown considerably from $930M to over $3B (+220%). This underscores an expanding interest from investors to trade, accumulate, speculate and otherwise utilze exchanges for their services.
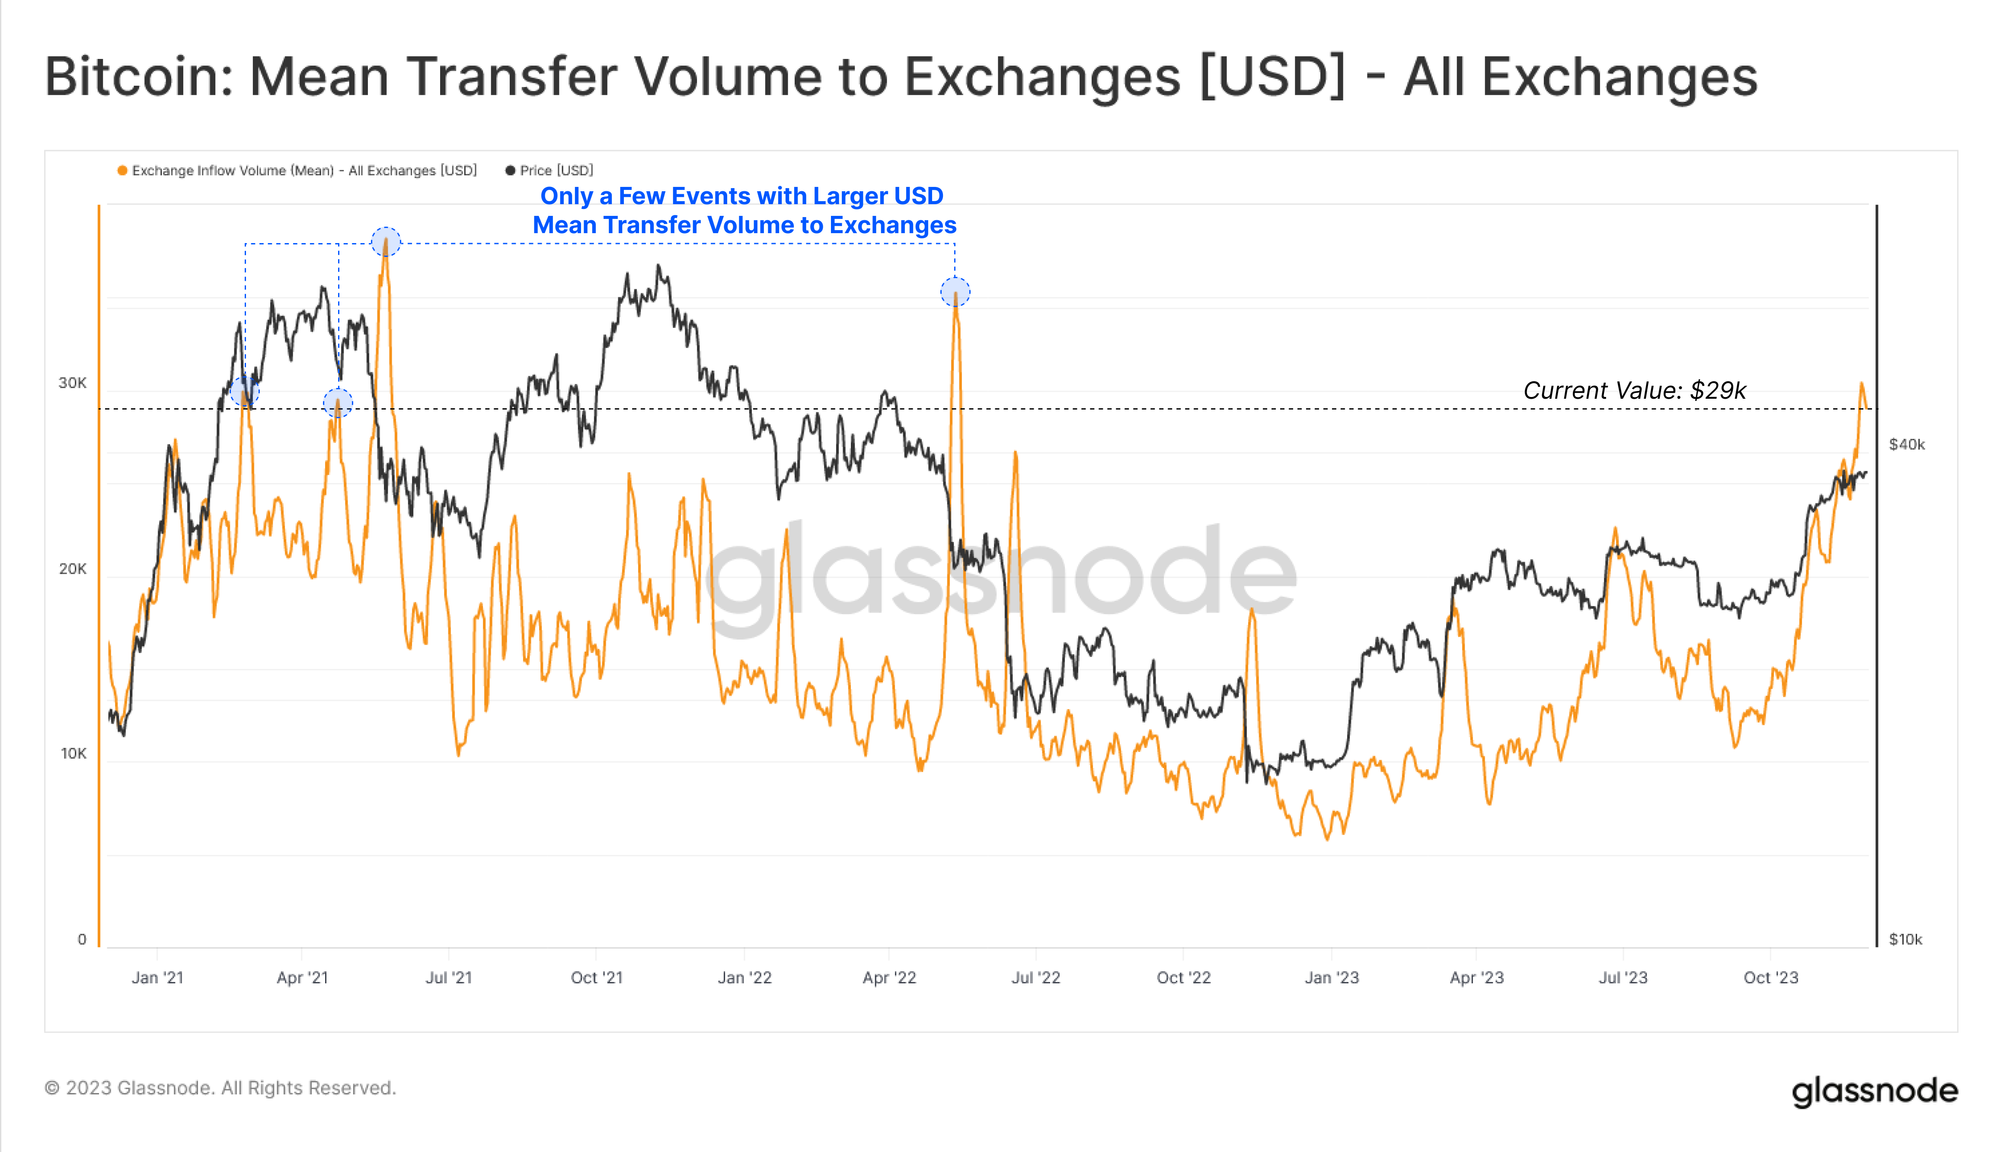
With a such a large uptick in Exchange volumes, an interesting observation emerges from analysis of the average size of a deposits to Exchanges. This metric has experienced a non-trivial rally, climbing just shy of the previous ATH of $30k per deposit.
From this it appears that exchange deposits are currently dominated by investors moving increasingly large sums of money. This is potentially a sign of growing institutional interest as key ETF decision dates approaches in January 2024.
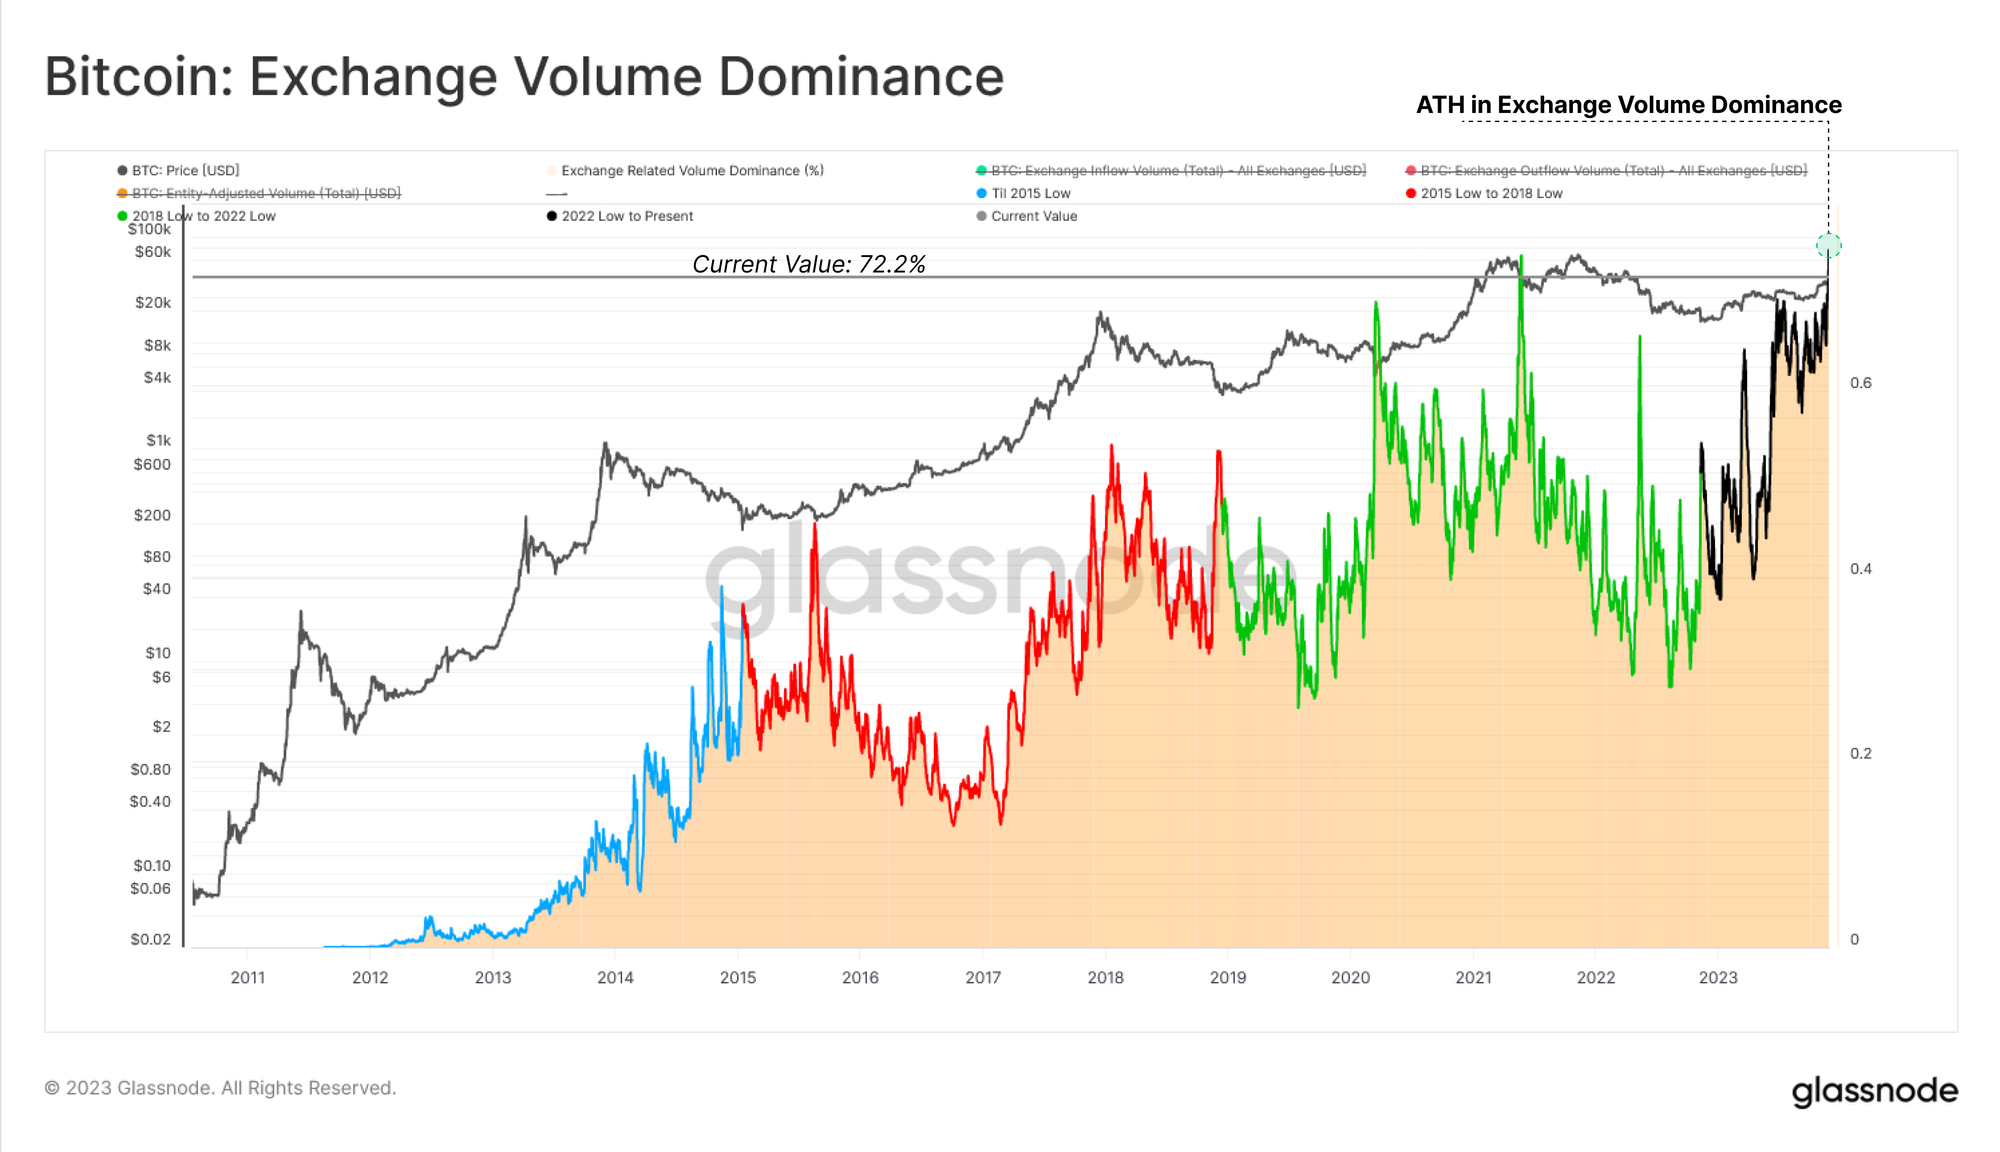
Whilst the number of transactions to and from Exchanges is relatively low, volumes flowing in/out are responsible for 72.2% of all on-chain volume, on par with the previous ATH. This emphasizes how a substantial proportion of on-chain throughput is related to exchange activity, as investors deposit and withdraw in increasing size and volume.
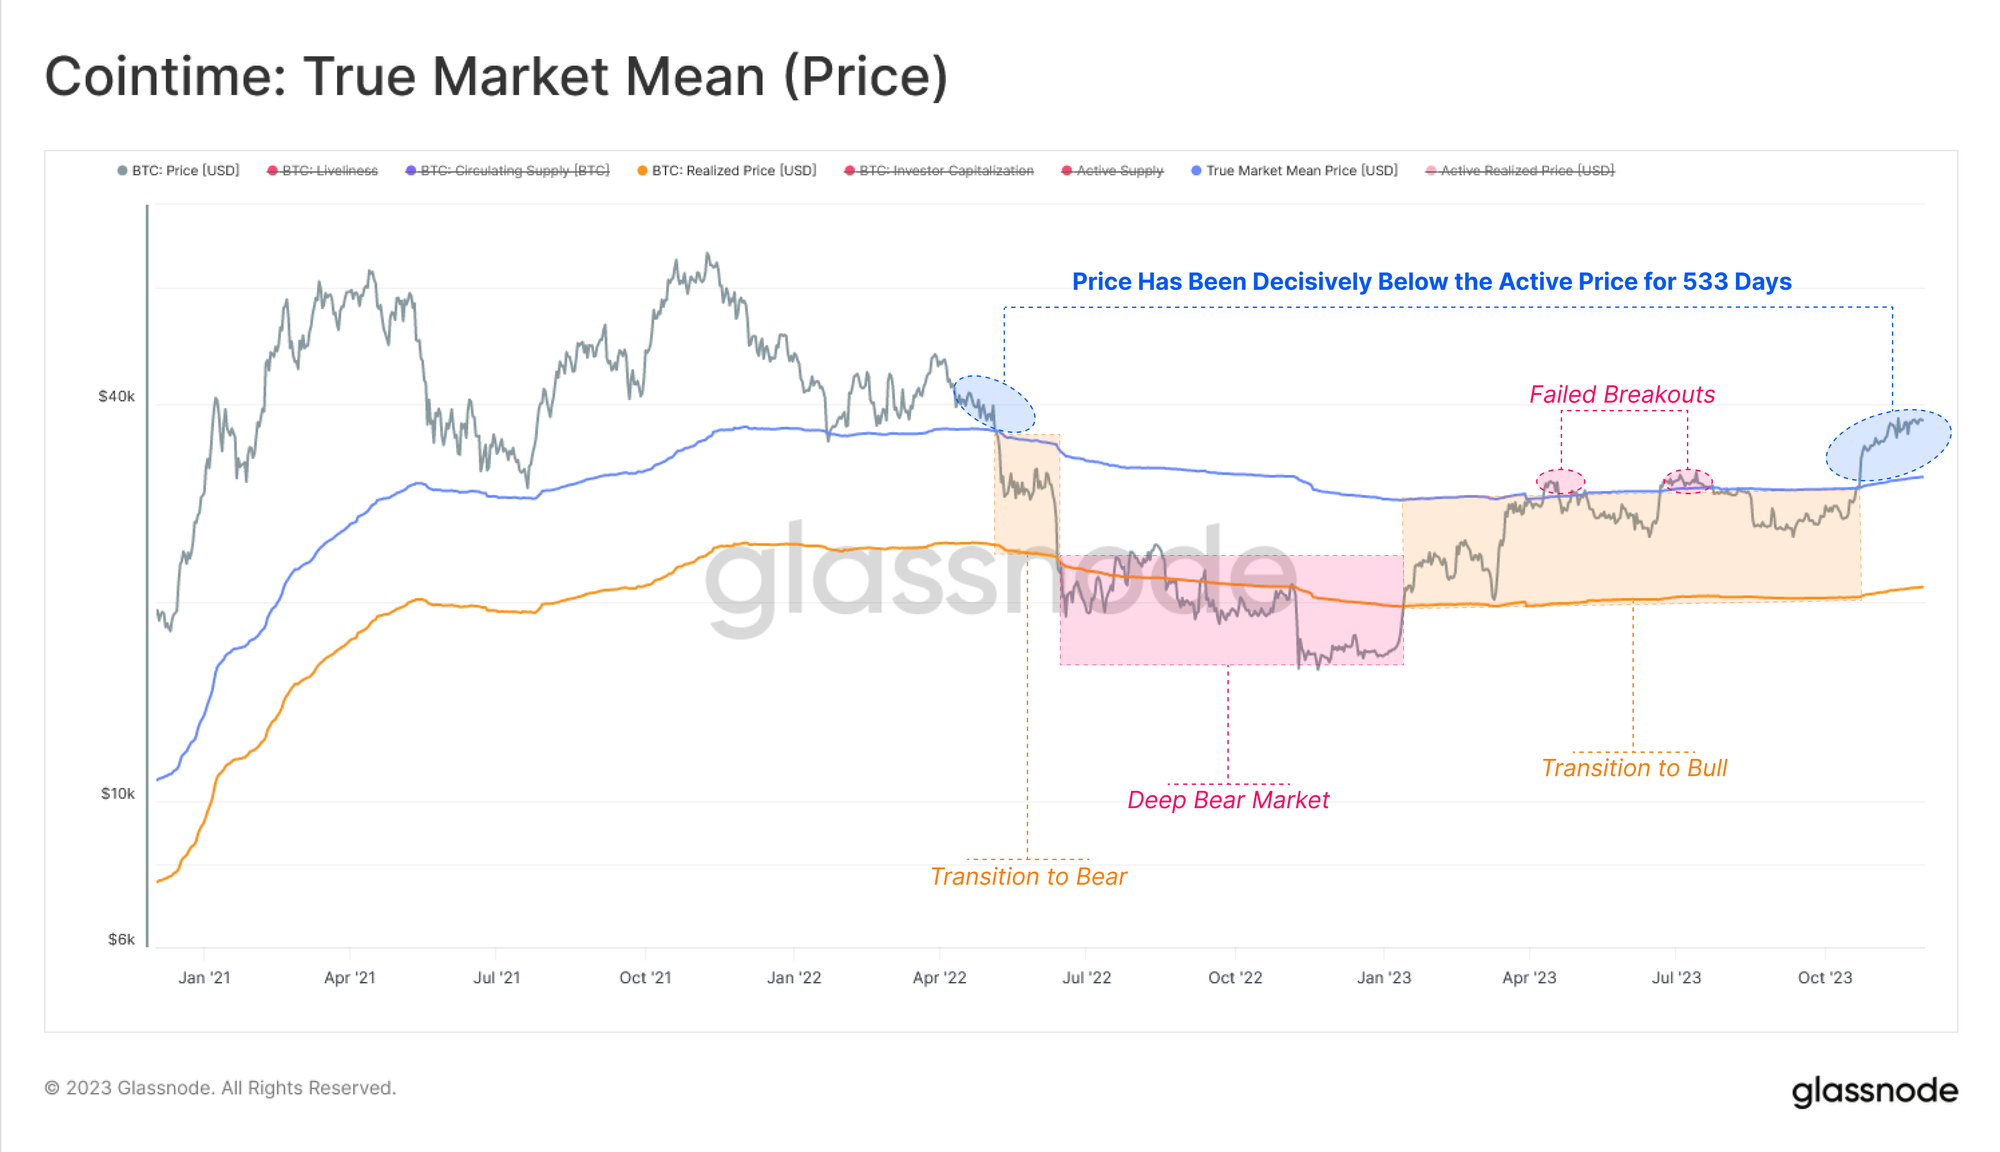
The 2023 rally has pushed Bitcoin’s price decisively above two key on-chain pricing levels:
- The Realized Price in January, putting the average unit of BTC into profit (includes ancient and lost coins).
- The True Market Mean Price in October, putting the average active investor back into profit.
With the market now trading meaningfully above the True Market Mean Price ($31.0k), the majority of Bitcoin holders will have seen their portfolios recover from the 2022 bear market. Historically this has signalled a constructive transition towards a more enthusiastic bull market.
🕰️
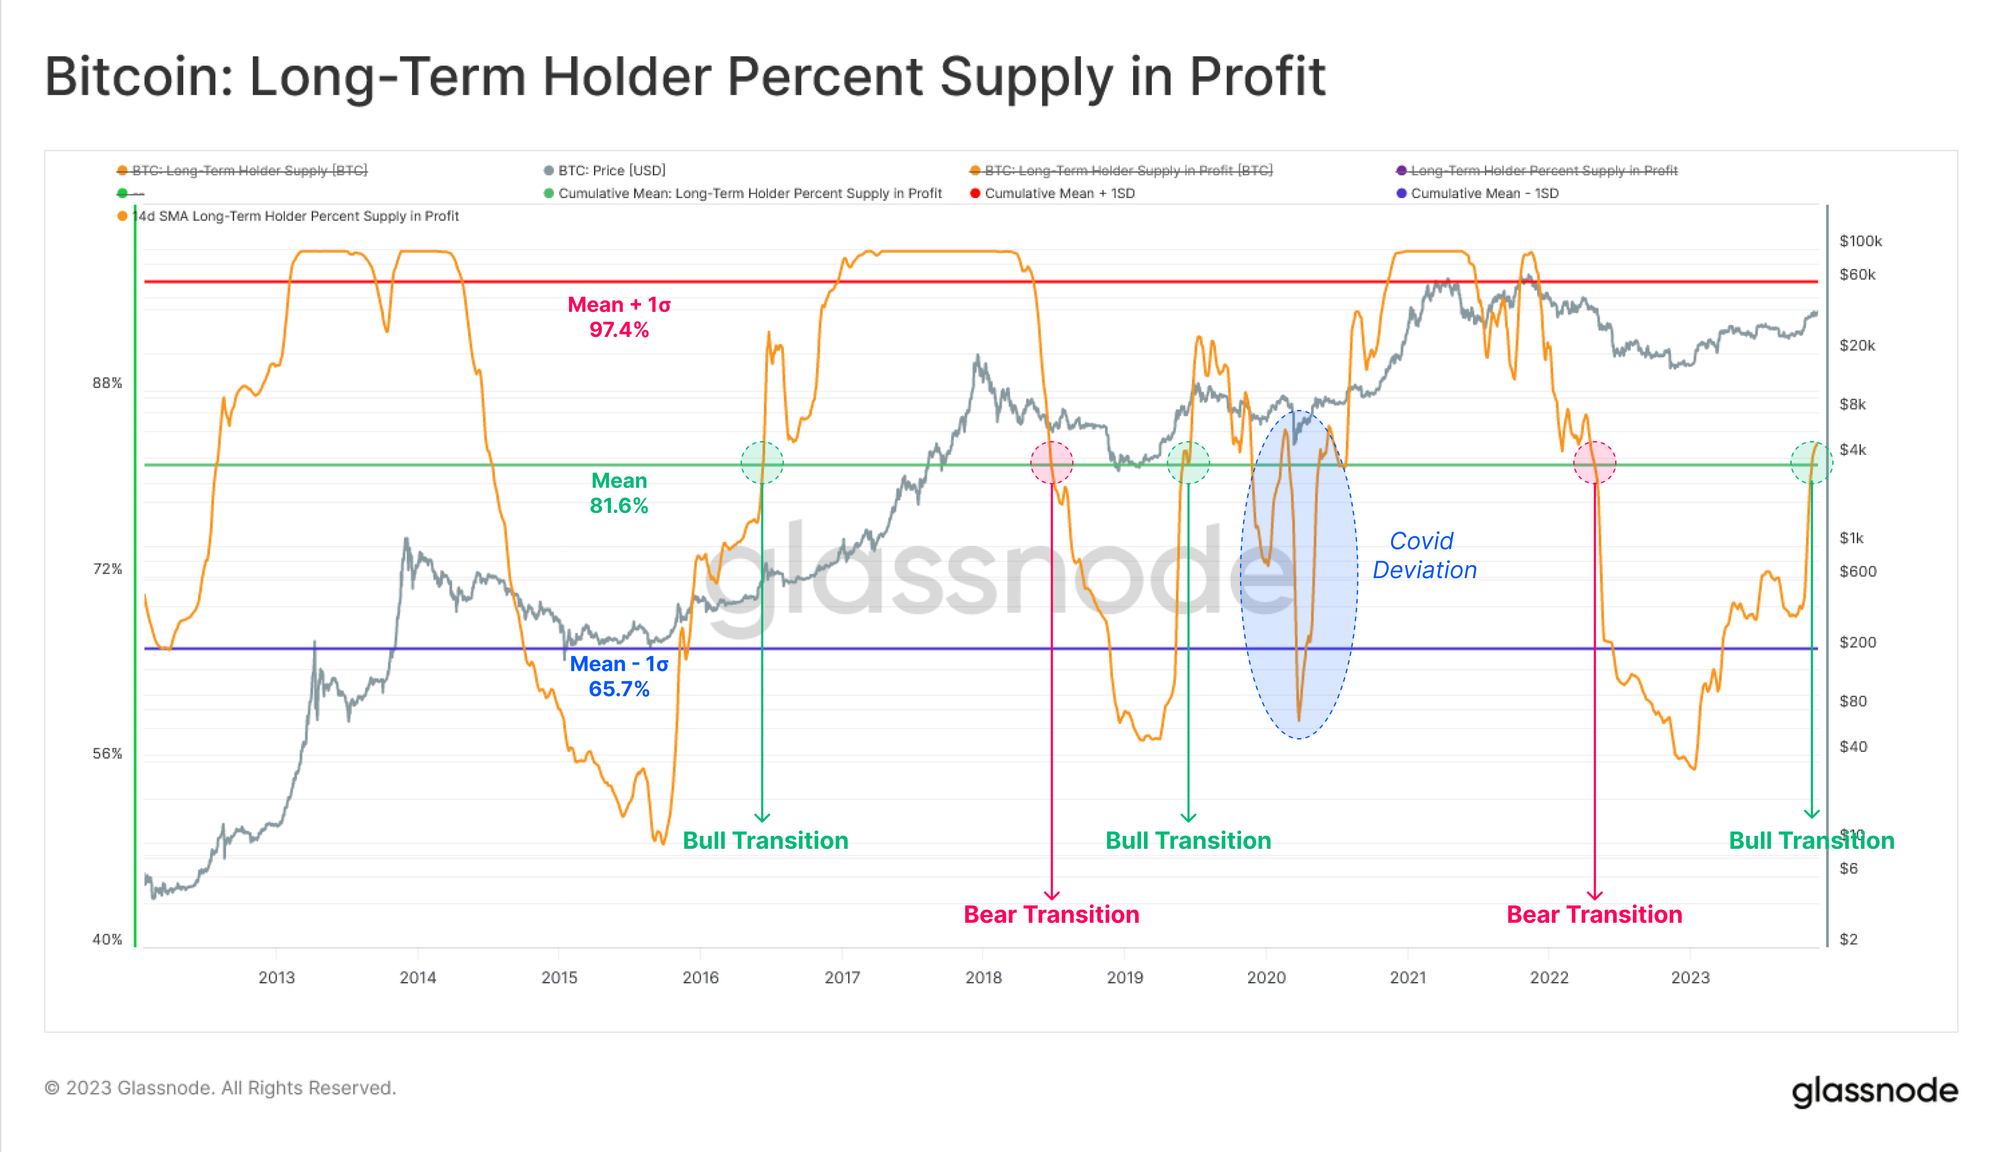
From the perspective of Long-Term Holders, the YTD rally has seen the proportion of their holdings held in profit increase from 56% to 84%. This has broken above the all time average value of 81.6%.
Previous breakouts above this level have historically aligned with a transition towards strong up-trending markets, providing confluence with the above observation.
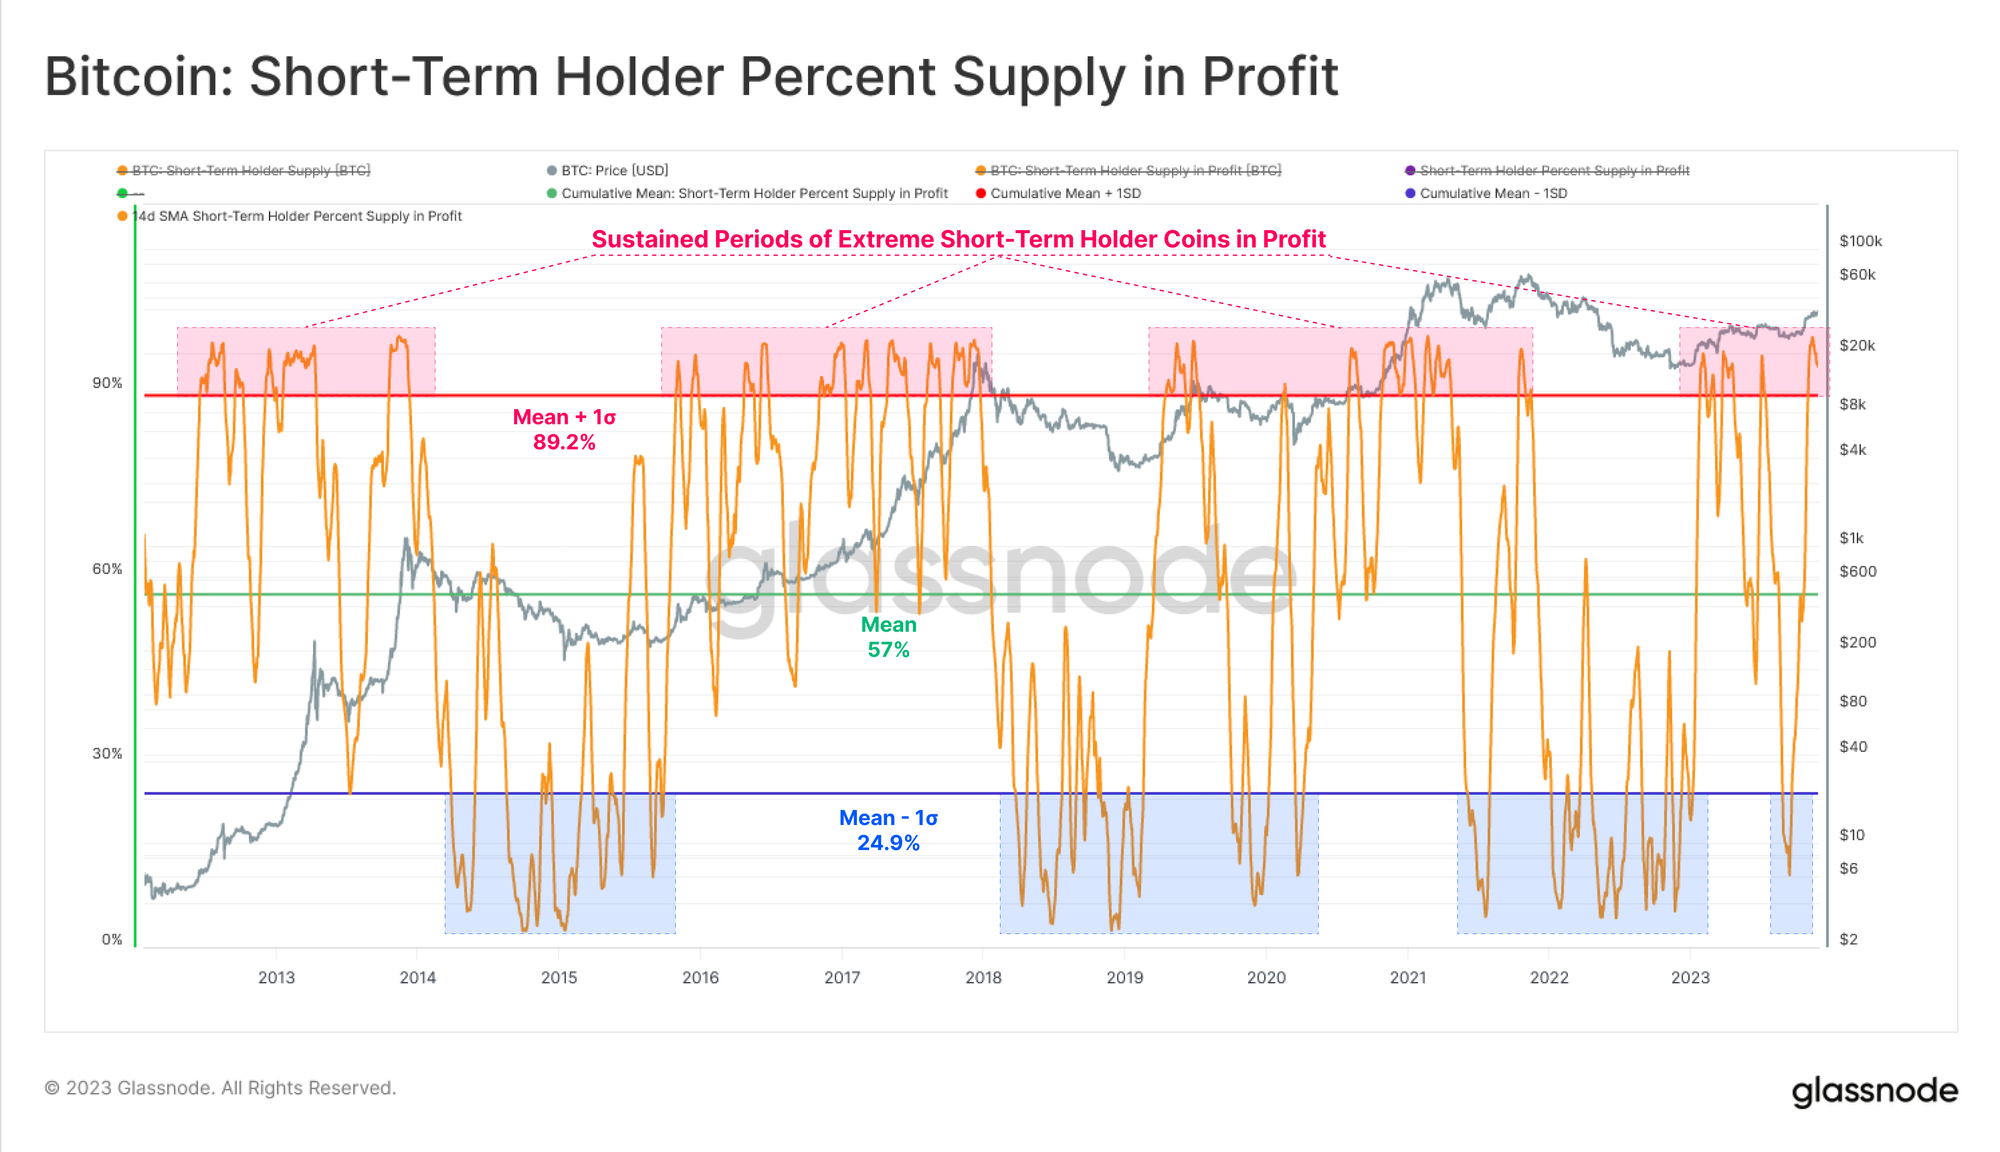
The Short-Term Holder cohort are almost entirely in profit, with over 95% of their holdings sporting a cost basis below the current spot price. This reading is above the long-term +1 standard deviation level for this metric, and is again historically associated with enthusiastic uptrends.
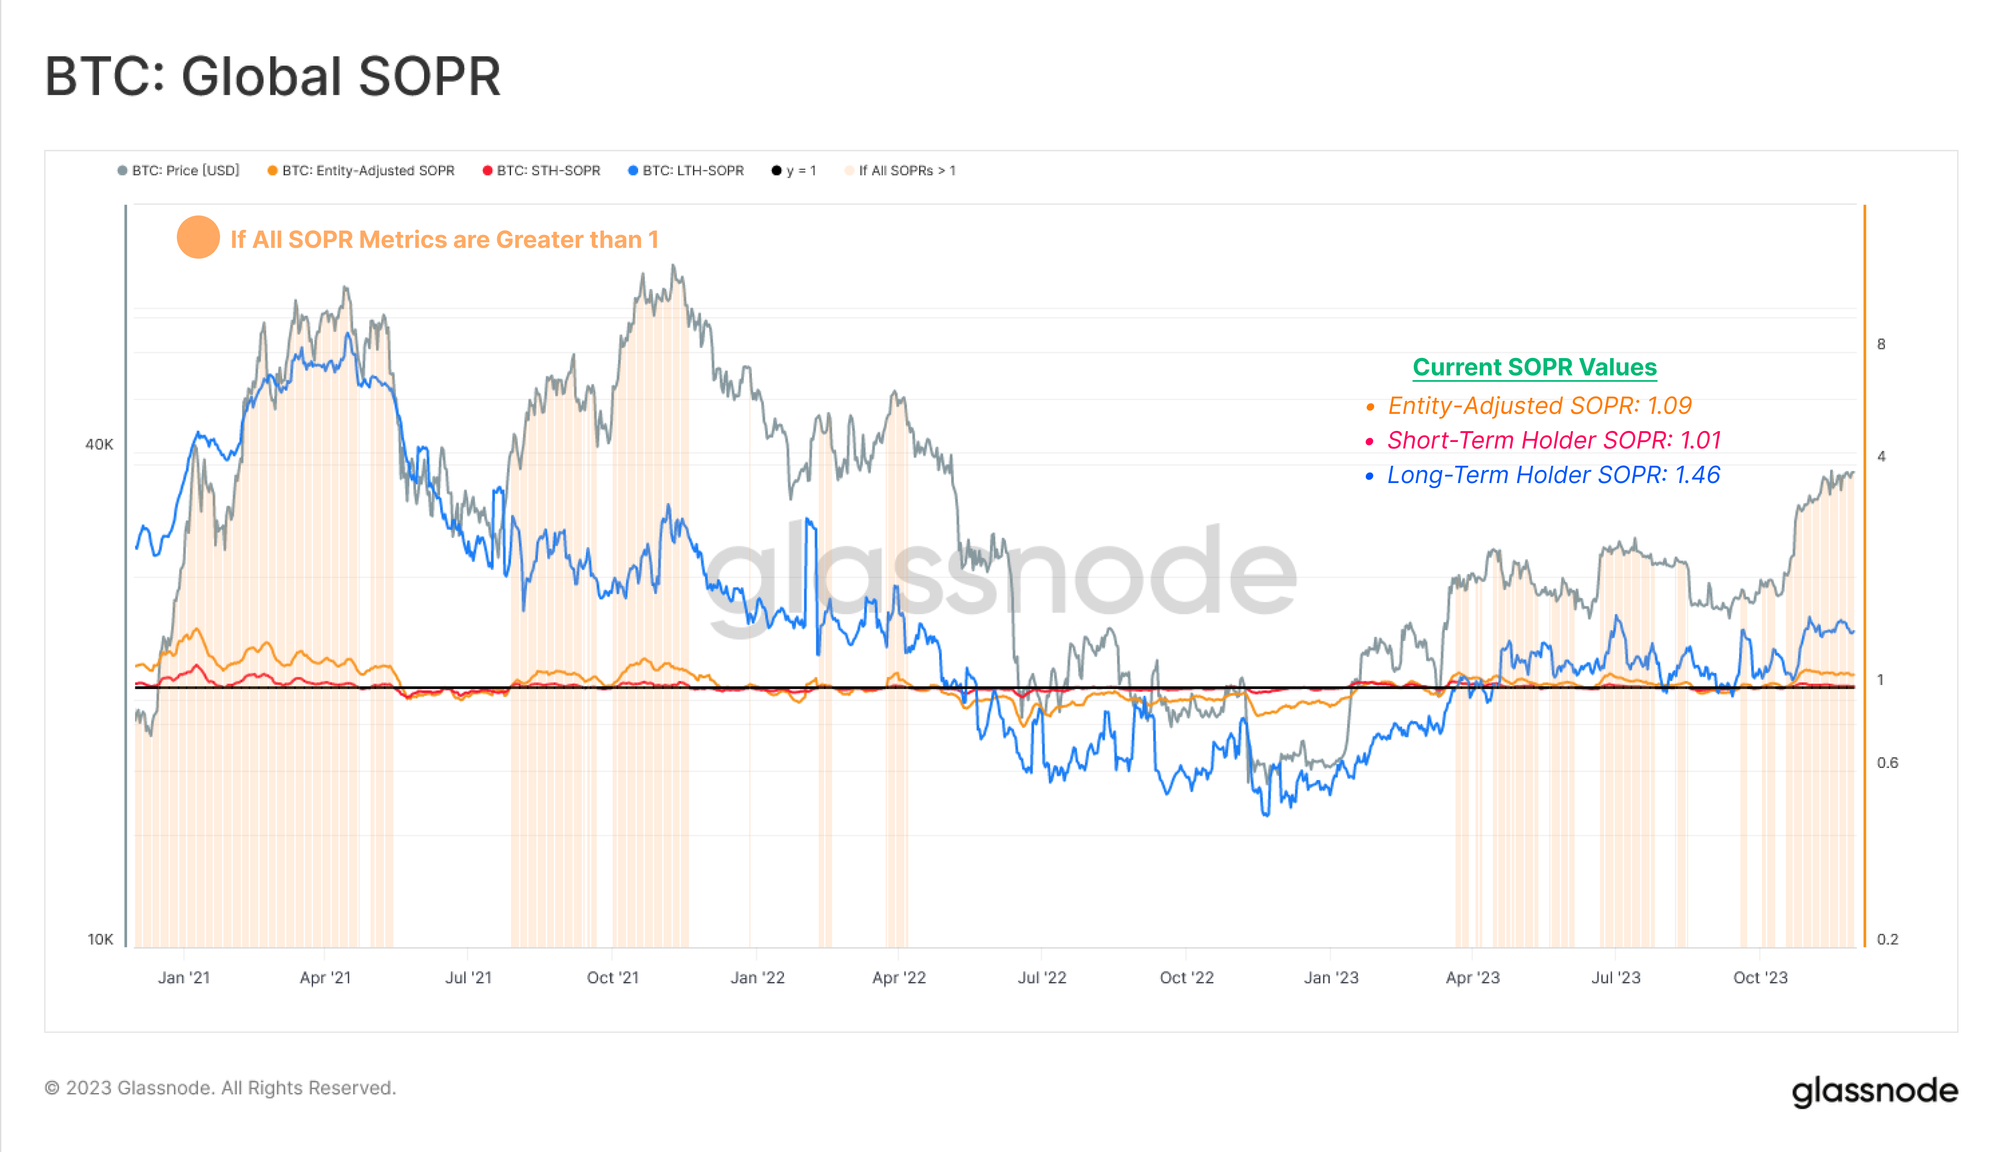
Now that we have established that several cohorts of investors are back in profit, the next logical step is to assess if there are any discernible shifts in profit taking and spending by these cohorts. For this, we can employ the SOPR metric which provides a view into the average profit or loss multiple locked in.
Currently, several SOPR variants are trading above 1.0, suggesting the average spent coin is locking in a profit across many cohorts:
- 🟠 Wider Market: SOPR = 1.09 (+9% profit on average)
- 🔴 Short-Term Holders: STH-SOPR = 1.01 (+1% profit on average)
- 🔵 Long-Term Holders: LTH-SOPR = 1.46 (+46% profit on average)
🛠️
Workbench Tip: Here we use an if-then conditional statement to highlight periods where all 3 variants of the SOPR metric are above the break-even level of 1.0.
We can extend this insight by monitoring the number of consecutive days where all three SOPR variants have traded above 1.0. The current rally has seen this condition persist for 44 days, which is longer than the average duration of 17 days, and is also the longest stretch since the Nov 2021 ATH.
Overall, this indicates that a super majority of Bitcoin holders are in profit, and sufficient demand is flowing in to absorb the distributed supply.

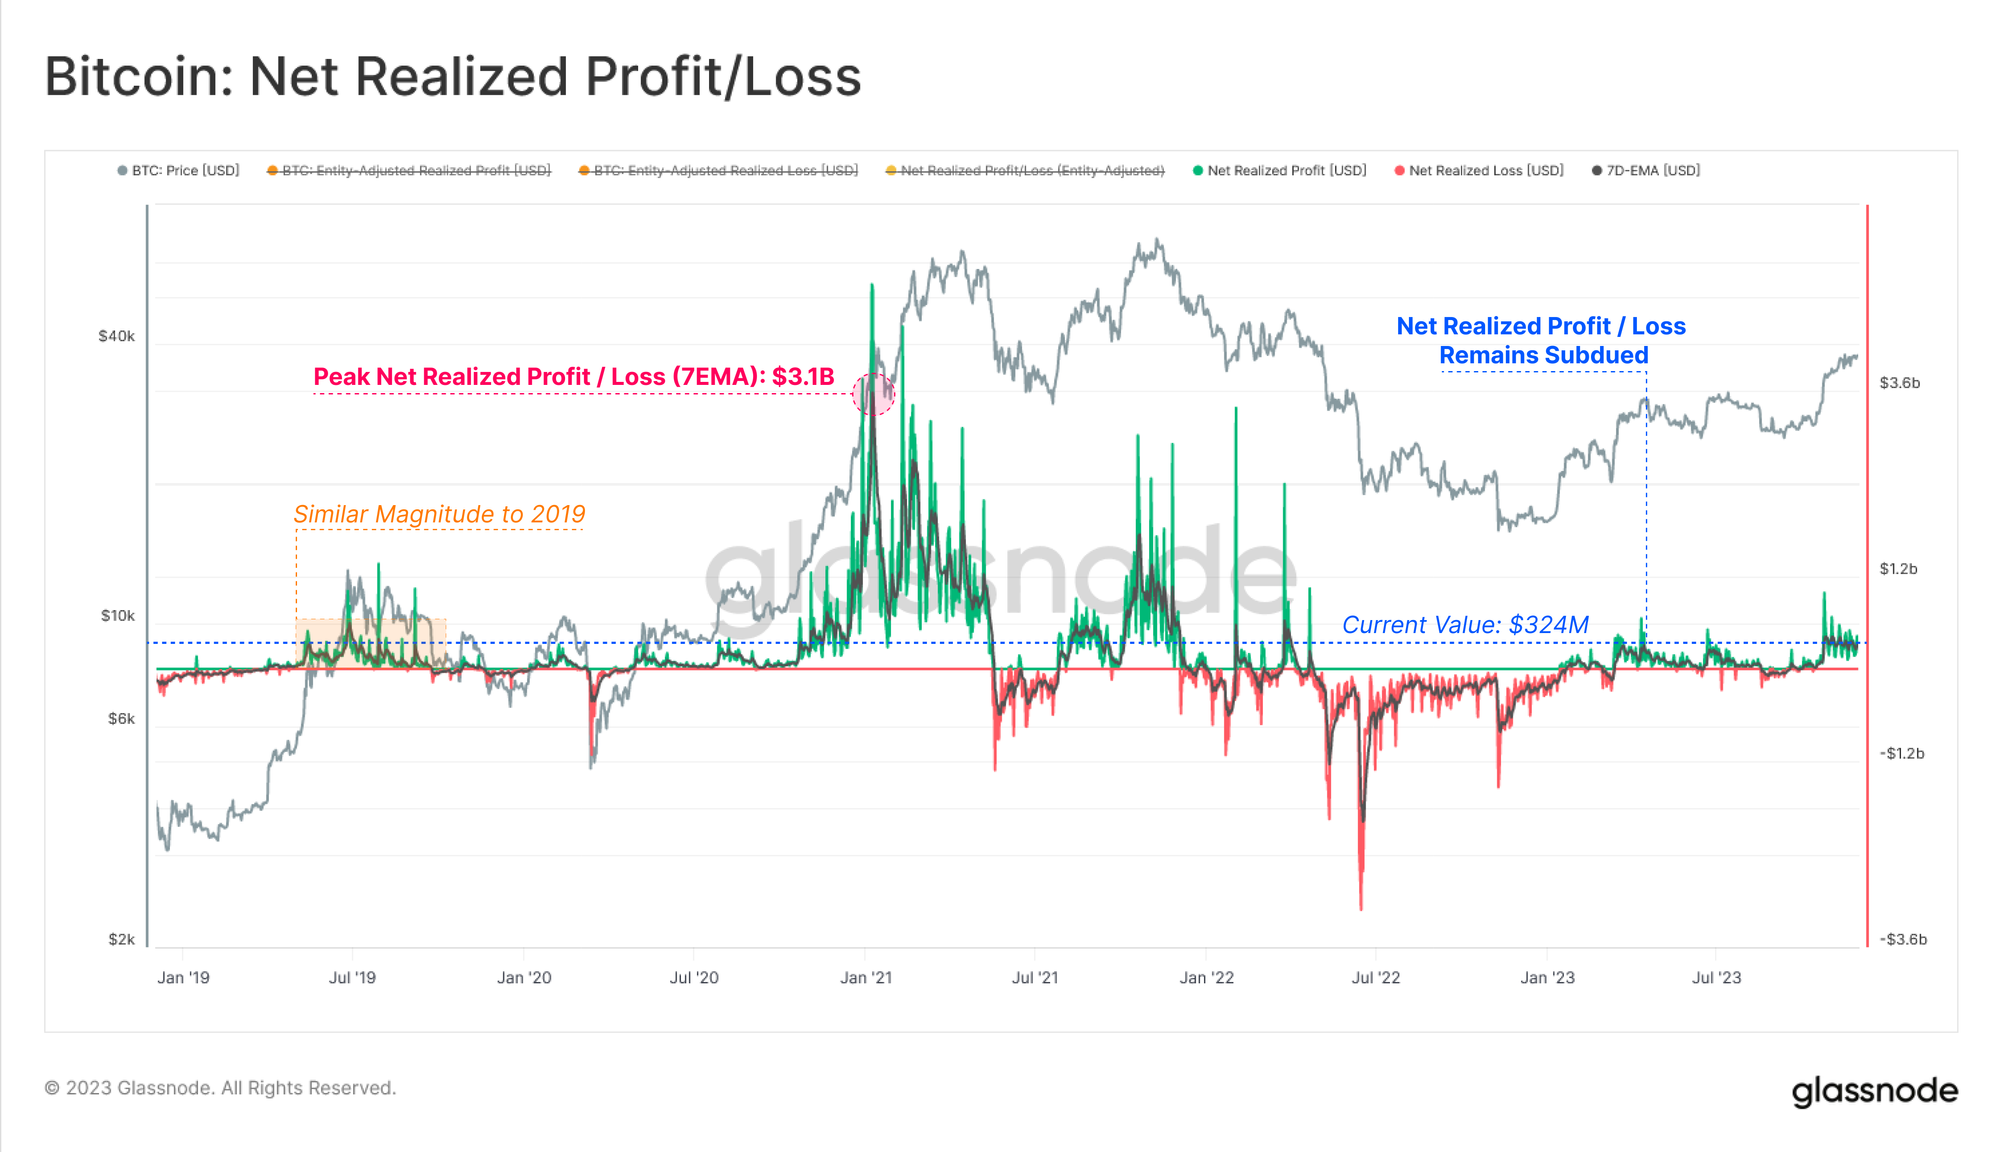
The net USD denominated realized profit locked in by the market has reached $324M/day, which remains an order of magnitude below the peaks experienced during the later stages of the 2021 bull market (which eclipsed $3B/day).
This suggests that whilst market performance is strong, and investors are enjoying meaningful profit, it remains very much within the bounds of an early rather than a late stage bull market.
Summary and Conclusions
Bitcoin continues to lead as one of the best performing assets globally in 2023. Not only has BTC appreciated over 140% YTD, it has more than doubled relative to gold, and still dominates against the rest of the digital asset industry.
With such strong performance, the super-majority of Bitcoin holders are now back in profit, with a small proportion of them realizing those gains. Several on-chain metrics suggest the recent rally has pushing the market out of a ‘transitional recovery zone’, and now more closely resembles an ‘enthusiastic bull market’.
Disclaimer: This report does not provide any investment advice. All data is provided for information and educational purposes only. No investment decision shall be based on the information provided here and you are solely responsible for your own investment decisions.
Exchange balances presented are derived from Glassnode’s comprehensive database of address labels, which are amassed through both officially published exchange information and proprietary clustering algorithms. While we strive to ensure the utmost accuracy in representing exchange balances, it is important to note that these figures might not always encapsulate the entirety of an exchange’s reserves, particularly when exchanges refrain from disclosing their official addresses. We urge users to exercise caution and discretion when utilizing these metrics. Glassnode shall not be held responsible for any discrepancies or potential inaccuracies. Please read our Transparency Notice when using exchange data.

- SEO Powered Content & PR Distribution. Get Amplified Today.
- PlatoData.Network Vertical Generative Ai. Empower Yourself. Access Here.
- PlatoAiStream. Web3 Intelligence. Knowledge Amplified. Access Here.
- PlatoESG. Carbon, CleanTech, Energy, Environment, Solar, Waste Management. Access Here.
- PlatoHealth. Biotech and Clinical Trials Intelligence. Access Here.
- Source: https://insights.glassnode.com/the-week-onchain-week-49-2023/

