Your gateway to successful crypto investing guided by data and research
Key Takeaways
- On-Chain Basics: Blockchain technologies offer an innovative perspective on Realised Profit and Loss (RPL), leveraging the transparency of transactions to provide deep insights into overall market sentiment. The unique mechanics of profit and loss realisation in cryptocurrency markets, especially Bitcoin, allow us to perceive market dynamics through novel concepts like price stamping. Using these methods, we can uncover patterns of investor behaviour, understand market trends, and evaluate fear and greed among participants.
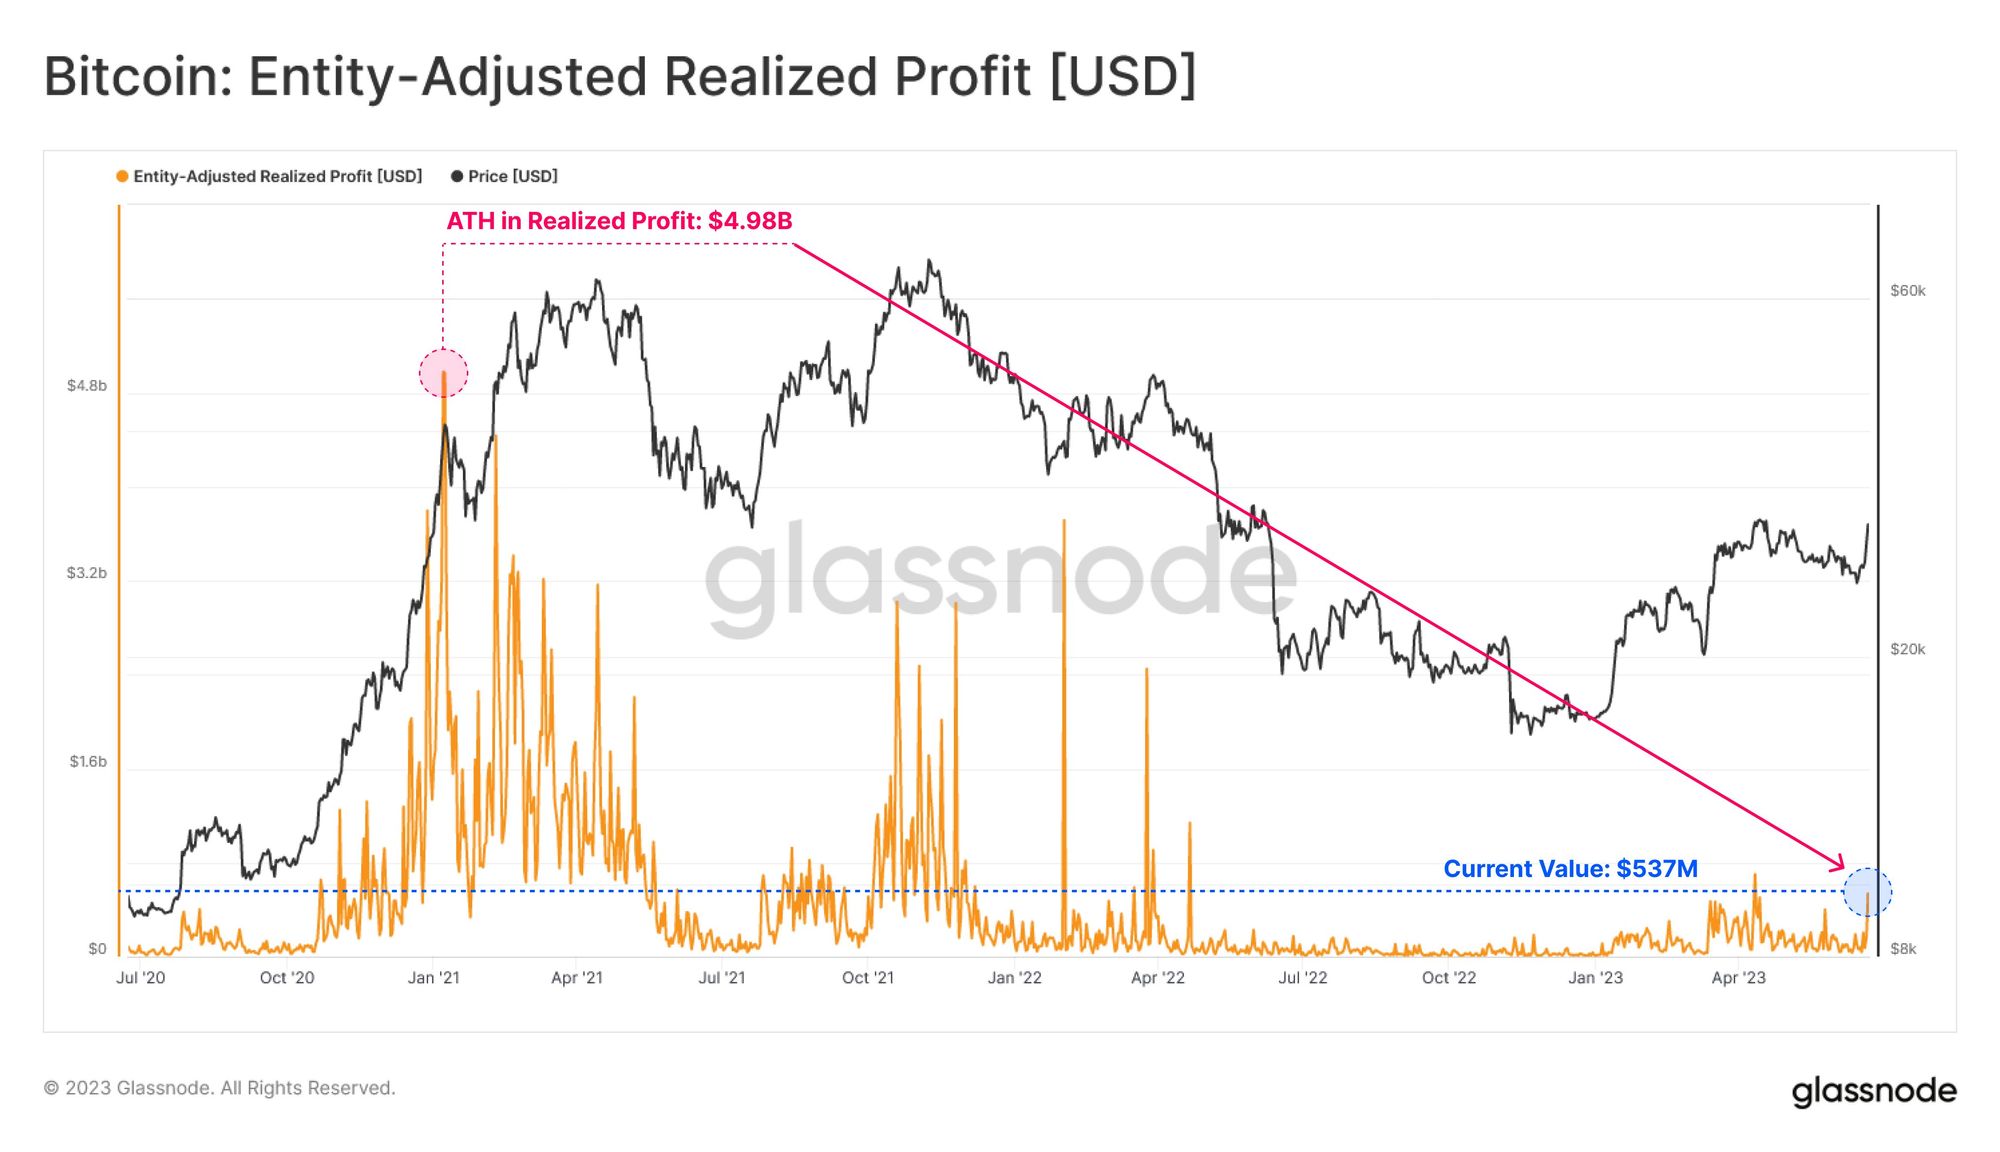
- Market Momentum: Employing Glassnode’s clustering data, we can discern the market sentiment among different groups within the Bitcoin market. In June, despite a downtrend in Bitcoin’s price, Long-Term Holder flows to exchanges remained resilient, suggesting the early stages of a profit-driven market. A substantial profit of $537M was locked in after the recent price rally, strengthening the case of a robust market recovery. However, comparing this to the profits of the previous Bull Market ($4.98B), it is clear that we are still significantly below the historic precedent.
- Risk Vectors: Regulatory uncertainties remain a significant risk, with legal actions against major exchanges influencing market sentiment and capital flows. After the recent SEC lawsuit against Binance, the exchange experienced sustained large withdrawals which amounted to $135 million per day at peak. However, market responses to regulatory threats are also becoming more measured. Using Glassnode’s advanced data clustering, we can monitor these changes in near real time.
Despite numerous challenges, including regulatory pressures on major cryptocurrency exchanges, Bitcoin delivered a robust performance in June. Following a worrisome first half marked by a 9% loss, Bitcoin’s momentum turned on the announcement of BlackRock’s filing for a spot Bitcoin ETF. This positive news ignited a market rally, allowing Bitcoin to conclude the month with a 14% gain.
In our inaugural edition of Finance Bridge, we examined key on-chain developments to interpret Bitcoin’s price action. The sideways movement we observed was consistent with a consolidation phase, potentially laying the groundwork for a sustained upward trend rather than indicating a return to a bear market. We noted that accumulation patterns among long-term holders and the profitability of new market entrants reinforce this perspective.
To better understand market momentum, we previously highlighted a suite of on-chain indicators pointing to a market in recovery. One set of these indicators focuses on market profitability, a crucial signal of market sentiment shifts. In this edition, we zero in on Realised Profit and Loss, a metric familiar to traditional finance which, thanks to on-chain analysis, has a special significance in the crypto market. We will explore how this metric informs our understanding of the current market structure, price action, and how it can be leveraged to guide strategic decisions.
In traditional finance, Realised Profit and Loss is a crucial performance measurement tool. It represents the cumulative gains or losses realised by an entity – whether it’s an individual investor, a trading firm, or a financial institution – over a specific period.
Realised Profit and Loss can serve multiple purposes – from evaluating the performance of investment portfolios and assessing the viability of business strategies to aiding in risk management and guiding effective capital allocation decisions. In essence, it provides insights into the financial health and profitability of financial operations and aids in strategic decision-making for future investment and business activities.
When applied to blockchain-based digital assets, the concept of Realised Profit and Loss takes on a unique dimension. Blockchains, by their nature, enable tracking of every single transaction that has ever occurred for a particular asset. This unprecedented transparency and granularity allow for the application of Realised Profit and Loss to the cumulative gains or losses of all transacted assets across the entire blockchain. As such, it can serve as an effective barometer for overall market sentiment, providing insights into whether market participants are predominantly booking profits or realising losses.
Realised Profit and Loss: A Comparison

Mechanics of Realised Profit and Loss in Cryptocurrency Markets
The mechanics of realising profit and loss in cryptocurrency markets, particularly with Bitcoin, have a unique aspect compared to traditional finance due to the nature of the blockchain and the concept of price stamping. In traditional finance, assets like stocks or bonds are bought and sold at the current market value, and profits or losses are realised based on the difference between the purchase and selling price.
In contrast, with cryptocurrencies like Bitcoin, the transactional history of each coin, including when and at what value it was last moved, is recorded on the blockchain. This allows for a concept called price stamping, which means we can assign a value to a coin based on the price when it was last moved or withdrawn from an exchange.
When a coin is moved from an exchange, it can be interpreted as the coin being taken out of circulation for trading, implying a long-term investment decision. If the coin is moved back to an exchange when the price is significantly higher, it could indicate that the holder is looking to realise a profit, giving an insight into market sentiment that isn’t directly available in traditional markets.
Implications for Market Trends and Trader Behaviour
The realisation of profit and loss in the Bitcoin market can serve as an indirect indicator of the capital flow within the system, giving us valuable insights into market trends and investor behaviour that are not easily attainable in traditional financial markets.
When a majority of investors are moving their coins back to exchanges at a higher price than when they were withdrawn, this could be interpreted as many investors realising profits. In such cases, new capital must flow into the market to facilitate these transactions, indicating a potential influx of fresh investments into the system. This situation often corresponds to a bullish market sentiment, with prices likely to increase.
On the contrary, when coins are sold for less than their withdrawal prices, it can be an indication of investors realising losses. In this scenario, capital is exiting the market as the investors sell their holdings, often in an attempt to prevent further losses. This situation often corresponds to a bearish market sentiment, potentially indicating a downward trend in prices.
The ability to monitor these profit and loss realisations in real-time offers unique insight into the ebbs and flows of capital within the Bitcoin market. This understanding can help market participants gauge overall sentiment and potentially predict future trends. Such insights cannot be easily achieved in traditional markets due to the lack of transactional histories tied to individual assets.
In essence, tracking realised profits and losses within the Bitcoin market allows for a novel way to visualize the human psychology of fear and greed over time, shedding light on market sentiment and potential trend shifts in a way that isn’t possible in traditional finance.
Realised Profit and Loss vs the Spent Output Profit Ratio (SOPR)
The Spent Output Profit Ratio (SOPR), a metric unique to the cryptocurrency market, works in conjunction with realised profit and loss to offer a comprehensive insight into market dynamics. SOPR gauges the profit or loss made on each transaction compared to the price when the coins were last moved. It brings into focus individual transactional behaviour, assigning equal importance to every transaction, irrespective of size. This contrasts with realised profit and loss, which emphasises the capital flow within the system over the specifics of individual transactions.
SOPR’s historical trends reveal a coherent pattern. A sustained SOPR above 1 indicates that, on average, people sell coins at a profit, signalling a bullish market. Conversely, a SOPR consistently below 1 signifies coins are being sold at a loss, indicating a bearish market sentiment. Furthermore, specific SOPR levels often mark major capitulation events or periods of intense selling. Together, SOPR and realised profit and loss offer a uniquely detailed view of the cryptocurrency market, achievable only through on-chain analysis.
With access to Glassnode’s clustering data, we can observe the performance of distinct groups within the Bitcoin market. This enables us to evaluate the market-wide sentiment by analyzing the profit and loss dynamics of different cohorts, such as short-term holders versus long-term holders which we discussed in-depth in the previous Finance Bridge edition.
When the price of Bitcoin plummeted to the low of $25K, the profit and loss metrics allowed us to peek under the hood of market sentiment. Surprisingly, despite the pervasive market-wide fear, Bitcoin’s Long-Term Holder flows to exchanges remained robust. This indicated that despite the downtrending price action, we were still in the early stages of a profit-driven market regime.

Short-term holders, on the other hand, have enjoyed a significant profit-driven regime since the beginning of the year. Yet, as the spot price continued its downward trend, the Short-Term Holder Realised Profit / Loss Ratio approached a critical point of equilibrium.

Mid-June brought another interesting observation – among all the coins flowing into exchanges, very few of them locked in substantial profit or loss. Most coins sent to exchanges were purchased at a price very close to the current spot rate. Given the dominance of Short-Term Holders, these coins had likely been acquired recently. The trend suggested that the market was oscillating between a certain level of confidence (investors largely unfazed by market fluctuations) and apathy (the price range was not enticing enough to trigger transactions).

In the aftermath of the price rally, market participants locked in a considerable $537M in profit, the second-largest profit-taking event over the past year. As we discussed in the last Finance Bridge edition, such profit-taking behaviour may indicate that a market recovery is underway and could herald the early stages of a new bull market.

However, when comparing the recent profit ($537M) to the peak profit realised across the 2021 primary Bull Market ($4.98B), we observe a substantial decline of $4.44B (89%). This suggests that while current profit-taking is note-worthy, it remains significantly below the historic precedent set by the previous bull market.
When it comes to SOPR, a brief period of loss was followed by a return to a profit-driven regime, recording a decisive bounce at the equilibrium position to a value of 1.09. This is a promising sign that market participants have returned to transacting at a profit.

Our analysis strengthens the recovery thesis we laid out last month and suggests that we might be entering the early stages of the next bull market. The sufficient demand inflow observed to absorb profits has the potential to attract even more volume and liquidity into the market. However, it’s essential to note that these observations are subject to the often unpredictable dynamics of the cryptocurrency market. Continuous monitoring of the trends discussed here is imperative.
Still, BlackRock’s recent filing for a Bitcoin ETF illustrates a notable shift. If approved, the ETF will give institutional investors a regulated, non-custodial and easy method to gain exposure to Bitcoin. This move is likely to attract large entities seeking easy, regulatory-compliant access to BTC.
Considering the current market dynamics, the application and its potential approval could significantly reinforce the demand for spot Bitcoin within the next 8-12 months – the time it will likely take for BlackRock to launch its investment product. As such, the current consolidation phase may present an opportunity window for those seeking more direct exposure to Bitcoin with a long-term investment horizon.
Regulatory risks continue to cast a shadow over the cryptocurrency market, especially as legal actions against major exchanges can quickly turn market sentiment sour, leading to sell-offs. This was evident in the recent SEC lawsuit against Binance, which not only pushed Bitcoin prices lower but also triggered an increase in outflows from the exchange. At the peak, withdrawals amounted to $135 million per day, a scale echoing the panic following the FTX collapse.

When it comes to the size of these outflows, they ranged from under $100,000 to as high as $10 million. This diverse movement implies various market participants, including small investors, whales, and institutions, adjusted their risk exposures in response to these developments.
Assessing Market Response Amid Legal Challenges
Despite the considerable outflows, signs of slowing down are evident, suggesting a measured market response. While the SEC lawsuit against Binance and its founder led to the exit of a substantial volume, Binance still holds more than 667,000 BTC globally, down only 5% from its all-time high balance reached in early June.

This points to two important observations:
- The market’s reaction to a potential DoJ case might be more subdued, as this risk seems to have been priced in following the CFTC charges earlier this year and the recent SEC lawsuit.
- While we in no way endorse Binance and its approach to regulations, Glassnode’s data so far supports Binance’s claims of having sufficient reserves to cover large withdrawals and investor demand for their coins.
Robust Monitoring Is Key
Still, the situation remains dynamic, highlighting the need for continuous monitoring. Thanks to advanced data clustering algorithms by Glassnode, we can monitor Binance’s coin holdings in near real-time, verifying their stated volumes.
Recognising the need for a robust exchange risk management framework, Glassnode has recently prepared a comprehensive report for institutional clients. It details how to proactively track, mitigate, and respond to exchange risk in near real time. The report outlines key strategies for assessing exchange health, tracking asset reserves, and analyzing real-time inflow/outflow dynamics using an array of powerful on-chain data tools and indicators. We invite you to download the report here.
Get Personalised Insights
We appreciate your continued engagement with our Finance Bridge newsletter. Our hope is that this issue, centred around Realised Profit and Loss, has provided you with valuable insights into the dynamics of the cryptocurrency market.
To better serve your needs, we encourage you to connect with us. Should you have any questions about the content of this issue or if you’re interested in exploring how to harness Glassnode’s full potential, we’re here to assist.
Please feel free to reach out. Schedule a call with a member of our Institutional Sales team to initiate a conversation. We earnestly look forward to your invaluable insights.
Disclaimer: This report does not provide any investment advice. All data is provided for information and educational purposes only. No investment decision shall be based on the information provided here and you are solely responsible for your own investment decisions.

- SEO Powered Content & PR Distribution. Get Amplified Today.
- PlatoData.Network Vertical Generative Ai. Empower Yourself. Access Here.
- PlatoAiStream. Web3 Intelligence. Knowledge Amplified. Access Here.
- PlatoESG. Automotive / EVs, Carbon, CleanTech, Energy, Environment, Solar, Waste Management. Access Here.
- BlockOffsets. Modernizing Environmental Offset Ownership. Access Here.
- Source: https://insights.glassnode.com/finance-bridge-edition-2/

