Animal experiments
Fertilized eggs and recipient embryos were provided by local breeders and cPGCs were obtained from 2.5-day-old chicken embryos. The use of these cells and 6-day-old embryos did not require any ethical approval as they were acquired from an age before the completion of one-third of incubation time. The study is reported in accordance with the ARRIVE guidelines.
cPGC culture media
In this study, both enriched and defined media were used to cultivate, propagate, and maintain cPGCs in long-term culture (Figs. 1A, 2A). The cPGC basic medium was prepared by diluting the DMEM (high glucose, no glutamine, no calcium; Cat#: 21068028) medium to a final osmolarity of 250 mOsm (by mixing 700 ul medium and 210 ul distilled water). This medium was supplemented with 2.0 mM GlutaMax, 1X Non-Essential Amino Acid (NEAA), 1X Penicillin/Streptomycin (Pen/Strep), 1 mM ß-mercaptoethanol, 1X nucleosides, 0.4 mM pyruvate, 0.1 mg/mL sodium heparin (Sigma), and 0.15 mM CaCl2 (Fig. 2A). To make the defined medium, 0.2% ovalbumin (Sigma), 10ug/mL ovotransferrin (Sigma), 1X B-27 supplement, 30 ng/mL hActivin A (Peprotech; E.Coli derived, Cat#: 120-14E), and 5 ng/mL bFGF (Peprotech; E.coli derived, Cat#: 100-18B) were added to the cPGC basic medium (Fig. 2A). By the addition of the following supplements to the cPGC basic medium, an enriched medium was made: 1% KOSR that primarily contains lipid-rich albumin, 0.2% ovalbumin (Sigma), 10ug/mL ovotransferrin (Sigma), 1X B-27 supplement, 30 ng/mL hActivin A (Peprotech; E.Coli derived), and 5 ng/mL bFGF (Peprotech; E.Coli derived) (Fig. 2A). All components used in this study were obtained from Thermo Fisher Scientific, USA, unless specified otherwise.
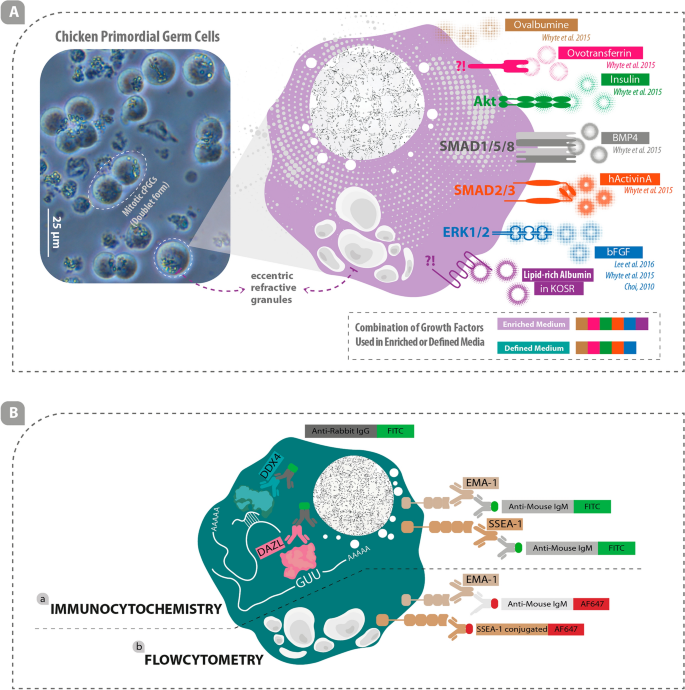
Real and schematic depiction of cPGCs, growth factors involved in cPGCs survival and proliferation in-vitro, and stem-cell/germ-cell specific markers in cPGCs. (A) 120-day-old cPGCs culture with lots of doublet cells and prominent eccentric refractive granules (left) and several important growth factors involved in the survival and proliferation of cPGCs are illustrated (right). (B-a) Immunocytochemistry was performed using primary antibodies against DDX4 and DAZL proteins as well as EMA1 and SSEA1 cell surface markers. Conjugated secondary antibodies were used to label the primary antibodies. (B-b) Flow cytometry was performed using primary EMA1 antibody which was labeled using conjugated secondary antibody and conjugated primary antibody was used for detecting SSEA1 cell surface marker. (IgG: Immunoglobulin G; IgM: Immunoglobulin M; FITC: Fluorescein isothiocyanate; AF647: Alexa Fluor 647).
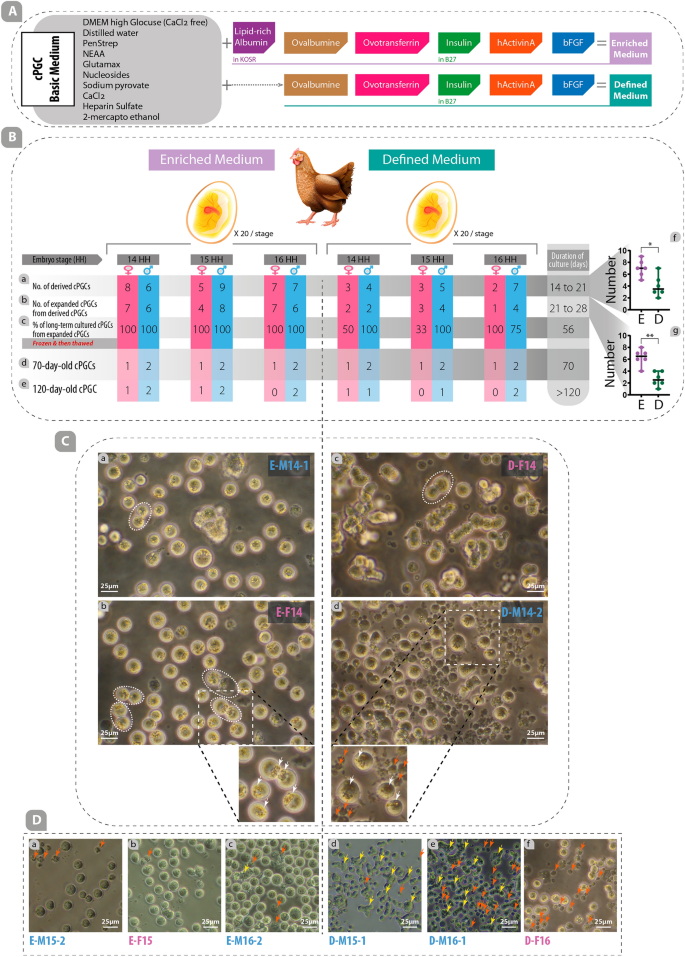
Enriched medium improves derivation, expansion, long-term culture, and proliferation rates of cPGCs. (A) Components of the cPGC basic medium were supplemented with several types of growth factors to make an enriched medium (specifically containing lipid-rich albumin provided by KOSR) or defined medium (without KOSR). (B) The rate of derived (a), expanded (b), long-term cultured (c), 70-day-old (d), and 120-day-old (e) cPGCs were compared in enriched and defined media. The number of derived (f) and expanded (g) cPGCs in the enriched medium were compared with those in the defined medium. (C) The specific features of cPGCs cultured in enriched and defined media were compared. The oval dash lines indicate the doublet form of cPGCs (a, b, c). In the insets, the eccentric refractive granules (white arrows) and dead cells (red arrows) are depicted (E: enriched, D: defined, M: male, F: female, 14,15,16: HH stages). (D) Comparison of the number of dead (red arrows) and clumpy (yellow arrows) cells in different cell lines of cPGCs cultured in enriched and defined media. *: p < 0.05, **: p < 0.01 are statistically significant.
Cultivation, derivation, expansion, and long-term culture of cPGCs in enriched and defined media
Embryonic blood was isolated from the dorsal aorta of fertile Hubbard JA57 broiler eggs at three different developmental stages (HH stage 14, 15, and 16; see details in supplementary Fig. S1). Samples were taken to determine the sex of the embryos. To start the primary culture, a minimum of 1 µL of embryonic blood was placed directly into 100 µL of enriched or defined media in 96-well plates. cPGCs appeared in the primary culture of embryonic blood between days 14 to 21 (Derived cPGCs; Fig. 2B-a). During this time blood cells were completely lysed and disappeared. The derived cPGCs were transferred to the 48-well plate for expansion from day 21 to 28 (Expanded cPGCs; Fig. 2B-b), and then to 24-well plates for further proliferation and long-term culture (Long-term cultured cPGCs; Fig. 2B-c). After 56 days of culture, long-term cultured cPGCs were frozen at a density of 0.5–1 × 10⁶ cells per cryovial. After three days, two male and one female cPGCs were thawed and re-cultured, and evaluated for proliferation rate. 70-day-old cPGCs (Fig. 2B-d) and 120-day-old cPGCs (Fig. 2B-e) were used for promoter assay, immunocytochemistry, flow cytometry, and qPCR. In this study, an established cell line was defined by the duration of the culture of more than 120 days (120-day-old cPGCs; Fig. 2B-e).
Proliferation assay
Two 60-day-old male and one female cPGCs from each isolate were cultured in enriched and defined media at a density of 2 × 10³ cells per well of a 24-well plate (Day 0: 2000 cells/well were cultured). The cells were counted every other day from day 0 to day 10 (Supplementary Fig. S2A, B, C). To perform the assay, 10 µL of cPGCs were taken from each well plate at each time-point, stained with Trypan Blue dye (Thermo Fischer, USA), loaded onto a hemocytometer, and counted. The medium was changed every two days during the experiment.
Analysis of germ cell- and stem cell-specific markers by immunocytochemistry
EMA1, a germ cell-specific cell surface marker, and DAZL/DDX4, germ cell-specific cytoplasmic markers, as well as SSEA1, a stem cell-specific cell surface marker, were labeled using specific primary antibodies (Anti-SSEA1 and Anti-EMA1 primary antibodies were purchased from DSHB, USA; Anti-DAZL and Anti-DDX4 primary antibodies were purchased from Abcam, USA and Biotem, France, respectively) (Fig. 1B-a). Anti-mouse IgM FITC (JIR, USA) was used as a secondary antibody to detect the Anti-SSEA1/Anti-EMA1 primary antibody (Fig. 1B-a), and anti-rabbit IgG FITC (JIR, USA) was used as a secondary antibody to detect the Anti-DAZL/ Anti-DDX4 primary antibodies (Fig. 1B-a).
For each group, 5 × 10⁴ cells were washed twice with 2% FBS-DPBS (Dulbecco’s phosphate-buffered saline) and diluted in 100 μL of cold 1% BSA (bovine serum albumin)-DPBS. Slides with 2 spots and filters were placed into the cytospin’s slots with the cardboard filters facing the center of the cytospin (Thermo Fisher Scientific, USA). 100 μL of each sample was quickly aliquoted into the wells of the cytospin, and cells were cytospun at 500 rpm for 5 min. The filters were removed from the slides without contacting the cells attached to the slides. To check the morphology of cells, each slide was examined under a microscope. All the slides were then fixed with 100 μL of 4% paraformaldehyde (Thermo Fisher Scientific, USA) for 10 min. For DAZL/DDX4 labeling, the slides were treated for 15 min at room temperature with 0.5% triton X-100. The slides were washed twice with cold 1% BSA-DPBS for 5 min and then were incubated in cold 1% BSA-DPBS for 30 min. Each primary antibody, prepared in 2% BSA with appropriate dilution (0.25 µg/mL for Anti-SSEA1; 0.5 µg/mL for Anti-EMA1; 1:2000 for Anti-DDX4; 1:500 for Anti-DAZL), was poured on the slides and incubated overnight in a 4 °C wet chamber. The next day, each slide was washed twice with cold 1% BSA-DPBS for 5 min. The appropriate secondary antibody (1:500 Anti-Mouse IgM-FITC; 1:500 Anti-Rabbit IgG-FITC) was added and incubated in a 4 °C wet chamber for 1 h. The slides were washed twice with cold 1% BSA-DPBS for 5 min. Slides corresponding to EMA1 and SSEA1 were stained with DAPI for nucleus staining. Slides corresponding to DAZL and DDX4 were stained with 1μM TO-PRO-3 (Thermo Fisher Scientific, USA) for nucleus staining. Then all slides were mounted with ProLong Diamond Antifade Mounting Medium (Thermo Fisher Scientific, USA) and sealed with DPX (Phthalate Free) (Thermo Fisher Scientific, USA). The images corresponding to EMA1 and SSEA1 were analyzed using epifluorescence microscopy (Leica, Germany), and the images corresponding to DAZL and DDX4 were analyzed using confocal microscopy (Leica, Germany).
Analysis of germ cell- and stem cell-specific markers by flowcytometry
cPGCs were labeled using primary antibodies including EMA1 (diluted 1:100; DSHB, USA) and SSEA1-conjugated AF647 (1:125 dilution; Santa Cruz, USA) (Fig. 1B-b). Anti-mouse IgM AF647 (diluted 1:500; JIR, USA) was used as a secondary antibody to label EMA1 primary antibody (Fig. 1B-b). For labeling the cells, 5 × 10⁵ cPGCs (either cultured in enriched or defined media) were counted and centrifuged. The cell pellet was then resuspended in 1 mL DPBS containing 5% FBS. After centrifugation, the supernatant was discarded, and cells were resuspended and incubated in 100 μL of each primary antibody for 1 h. The cells labeled with EMA1 were centrifuged and incubated with 100 μL of anti-mouse IgM AF647 secondary antibody for 30 min. 900 μL of DPBS containing 5% FBS was added to all tubes and centrifuged. The supernatant was discarded, and the cells were resuspended in 300 μL of DPBS containing 5% FBS. Control cells were labeled with only the anti-mouse IgM AF647 secondary antibody. All centrifugation steps were performed at 1200 rpm for 3 min. Flow cytometry analysis was performed using a BD device (BD Biosciences, USA).
Analysis of pluripotency-related genes by RT-qPCR
The expression levels of cNANOG and cPOU5F3/OCT4 transcripts were quantified using RT-qPCR. Total RNA was extracted from cPGCs using the RNA Isolation Kit (Qiagen, Germany), and 500 ng of RNA was reverse transcribed using the RevertAid First Strand cDNA Synthesis Kit (Thermo Fisher Scientific, USA) and random hexamer primers. qPCR was conducted with 50 ng cDNA in a 20 µL reaction with the RealQ Plus 2 × Master Mix Green (Ampliqon, Denmark) and an Applied-biosystem Real-Time PCR device (Thermo Fischer, USA) with three technical replicates. Primers that were used to amplify cNANOG (PCR product size: 183 bp) were 5′-GGGATTTATCTACCACAGAATGG-3′ and 5′-CACAGCCATGAACGGATA-3′. To amplify cOCT4 (PCR product size: 87 bp) forward and reverse primers were 5′-ACGCTCTATGGGAAGATGTTC-3′ and 5′-CTTCAGCTTGCACATGTTCTTA-3′). The forward primer 5′-GAGAAGATGACACAGATC-3′ and reverse primer 5′-CAGAGTCCATCACAATAC-3′ were used to amplify cACTB (PCR product size: 118 bp). The PCR protocol consisted of an initial denaturation step at 94 (mathbf{^circ{rm C} }) for 15 min, followed by 45 cycles of denaturation at 94 (mathbf{^circ{rm C} }) for 30 s, annealing (at 50 (mathbf{^circ{rm C} }) for cNANOG and cOCT4 and at 55 (mathbf{^circ{rm C} }) for cACTB) for 30 s, and extension at 72 (mathbf{^circ{rm C} }) for 20 s followed by a 10s extension at 72 (mathbf{^circ{rm C} }) for data collection. A melting curve analysis was performed between 60 and 95 (mathbf{^circ{rm C} }).
To find the most appropriate reaction temperature and the best concentration of primers, and to optimize the amplification and melting curves, different qPCR reactions were performed. Dilution series of cDNA was prepared to generate standard curves for cNANOG, cOCT4, and ACTB genes using the SYBR Green qPCR master mix (Ampliqon, Denmark). To this end, 2 uL of the cDNA from each dilution was added to 18 μL of the SYBR Green qPCR Mastermix in three technical replicates and subjected to real-time readings. To make a standard curve (Supplementary Fig. S3), the log10 of cDNA concentration for the cNANOG, cOCT4, and ACTB genes were plotted against the cycle threshold (Ct) numbers. We used the equation of E = − 1 + 10^(–1/slope) to calculate the reaction efficiency. The gene expression ratio for the cNANOG and cOCT4 genes over the ACTB gene was calculated using the Pfaffl method28.
Assessment of clonal expansion of cPGCs
The ability of media to support the clonal expansion of cPGCs was assessed. A single cPGC was picked up using a glass micro-needle under fluorescence microscopy and transferred into a single chamber of a 96-well plate, containing 100 µL of the enriched medium. The cells were fed every 2 days by replacing two-thirds of the medium until an appropriate number of cells was acquired (~ > 3 (times) 104/each well of a 96-well plate).
Plasmid resources and preparation
Transposon plasmids modified from the pBP vector (PiggyBac transposon vector) were generous gift from J. Silva laboratory (University of Cambridge, UK). DAZL and DDX4 promoter have been cloned by PCR amplification from chicken genomic DNA and cloned individually in the pBP vector (supplementary Fig. S4A-a, A-b, B-a, B-b). Transposase plasmid was modified from pCMV6-XL5 (Origene Technologies, Ref: pCMV6-XL5) where transposase gene came from Austin Smith laboratory (Institute for Stem Cell Research, University of Edinburgh, UK) and was cloned in the pCMV6-XL5.
Transfection of cPGCs
To prepare the plasmid mix, 2 µg DDX4-tdTomato transposon (Supplementary Fig. S4A-a) and 2 µg piggyBac transposase were mixed with R buffer (provided in the NEON kit; Thermo Fisher Scientific, USA) in a final volume of 10 µL. To prepare the cell suspension, 1 × 10⁶ 120-day-old cPGCs were counted and pelleted. The cells were then washed with DPBS, pelleted again, and re-suspended in 10 µL of R buffer. To prepare the transfection mix, 10 µL of the plasmid mix was added to the 10 µL cell suspension. Using the NEON pipette and the pipette tip provided in the kit (Thermo Fisher Scientific, USA), 10 µL of the transfection mix was gently pipetted, and the tip was loaded into the NEON chamber. Electroporation was performed by applying 650, 850, or 1050 V for 50 milliseconds and 1 pulse. After the tip was unloaded from the NEON chamber, the cells were gently dispensed into a 24-well plate containing a pre-warmed enriched medium. The cells were incubated for 24 h and the medium was changed daily thereafter. To evaluate the efficiency of transfection, a portion of the cells was pelleted, washed twice with cold DPBS, and re-suspended in 200 µL of cold DPBS. The suspension was analyzed using flow cytometry.
Promoter assay
cPGCs were transfected/electroporated by plasmids containing 2xHS4-DDX4-tdTomato (Supplementary Fig. S4A-a) or 2xHS4-DAZL-tdTomato (Supplementary Fig. S4B-a) to evaluate promoter functionality in the 120-day-old cPGCs.
Gonadal migration assessment of cPGCs cultured in the enriched medium
Before injection, 2.5 d fertile eggs were placed vertically with the flattened end facing upwards and allowed to incubate for a minimum of one hour without rotation. The eggs were swabbed with 70% ethanol. A 30-mm circle window was opened on the flattened end of the egg using a small drill. Clonally-expanded/non-selected tdTomato-positive cPGCs, cultured in an enriched medium for two weeks, were successfully injected into the dorsal aorta of seventeen 2.5-day-old chicken embryos (at HH stage 14–16) in a volume of 5 µL containing 5 × 10³ cells. The window was sealed with Parafilm and the injected eggs were incubated at 37.7 ± 2 °C with 60% relative humidity and rocked through a 45° angle every hour until day 6 (at HH stage 26–28). The six-day-old gonads (at HH stage 26–28) were dissected using fine scissors and transferred to petri dishes containing cold DPBS. The presence of localized tdTomato-positive cPGCs was evaluated in all dissected gonads using a fluorescent stereo-microscope (Leica, Germany).
Statistical test
For statistical analysis of data related to RT-qPCR, derivation rate, and expansion rate, the Mann–Whitney test was performed. Data were considered statistically significant at p < 0.05, and p < 0.01.
- SEO Powered Content & PR Distribution. Get Amplified Today.
- PlatoData.Network Vertical Generative Ai. Empower Yourself. Access Here.
- PlatoAiStream. Web3 Intelligence. Knowledge Amplified. Access Here.
- PlatoESG. Automotive / EVs, Carbon, CleanTech, Energy, Environment, Solar, Waste Management. Access Here.
- BlockOffsets. Modernizing Environmental Offset Ownership. Access Here.
- Source: https://www.nature.com/articles/s41598-023-39536-1

