In Part 2 of this series, we discussed how to enable AWS Glue job observability metrics and integrate them with Grafana for real-time monitoring. Grafana provides powerful customizable dashboards to view pipeline health. However, to analyze trends over time, aggregate from different dimensions, and share insights across the organization, a purpose-built business intelligence (BI) tool like Amazon QuickSight may be more effective for your business. QuickSight makes it straightforward for business users to visualize data in interactive dashboards and reports.
In this post, we explore how to connect QuickSight to Amazon CloudWatch metrics and build graphs to uncover trends in AWS Glue job observability metrics. Analyzing historical patterns allows you to optimize performance, identify issues proactively, and improve planning. We walk through ingesting CloudWatch metrics into QuickSight using a CloudWatch metric stream and QuickSight SPICE. With this integration, you can use line charts, bar charts, and other graph types to uncover daily, weekly, and monthly patterns. QuickSight lets you perform aggregate calculations on metrics for deeper analysis. You can slice data by different dimensions like job name, see anomalies, and share reports securely across your organization. With these insights, teams have the visibility to make data integration pipelines more efficient.
Solution overview
The following architecture diagram illustrates the workflow to implement the solution.

The workflow includes the following steps:
- AWS Glue jobs emit observability metrics to CloudWatch metrics.
- CloudWatch streams metric data through a metric stream into Amazon Data Firehose.
- Data Firehose uses an AWS Lambda function to transform data and ingest the transformed records into an Amazon Simple Storage Service (Amazon S3) bucket.
- An AWS Glue crawler scans data on the S3 bucket and populates table metadata on the AWS Glue Data Catalog.
- QuickSight periodically runs Amazon Athena queries to load query results to SPICE and then visualize the latest metric data.
All of the resources are defined in a sample AWS Cloud Development Kit (AWS CDK) template. You can deploy the end-to-end solution to visualize and analyze trends of the observability metrics.
Sample AWS CDK template
This post provides a sample AWS CDK template for a dashboard using AWS Glue observability metrics.
Typically, you have multiple accounts to manage and run resources for your data pipeline.
In this template, we assume the following accounts:
- Monitoring account – This hosts the central S3 bucket, central Data Catalog, and QuickSight-related resources
- Source account – This hosts individual data pipeline resources on AWS Glue and the resources to send metrics to the monitoring account
The template works even when the monitoring account and source account are the same.
This sample template consists of four stacks:
- Amazon S3 stack – This provisions the S3 bucket
- Data Catalog stack – This provisions the AWS Glue database, table, and crawler
- QuickSight stack – This provisions the QuickSight data source, dataset, and analysis
- Metrics sender stack – This provisions the CloudWatch metric stream, Firehose delivery stream, and Lambda function for transformation
Prerequisites
You should have the following prerequisites:
- Python 3.9 or later
- AWS accounts for the monitoring account and source account
- An AWS named profile for the monitoring account and source account
- The AWS CDK Toolkit 2.87.0 or later
Initialize the CDK project
To initialize the project, complete the following steps:
- Clone the cdk template to your workplace:
- Create a Python virtual environment specific to the project on the client machine:
We use a virtual environment in order to isolate the Python environment for this project and not install software globally.
- Activate the virtual environment according to your OS:
- On MacOS and Linux, use the following code:
- On a Windows platform, use the following code:
After this step, the subsequent steps run within the bounds of the virtual environment on the client machine and interact with the AWS account as needed.
- Install the required dependencies described in requirements.txt to the virtual environment:
- Edit the configuration file
default-config.yamlbased on your environments (replace each account ID with your own.
Bootstrap your AWS environments
Run the following commands to bootstrap your AWS environments:
- In the monitoring account, provide your monitoring account number, AWS Region, and monitoring profile:
- In the source account, provide your source account number, Region, and source profile:x
When you use only one account for all environments, you can just run thecdk bootstrapcommand one time.
Deploy your AWS resources
Run the following commands to deploy your AWS resources:
- Run the following command using the monitoring account to deploy resources defined in the AWS CDK template:
- Run the following command using the source account to deploy resources defined in the AWS CDK template:
Configure QuickSight permissions
Initially, the new QuickSight resources including the dataset and analysis created by the AWS CDK template are not visible for you because there are no QuickSight permissions configured yet.
To make the dataset and analysis visible for you, complete the following steps:
- On the QuickSight console, navigate to the user menu and choose Manage QuickSight.
- In the navigation pane, choose Manage assets.
- Under Browse assets, choose Analysis.
- Search for GlueObservabilityAnalysis, and select it.
- Choose SHARE.
- For User or Group, select your user, then choose SHARE (1).
- Wait for the share to be complete, then choose DONE.
- On the Manage assets page, choose Datasets.
- Search for observability_demo.metrics_data, and select it.
- Choose SHARE.
- For User or Group, select your user, then choose SHARE (1).
- Wait for the share to be complete, then choose DONE.
Explore the default QuickSight analysis
Now your QuickSight analysis and dataset are visible to you. You can return to the QuickSight console and choose GlueObservabilityAnalysis under Analysis. The following screenshot shows your dashboard.

The sample analysis has two tabs: Monitoring and Insights. By default, the Monitoring tab has the following charts:
- [Reliability] Job Run Errors Breakdown
- [Reliability] Job Run Errors (Total)
- [Performance] Skewness Job
- [Performance] Skewness Job per Job

- [Resource Utilization] Worker Utilization
- [Resource Utilization] Worker Utilization per Job
- [Throughput] BytesRead, RecordsRead, FilesRead, PartitionRead (Avg)
- [Throughput] BytesWritten, RecordsWritten, FilesWritten (Avg)

- [Resource Utilization Disk Available GB (Min)
- [Resource Utilization Max Disk Used % (Max)

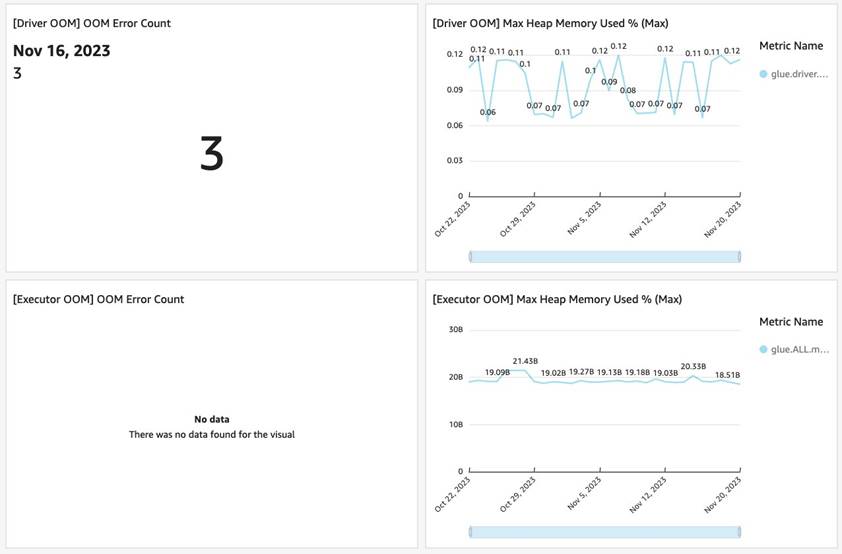
- [Driver OOM] OOM Error Count
- [Driver OOM] Max Heap Memory Used % (Max)
- [Executor OOM] OOM Error Count
- [Executor OOM] Max Heap Memory Used % (Max)
By default, the Insights tab has following insights:
- Bottom Ranked Worker Utilization
- Top Ranked Skewness Job

- Forecast Worker Utilization
- Top Mover readBytes

You can add any new graph charts or insights using the observability metrics based on your requirements.
Publish the QuickSight dashboard
When the analysis is ready, complete the following steps to publish the dashboard:
- Choose PUBLISH.
- Select Publish new dashboard as, and enter
GlueObservabilityDashboard. - Choose Publish dashboard.

Then you can view and share the dashboard.

Visualize and analyze with AWS Glue job observability metrics
Let’s use the dashboard to make AWS Glue usage more performant.
Looking at the Skewness Job per Job visualization, there was spike on November 1, 2023. The skewness metrics of the job multistage-demo showed 9.53, which is significantly higher than others.

Let’s drill down into details. You can choose Controls, and change filter conditions based on date time, Region, AWS account ID, AWS Glue job name, job run ID, and the source and sink of the data stores. For now, let’s filter with the job name multistage-demo.

The filtered Worker Utilization per Job visualization shows 0.5, and its minimum value was 0.16. It seems like that there is a room for improvement in resource utilization. This observation guides you to enable auto scaling for this job to increase the worker utilization.

Clean up
Run the following commands to clean up your AWS resources:
- Run the following command using the monitoring account to clean up resources:
Run the following command using the source account to clean up resources:
Considerations
QuickSight integration is designed for analysis and better flexibility. You can aggregate metrics based on any fields. When dealing with many jobs at once, QuickSight insights help you identify problematic jobs.
QuickSight integration is achieved with more resources in your environments. The monitoring account needs an AWS Glue database, table, crawler, and S3 bucket, and the ability to run Athena queries to visualize metrics in QuickSight. Each source account needs to have one metric stream and one Firehose delivery stream. This can incur additional costs.
All the required resources are templatized in AWS CDK.
Conclusion
In this post, we explored how to visualize and analyze AWS Glue job observability metrics on QuickSight using CloudWatch metric streams and SPICE. By connecting the new observability metrics to interactive QuickSight dashboards, you can uncover daily, weekly, and monthly patterns to optimize AWS Glue job usage. The rich visualization capabilities of QuickSight allow you to analyze trends in metrics like worker utilization, error categories, throughput, and more. Aggregating metrics and slicing data by different dimensions such as job name can provide deeper insights.
The sample dashboard showed metrics over time, top errors, and comparative job analytics. These visualizations and reports can be securely shared with teams across the organization. With data-driven insights on the AWS Glue observability metrics, you can have deeper insights on performance bottlenecks, common errors, and more.
About the Authors
 Noritaka Sekiyama is a Principal Big Data Architect on the AWS Glue team. He is responsible for building software artifacts to help customers. In his spare time, he enjoys cycling with his new road bike.
 Chuhan Liu is a Software Development Engineer on the AWS Glue team. He is passionate about building scalable distributed systems for big data processing, analytics, and management. In his spare time, he enjoys playing tennis.
 XiaoRun Yu is a Software Development Engineer on the AWS Glue team. He is working on building new features for AWS Glue to help customers. Outside of work, Xiaorun enjoys exploring new places in the Bay Area.
 Sean Ma is a Principal Product Manager on the AWS Glue team. He has a track record of more than 18 years innovating and delivering enterprise products that unlock the power of data for users. Outside of work, Sean enjoys scuba diving and college football.
 Mohit Saxena is a Senior Software Development Manager on the AWS Glue team. His team focuses on building distributed systems to enable customers with interactive and simple to use interfaces to efficiently manage and transform petabytes of data seamlessly across data lakes on Amazon S3, databases and data-warehouses on cloud.
- SEO Powered Content & PR Distribution. Get Amplified Today.
- PlatoData.Network Vertical Generative Ai. Empower Yourself. Access Here.
- PlatoAiStream. Web3 Intelligence. Knowledge Amplified. Access Here.
- PlatoESG. Carbon, CleanTech, Energy, Environment, Solar, Waste Management. Access Here.
- PlatoHealth. Biotech and Clinical Trials Intelligence. Access Here.
- Source: https://aws.amazon.com/blogs/big-data/enhance-monitoring-and-debugging-for-aws-glue-jobs-using-new-job-observability-metrics-part-3-visualization-and-trend-analysis-using-amazon-quicksight/

