Computational design strategy
Short loops to connect pRO-2.3 helices into a single chain were designed using an exhaustive database of backbone samples composed of fragments spanning two helical regions as identified by DSSP in high-resolution crystallographic structures (as described previously14). Loops were identified in this database via rigid alignment of the terminal residues of the fragment and target using an optimized superposition algorithm15. Candidates that met an alignment tolerance of 0.35 Å RMSD were aligned to the target backbone via torsion–space coordinates and soft coordinate constraints to the aligned candidate backbone heavy-atom coordinates. Candidate loop sequences were then designed under sequence profile constraints generated via alignment of the loop backbone to the source structure database. The candidates with the lowest scores were selected for the final loop design.
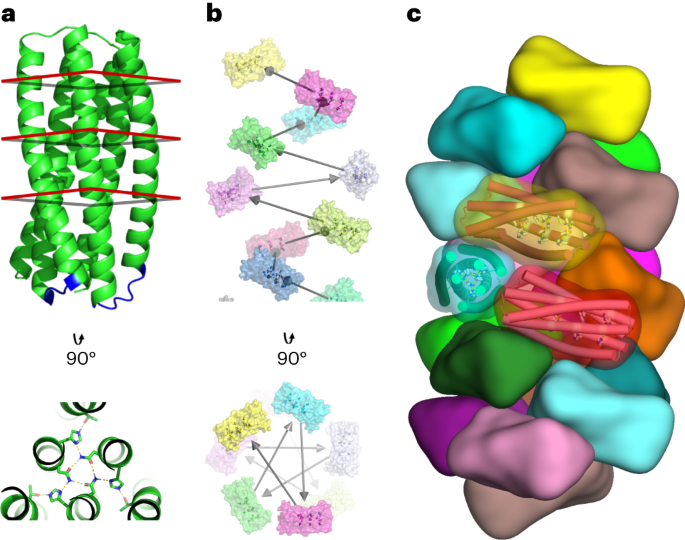
Helical docking and design methods7 were applied to the linked pRO-2.3 to generate helical filament design models. The following criteria filtered individual design trajectories: a discrepancy exceeding −15.0 Rosetta energy units between the bound (polymeric) and unbound (monomeric) states, an interface surface area surpassing 700 Å2, a Rosetta shape complementarity exceeding 0.62 and an unsatisfied polar residues count below 5. Designs satisfying these criteria underwent manual refinement, involving single-point reversions to mutations deemed non-contributory to stabilizing the interface’s bound state. The top-scoring design for each docked configuration was then integrated into a finalized protein set for experimental validation.
Protein expression and purification
The synthetic genes for a total of 18 designs were optimized for expression in Escherichia coli and acquired from IDT, then inserted into the pET29b+ vector’s multiple cloning site between NdeI and XhoI restriction sites. These constructs were introduced into BL21* (DE3) E. coli competent cells. Transformants were cultured in 50 ml Terrific Broth medium supplemented with 200 mg l−1 kanamycin. Expression, under the control of a T7 promoter, proceeded for 24 h at 37 °C using Studier autoinduction16 until cultures were harvested by centrifugation. Cell pellets were resuspended in Tris-buffered saline (TBS) and lysed with Bugbuster detergent. The soluble fraction, clarified by centrifugation, underwent purification via Ni2+ immobilized metal affinity chromatography using Ni-NTA Superflow resin. The resin with bound cell lysate was washed with ten column volumes of 40 mM imidazole and 500 mM NaCl, followed by elution with 400 mM imidazole and 75 mM NaCl. The soluble and insoluble fractions were subjected to SDS–polyacrylamide gel electrophoresis analysis. Samples exhibiting protein bands at the correct molecular weight were chosen for electron microscopy screening. Selected designs were scaled up to 0.5 l for further characterization, with expression again proceeding for 24 h at 37 °C using Studier autoinduction16 before harvesting by centrifugation. Cell pellets were resuspended in TBS and lysed by microfluidization, followed by purification as described above.
Negative stain EM
Soluble fractions were concentrated in TBS (25 mM Tris buffer, 75 mM NaCl, pH 8) for electron microscopy screening. A 6 µl droplet (1 µl sample instantly diluted with 5 µl of buffer) was applied onto negatively glow-discharged, carbon-coated 200-mesh copper grids, washed with Milli-Q water and stained using either 0.75% uranyl formate (pH 4.0) or Nano-W (pH 6.8) purchased from Nanoprobes, Inc. as described previously17. Screening was conducted using either a 100 kV Morgagni M268 transmission electron microscope (FEI) or a 120 kV Talos L120C transmission electron microscope (ThermoFisher). Images were captured using a bottom-mount Teitz CMOS 4k camera system and processed for enhanced contrast using Fiji software (version: 2.14.0/1.54f)18 for clarity.
Fibre lengths were quantified using the fibre tracing algorithm in cryoSPARC8. This method identifies fibres by cross-correlation to a template class and tracing contiguous fibres from the identified particles. A template class generated from DpHF19 was used for all fibres measured. Fibres were filtered according to the average curvature (<0.0005 Å−1) and the average normalized cross-correlation (>0.5) across each fibre. For DpHF18, we used 5, 2, 3, 20, 28 and 21 images for pH 3, 3.5, 4.2, 5, 8 and 3 to 8, respectively. For DpHF19, we used 7, 8, 8, 28, 4 and 5 images for pH 3, 3.5, 4.2, 5, 8 and 3 to 8, respectively. For DpHF19_9his, we used 6, 6, 8, 14, 15, 8 and 4 images were used for pH 3, 3.5, 4.2, 5, 6, 8 and 3 to 8, respectively.
Cryo-EM
Cryo-EM samples were prepared by applying protein to CFLAT holey-carbon grids, blotting away liquid and plunging the grids into liquid ethane using a Vitrobot (ThermoFisher). For DpHF19, videos were acquired on a Glacios microscope (ThermoFisher) equipped with a K-2 Summit Direct Detect camera (Gatan Inc.) operating in counting mode, with a pixel size of 1.16 Å per pixel, 50 frames and a total electron dose of 65 Å−2. For DpHF18 and DpHF7, videos were acquired on a Titan Krios (ThermoFisher) equipped with a K-2 Summit Direct Detect camera (Gatan Inc.) operating in super-resolution mode, with a pixel size of 0.525 Å per pixel, 50 frames and a total electron dose of 90 Å−2. Automated data collection was performed using Leginon19 version 3.4. Data processing was performed using cryoSPARC8, and workflows are summarized in Supplementary Figs. 10–12. The videos were aligned by patch motion correction, with super-resolution videos binned to a pixel size of 1.05 Å. Contrast transfer function (CTF) parameters were estimated using patch CTF. Template-free filament tracing was performed on a subset of images, and the resulting particles were subjected to 2D classification. Selected 2D classes were then used as templates for template-based filament tracing on full datasets. Following multiple rounds of 2D classification, selected particles were subjected to 3D refinement with helical symmetry imposed and non-uniform refinement enabled. For DpHF19, we imposed one-start helical symmetry relating individual, non-contacting subunits, rather than the two-start helical symmetry parameters. For DpHF7 and DpHF19, per-particle defocus, beam tilt and spherical aberration were also refined. Density modification was performed using ResolveCryoEM in Phenix20,21 version phenix-1.20.1. Atomic models for DpHF18 and DpHF19 were refined into cryo-EM maps using ISOLDE22, followed by real-space refinement in Phenix, with rotamer and Ramachandran restraints disabled and with reference restraints imposed by the input starting model. The elucidation of the model for DpHF7 employed the de novo model building protocol on the segmented cryo-EM asymmetric unit density23. Subsequent residue incorporation and refinement were achieved using RosettaCM24 version 2019.31, leveraging symmetry across the unsegmented cryo-EM map for optimal fit-to-density and intra-filament interfaces. A final round of real-space refinement was performed in Phenix, as described above for DpHF18 and DpHF19. Cryo-EM data collection, refinement and validation statistics are summarized in Supplementary Table 1.
TIRFM
Fibre assembly
To image seeded nucleation of pH-responsive fibres, DpHF18 fibres were labelled with two different maleimide-conjugated fluorophores, Oregon488 and sulfo-Cy5. Fibres were labelled with a 10× molar excess, in PBS + 1 mM TCEP for 4 h at room temperature, before buffer exchange into TBS (25 mM Tris, 100 mM NaCl, pH 8.0) on a Zeba spin column and concentration to 30 μM. Green fibres at 30 μM were disassembled through the addition of 1 M citrate (0.6 μl of citrate to 20 μl of fibres) to reduce the pH to 3.0. The solution was incubated for 5 min before the addition of Tris (3.6 μl of 1 M stock) to bring the pH back to 8.0; 1 μl of assembled DpHF18–Cy5 fibres at 30 μM was added to the solution. The solution was subsequently incubated at room temperature before centrifugation at 13,000 g for 2 min in a benchtop centrifuge. Fibres were resuspended in TBS and imaged by TIRFM.
Fibre disassembly
Fast TIRFM imaging of fibres disassembling at low pH was performed on a custom-built TIRF system based on a Nikon Ti stand equipped with perfect focus system alongside a fast Z piezo stage (ASI), an azimuthal TIRF illuminator (iLas2, Roper France) with a custom extended field of view (Cairn) and a PLAN Apo 1.45 NA ×100 objective. Images were acquired with a Photometrics Prime 95B back-illuminated sCMOS camera run in pseudo global shutter mode, synchronized with the azimuthal illumination. The system was operated by Metamorph 7.10.1.161. Sulfo-Cy5 maleimide-labelled fibres were imaged with a 630 nm laser (150 mW Coherent OBIS mounted in a Cairn laser launch) and imaged using a Chroma ET655lp filter mounted in a Cairn Optospin wheel at a frame rate of 1 frame every 16 ms.
Fibres were imaged in imaging buffer (25 mM Tris pH 8.0, 100 mM NaCl) in an Ibidi flow cell mounted on clean room-grade coverslips (custom, 25 × 75 mm2, Nexterion), and passivated with PLL-PEG (0.1 mg ml−1 in 20 mM Hepes, pH 7.6; 5 min). Fibres were allowed to deposit on the coverslip for 5 min before unbound fibres were removed with the imaging buffer. During fast acquisition, the pH was reduced by flowing in low-pH buffer (25 mM Tris, 100 mM NaCl, pH 3.0).
To measure fibre disassembly in bulk solution, pre-formed fibres in 1.5 ml Eppendorf tubes were exchanged into citrate buffers at lower pH to stimulate disassembly. A portion of each pH reaction was removed at various time points and added to a 96 well plate and for 10 min to allow the fibres to settle and adhere to the glass substrate. For each condition and time point, nine fields of view were acquired on an IN Cell Analyzer 2500HS microscope (Molecular Devices) using a Nikon ×60 PLAN Apo 0.95 NA air objective and a 631 nm LED excitation source, 150 ms exposure time with emission collected through a 684 ± 24 nm bandpass filter. Images were quantified using a custom CellProfiler script to segment fibres with the Otsu thresholding algorithm25. Upper and lower limits of the threshold, as well as the adaptive window for object ID, were adjusted until fibres were correctly identified relative to the background signal. The major axis length of objects identified using the CellProfiler pipeline were plotted against incubation time for each pH condition.
Liquid-phase AFM
Sample preparation
We incubated 10 µl of a 0.01 wt% poly-lysine solution on a freshly cleaved muscovite mica surface (12 mm, Ted Pella Inc.) for 2 min. The excess solution was removed and the surface was rinsed with water and dried with N2 gas7. Then 30 µl 10 µM protein solution in the imaging buffer (25 mM Tris-HCl, 400 mM NaCl at pH 8) was incubated on the poly-lysine-coated mica for 30 min and washed with the image buffer to remove excess protein. The pH of the disassembly buffer (25 mM Tris-HCl, 400 mM NaCl, pH 4.1, 4.4, 4, 5 or 4.7) was adjusted with 10 M NaOH or 1 M citric acid and filtered with 0.1 µm pore size PVDF filter before use. For photoacid experiments, 10 µM protein solution in 25 mM Tris-HCl pH 8 was incubated on bare mica for 30 min and washed with 25 mM Tris-HCl pH 5.5; an additional deposition and rinse step was carried out if the number density of fibres on the surface was low. We also freshly prepared 1 mM 2-nitrobenzaldehyde (Sigma-Aldrich) in 25 mM Tris-HCl pH 5.5 and immediately used it without exposure to light at any stage26. Spectroscopic and pH measurements indicated that 2-nitrobenzaldehyde is activatable between wavelengths of 200 and 405 nm and lowers the pH from 5.5 to 2.7, and that higher laser intensity leads to faster consumption and acidification.
Imaging
For the kinetic study at constant composition, the protein-coated poly-lysine mica substrates were placed under the AFM liquid cell (Bruker Multimode8). Images were captured in the imaging buffer using a clean silicon nitride cantilever (Bruker, SNL-10, spring constant: 0.12 N m−1, UV ozoned for 5 min) in tapping mode at room temperature (25 °C). Before flowing the disassembly buffer, the fibres were imaged continuously for 10 min to optimize the parameters (256 scan lines, 1.5 Hz scan rate, high integral gain (3–4) and 50–100 mV free amplitude). After confirming that no cantilever-induced damage occurred, the disassembly buffer was injected continuously at 25 µl min−1. The flow-through set-up was optimized to provide negligible residence time and fast pH switching10.
For the photoacid study, protein-coated mica with 25 mM Tris-HCl pH 5.5 was placed under the liquid cell of a Cypher VRS AFM (Asylum Research) equipped with BlueDrive laser (×0.3 intensity filter, 405 nm wavelength) with the vent valve open and operated in tapping mode. After confirming the high surface coverage of the fibres, the imaging buffer was replaced with 1 mM 2-nitrobenzaldehyde in 25 mM Tris-HCl pH 5.5, operated without exposure to visible background light and imaged again. The cantilever was then retracted, and BlueDrive was turned on and rastered across pre-selected areas repeatedly using the motorized optical microscope of the AFM. The total UV exposure time during raster/dwell for spot and line patterns was not more than 10 min, after which the cantilever was moved back to the exposed areas and imaged. For global pH changes, the quartz window of the AFM liquid cell in contact with the photoacid solution was exposed to a handheld UV lamp (364 nm wavelength) for 7 min, and then imaged.
Images were processed with Gwyddion SPM v2.62 data analysis software and analysed with Fiji software v1.53s18. For kinetics, the total fibre length was measured, and any fragments considered as already disassembled were excluded from the length measurement. To measure the disassembly rate at each end of individual fibres (Supplementary Fig. 8), the centre of the fibre (half of the initial length) was assigned as the second end for measuring length, whereas for fibre fragments, the centre of the fragment was measured as the second end.
- SEO Powered Content & PR Distribution. Get Amplified Today.
- PlatoData.Network Vertical Generative Ai. Empower Yourself. Access Here.
- PlatoAiStream. Web3 Intelligence. Knowledge Amplified. Access Here.
- PlatoESG. Carbon, CleanTech, Energy, Environment, Solar, Waste Management. Access Here.
- PlatoHealth. Biotech and Clinical Trials Intelligence. Access Here.
- Source: https://www.nature.com/articles/s41565-024-01641-1

