Learning different day trading patterns to include in your playbook is one of the first steps of becoming a trader.
As you progress , you will use trading patterns combined with context, trade management, and risk management to develop trading strategies.
I’m going to teach you several different types of patterns including Consolidation Patterns, Structural Patterns, and Candlestick Patterns.
You can use these trading patterns in any market including Stocks, Forex, Futures, Options, and/or Crypto.
Let’s get into it…
What is a Trading Pattern?
A Trading Pattern is a structural or consolidating price formation which can forecast the future price direction of a security.
There’s countless trading patterns that occur in the market every single day. It’s not necessary to remember all the individual names of the patterns, you just need to understand the logic.
It’s imperative that you understand the logic behind everything you do as a trader.
If you can’t explain the logic behind something in your strategy, you shouldn’t be using it. Failure to understand the logic generally leads to poor execution, and a red account.
In order to fully understand the first category of trading patterns in this guide, let’s review price consolidation.
What is Price Consolidation
Price Consolidation is when a security trades in a range due to buyer and seller aggression being in equilibrium. Price will continue to consolidate until a new buy or sell imbalance forms.
This definition is rooted in Auction Market Theory. AMT is a philosophy that financial markets move higher and lower due to imbalances between buyer and seller aggression (caused by market events) until price discovers a level where aggression is balanced and the most trade can be facilitated (Fair Value).
Let’s go a step further and break consolidation down on a granular level .
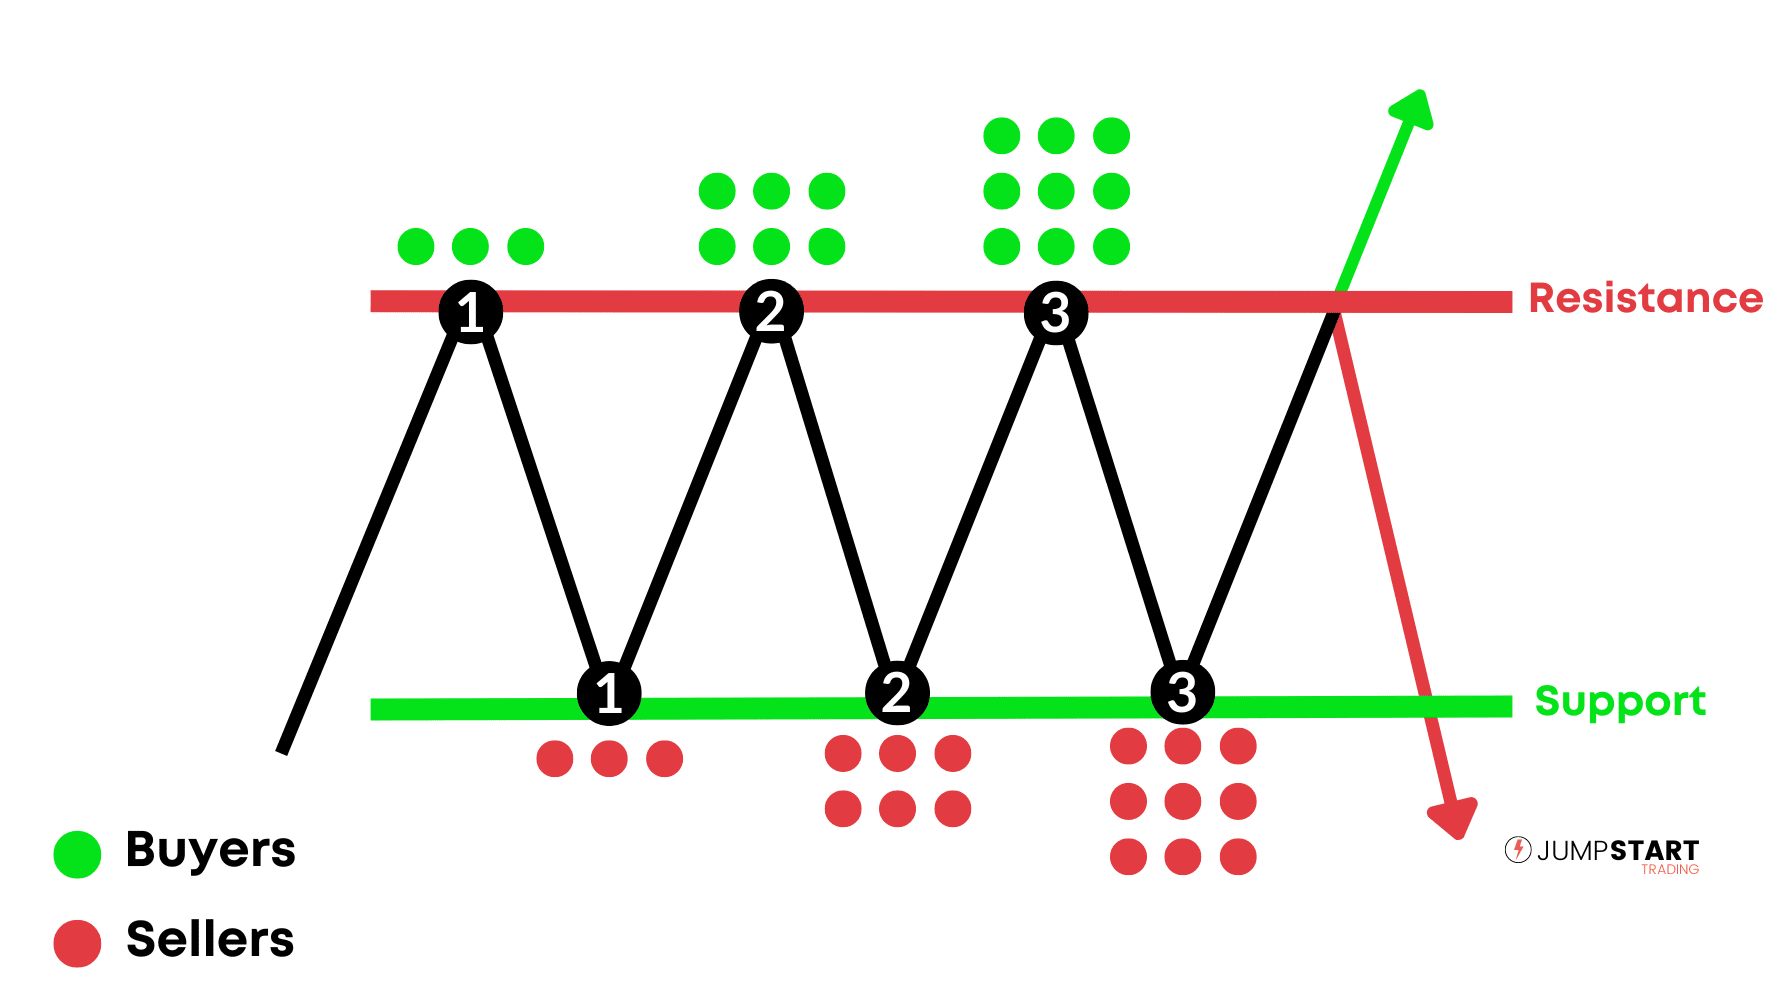
In the above illustration, price is consolidating into a range between a resistance (red line) and support level (green line).
When price is at point 1 of the resistance line, traders are getting short and placing their stops above the resistance level (represented by the green dots)
In the same manner, when price is at point 1 of the support line traders are getting long and placing their stops below the support level. (represented by red dots)
The longer price consolidates, the number of stop orders placed above resistance and below support continues to rise(point 2 & 3).
Once an imbalance does form, the force of the breakout will be determined by the number of stops that get triggered, as well as the number of traders looking to enter on the breakout.
An easy way to picture consolidation is to think of it as a spring. The longer price consolidates, the more compressed the spring will become.
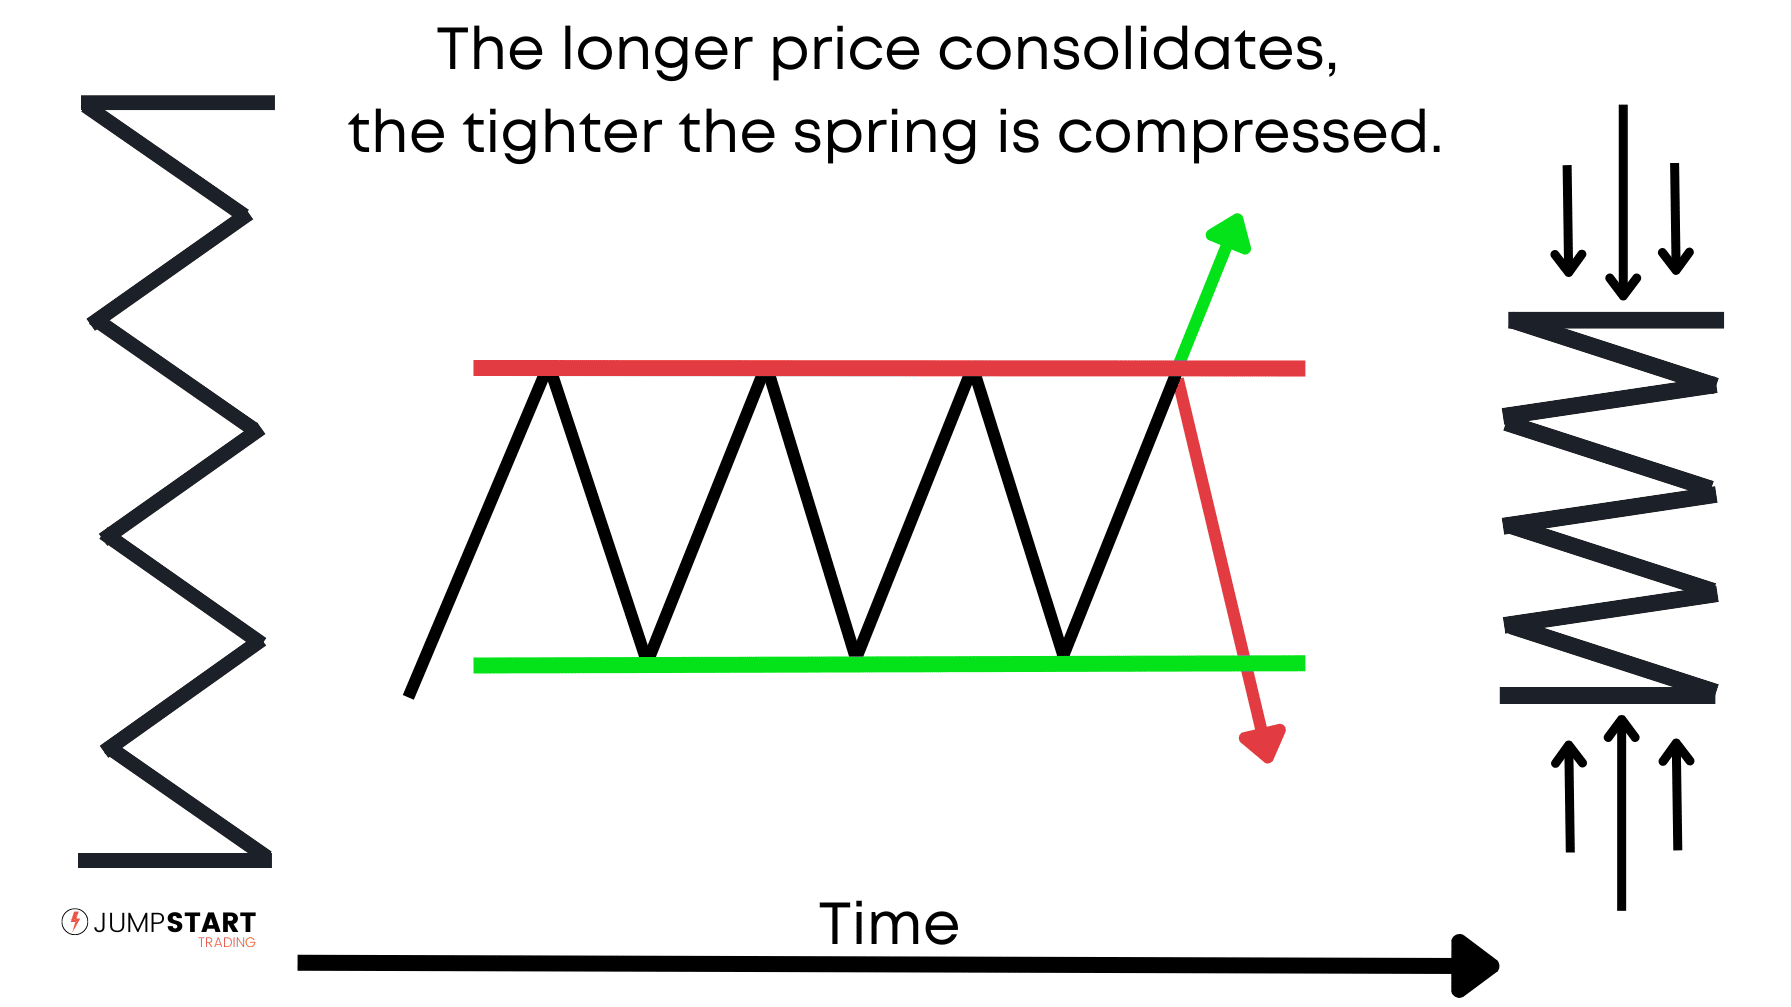
Eventually a large enough of an imbalance will form and price will break through support or resistance.
The tighter the spring was compressed (longer price consolidated), the more force behind the initial breakout.
Consolidation Trading Patterns
Now that you have an understanding of consolidation, it’s time to look at some different examples.
Someone with far too much time on their hands came up with all these fancy names.
Again, it’s not necessary to remember the names, they’re all simply consolidation patterns.
Yet, going through each of them will be good practice to drive the consolidation concept home.
1. Bullish Flag & Bearish Flag
Bull and bear flags have three components:
Flagpole: The initial uptrend (bullish flag) or downtrend (bearish flag) is the “pole” of the flag.
Consolidation: A brief pause in the trend where price begins to consolidate and retrace slightly
Breakout: Price breaks out of consolidation and the trend continues.
Bullish Flag
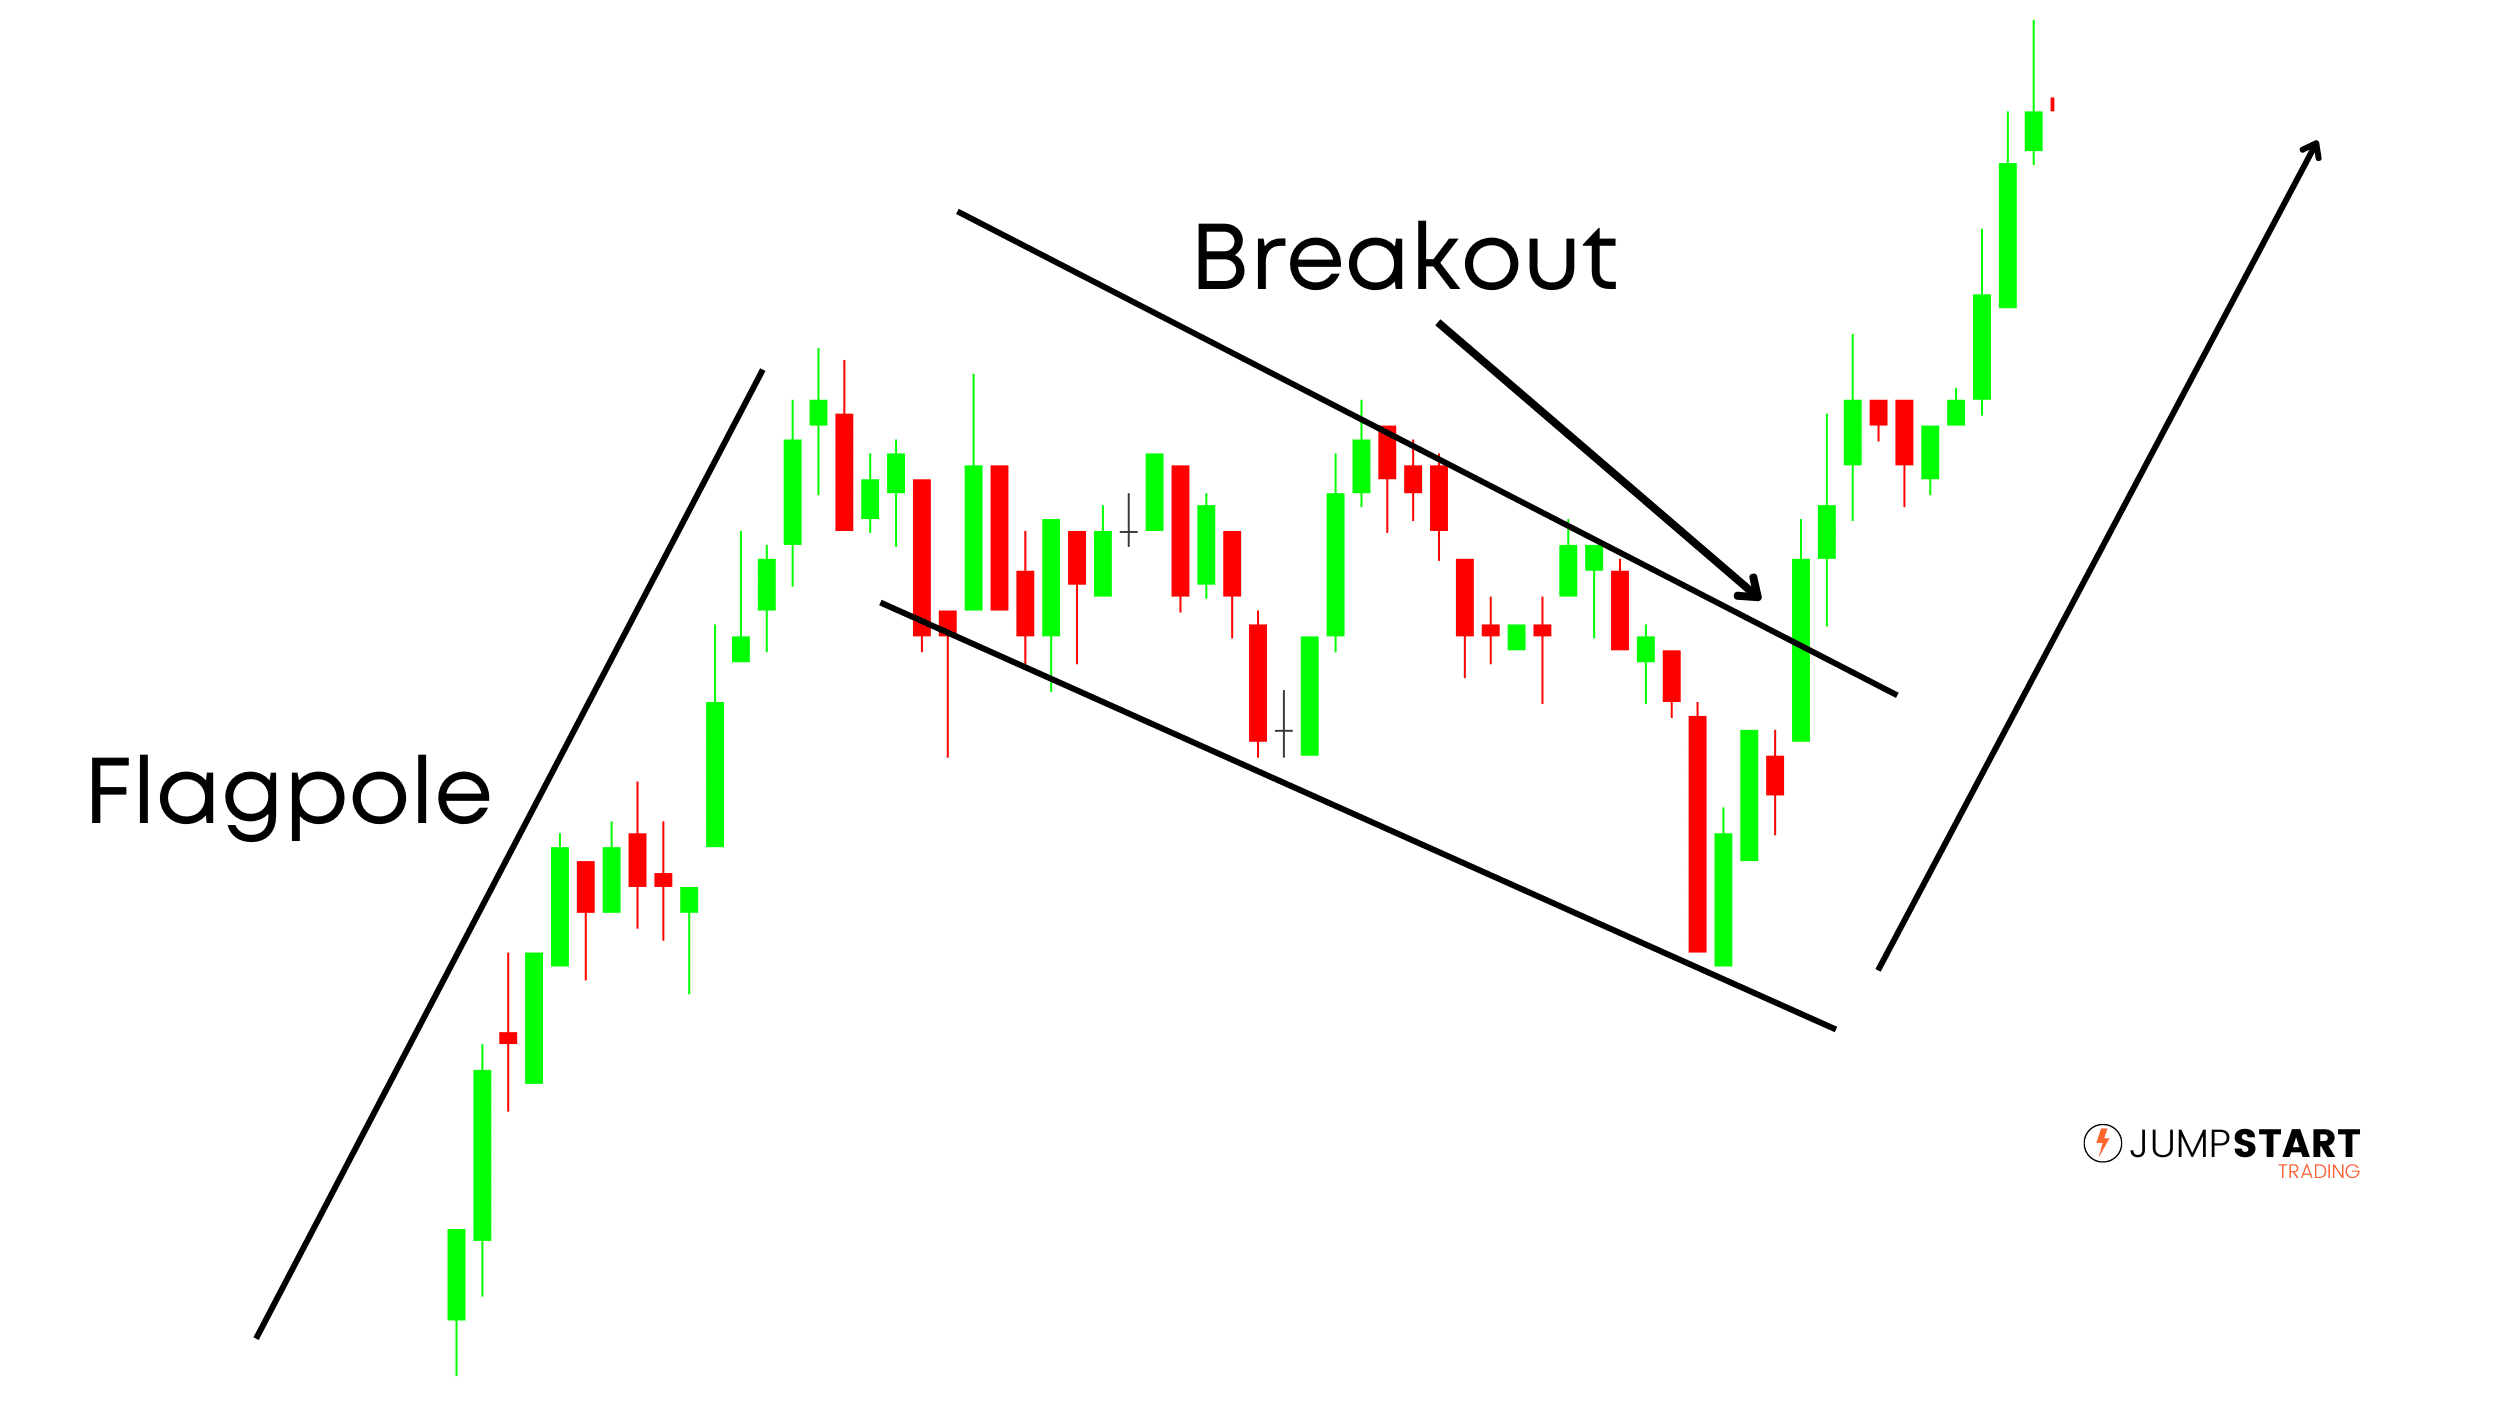
In the above bullish flag example, price initially breaks out into a new uptrend forming the flagpole.
Sellers eventually step in slowing the move down and price begins to consolidate and retrace (flag).
The lower prices attracts more buyers into the market and eventually a buy imbalance forms breaking price out of the consolidation range, continuing the trend.
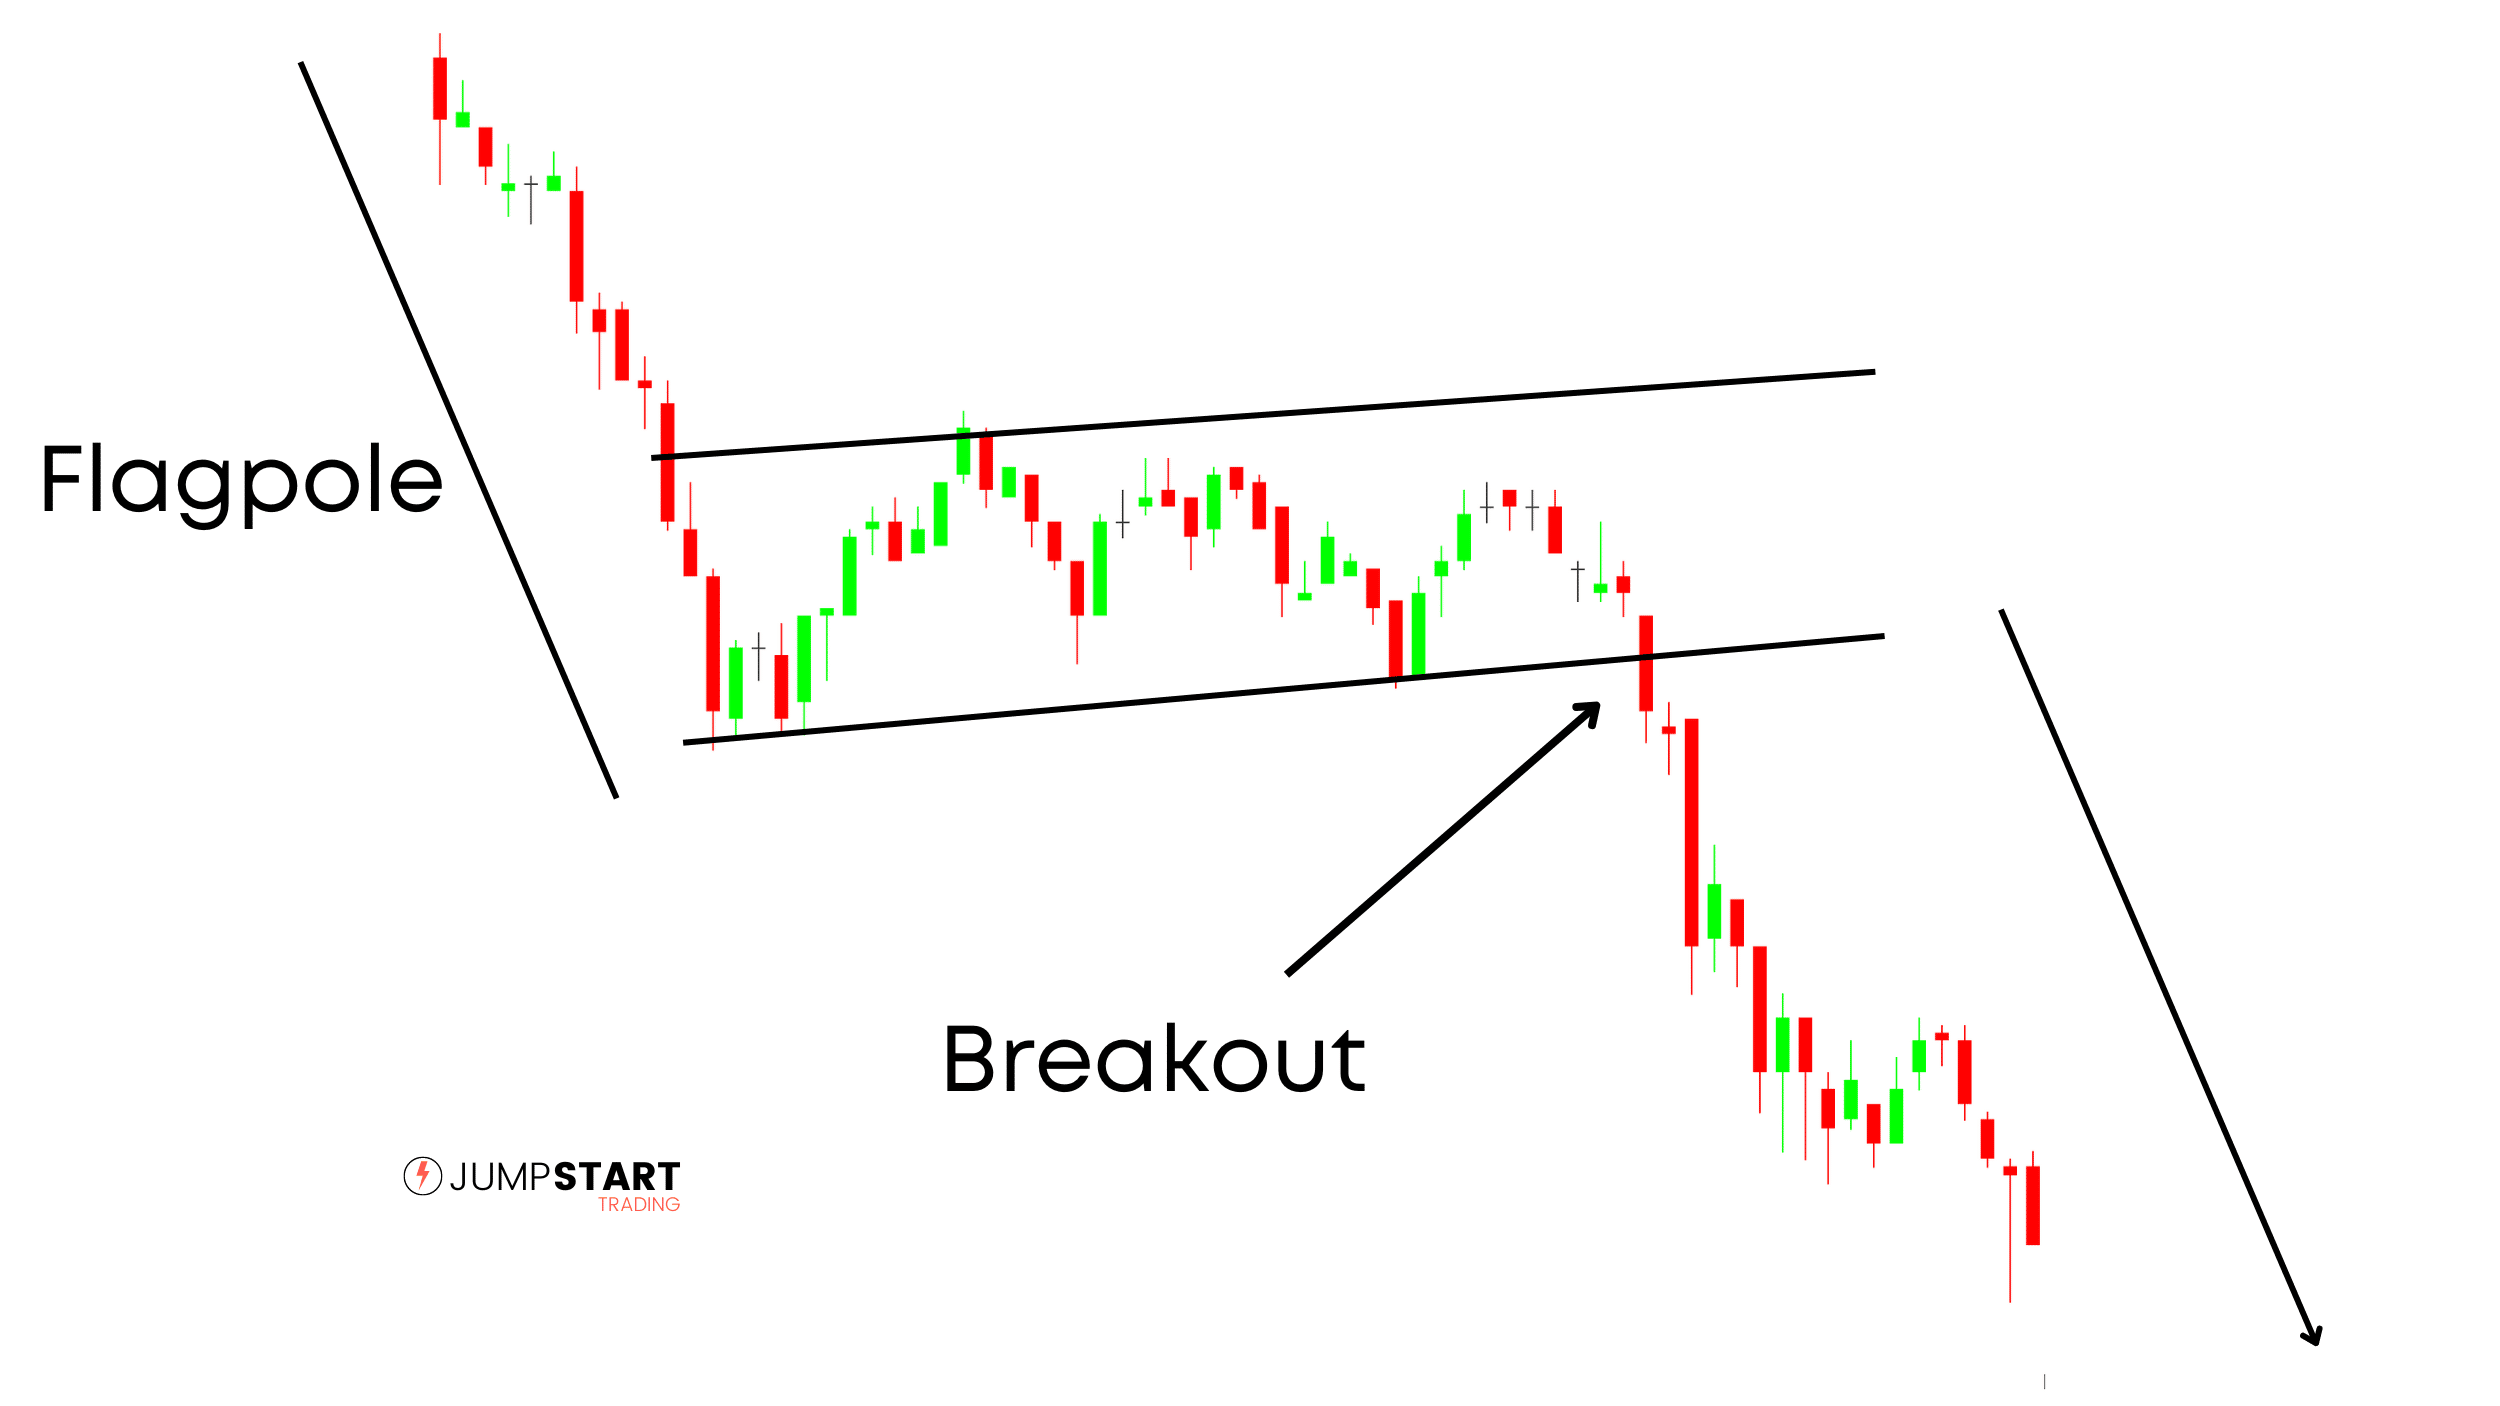
In the example below, we have a bearish flag pattern. Only difference is the direction of the trend.
Bearish Flag
2. Bullish & Bearish Pennants
Bullish and bearish pennants are very similar to flag patterns but price consolidates sideways rather than continuing to retrace.
Once again, both are nothing more than consolidation patterns.
Bullish Pennant

In the above bullish pennant you can see once again we have an initial uptrend followed by a period of consolidation.
Price consolidates and forms a pennant, constricting price into a tighter range. The sellers eventually become exhausted and price breaks out and continues the uptrend.
It’s important to note that with all of these patterns that the shape of the consolidation won’t always be a perfect pennant or flag.
Price may briefly breakout of the consolidation range yet close back inside before the interval is over.
When drawing patterns out on your charts, I recommend making sure you get the body of the candles inside your drawings, putting a smaller emphasis on the wicks.
Bearish Pennant
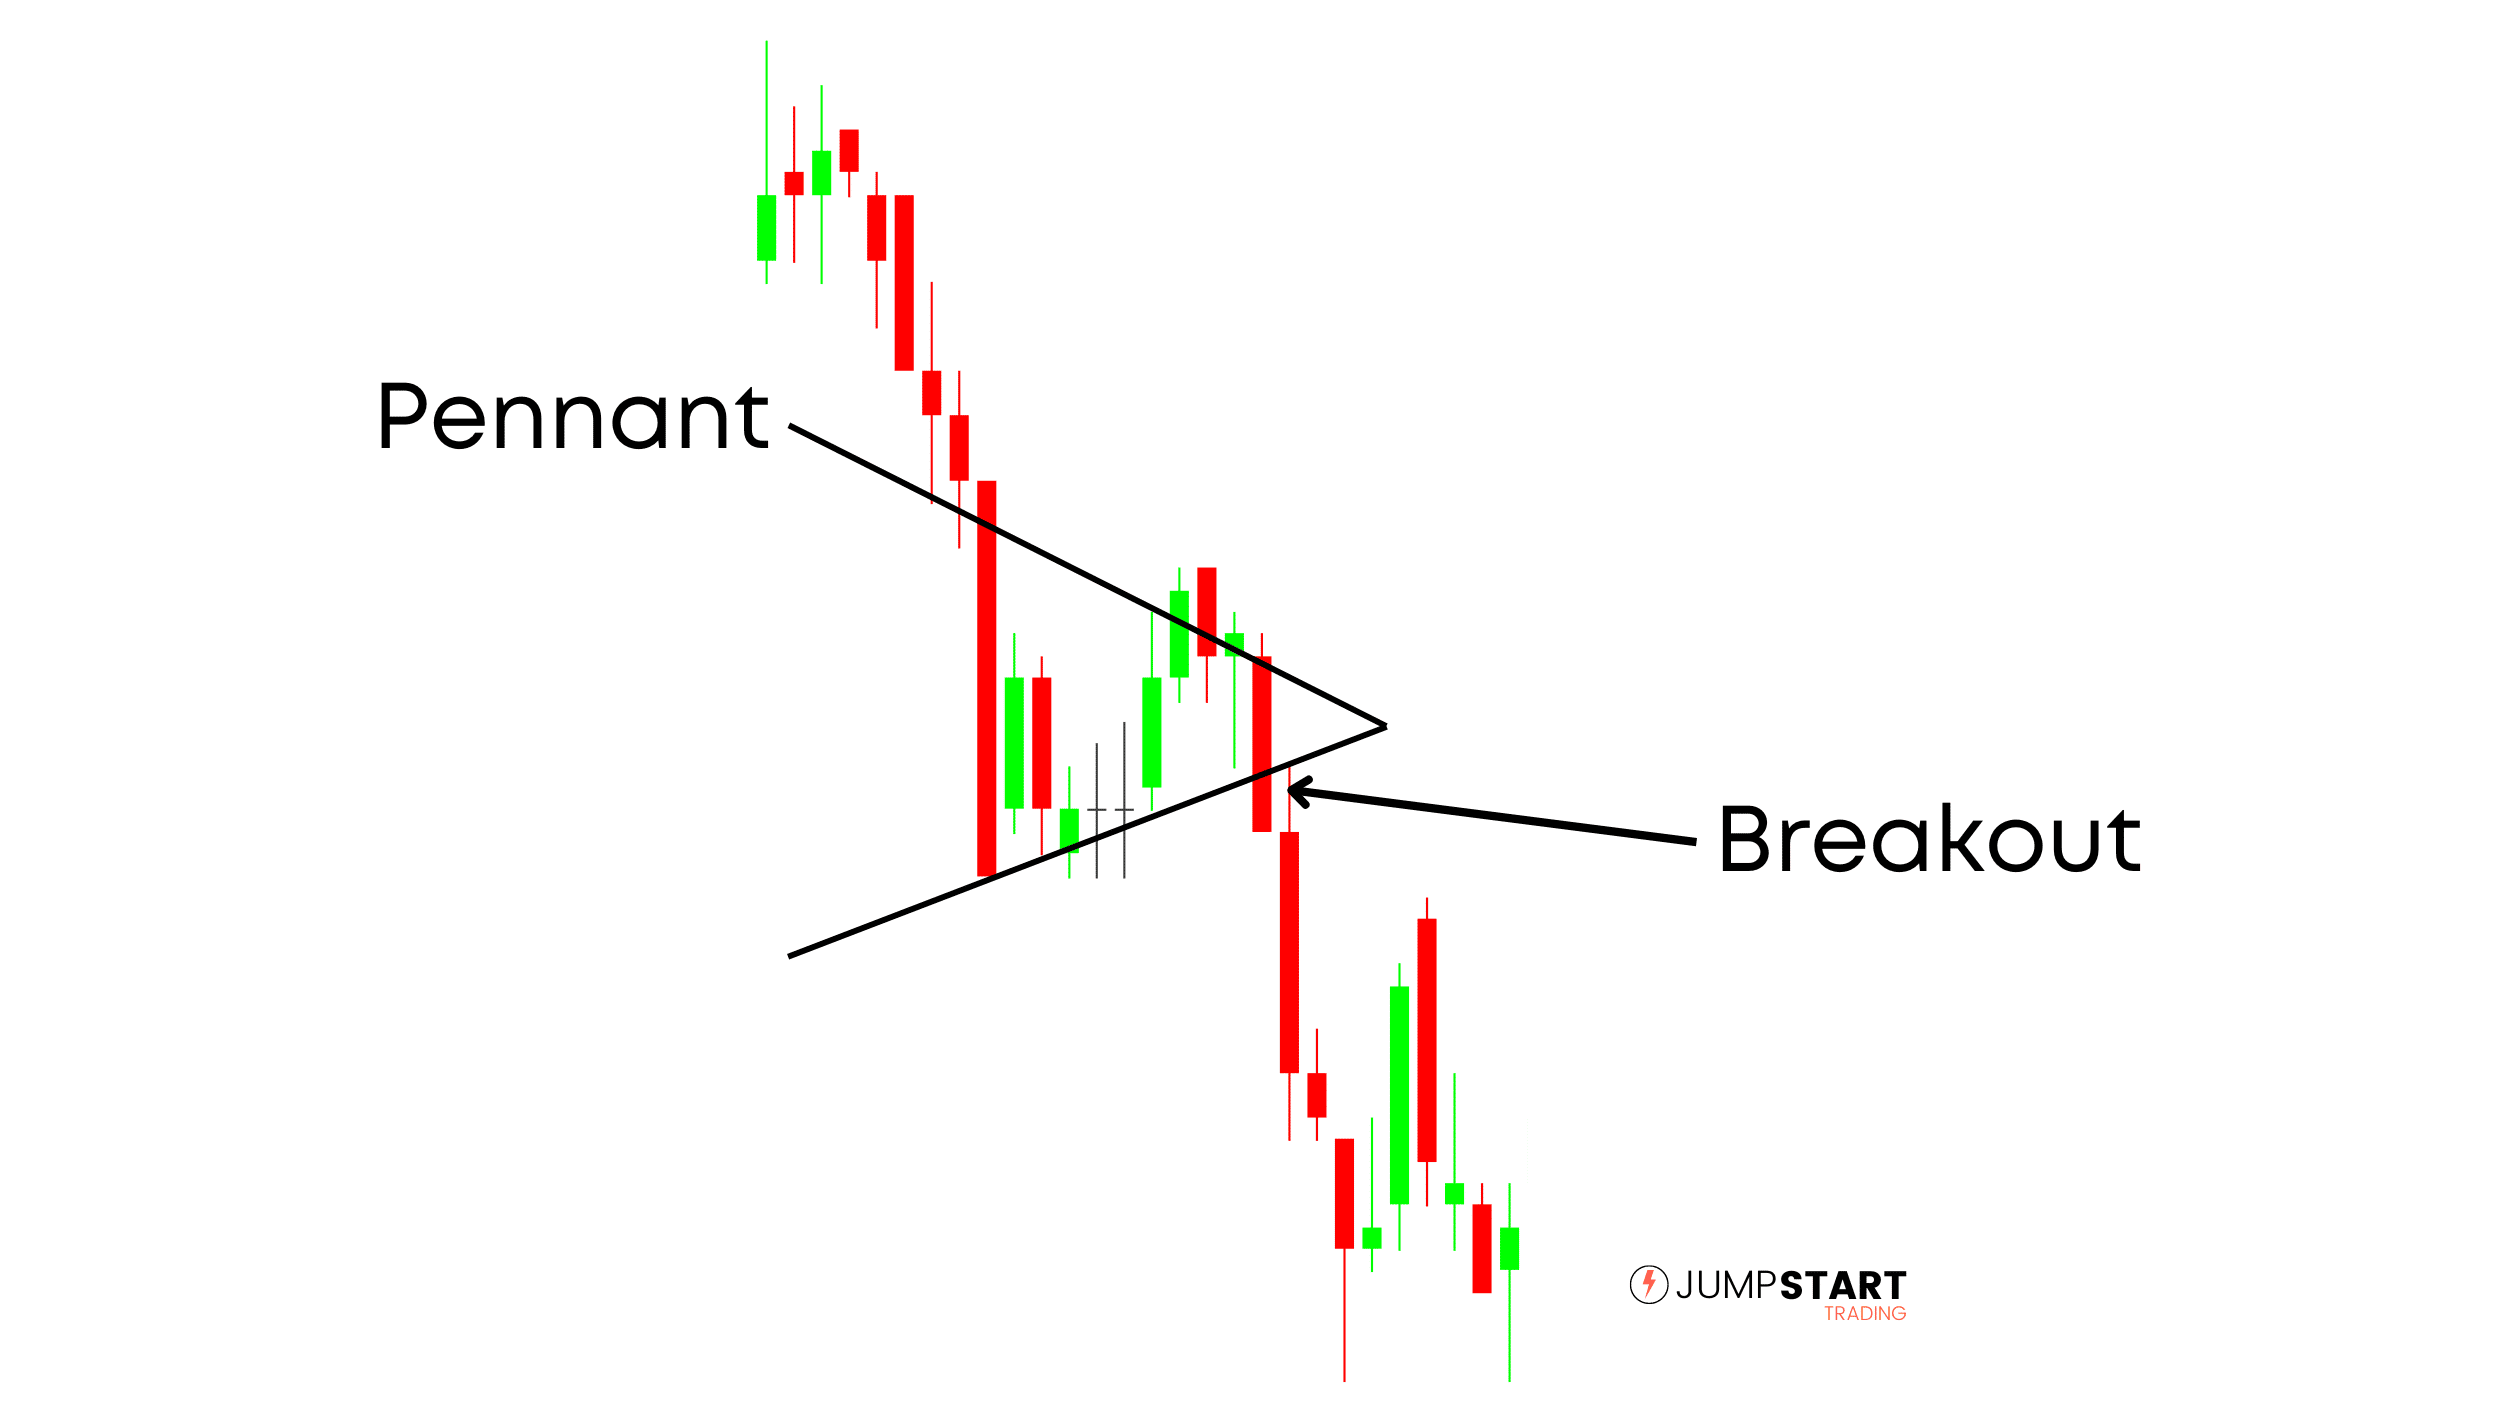
In the above bearish pennant, you can see a few wicks and a little price action on the upper part of the pennant sticking out.
Rarely are you going to find the perfect pattern where price perfectly touches a support or resistance level multiple times.
What’s important is to remember what is actually occurring.
A new trend, followed by a period of consolidation until an imbalance forms causing a breakout and the continuation of the trend.
3. Symmetrical, Ascending & Descending Triangles
The final consolidation patterns we will look at are symmetrical, ascending, and descending triangles.
On a fundamental level, these triangular patterns are the same as pennants.
Sure, structurally they may appear a little different, but what’s actually occurring is the same. Can you guess?
A new trend, followed by a period of consolidation until an imbalance forms causing a breakout and the continuation of the trend. 🙂
Ascending Triangle

Ascending triangles form in an uptrend when price reaches a resistance level that holds yet the support for the security continue to increase represented by price forming higher lows (HL).
Eventually a buy imbalance forms and price breaks out to the upside continuing the trend.
Descending Triangle
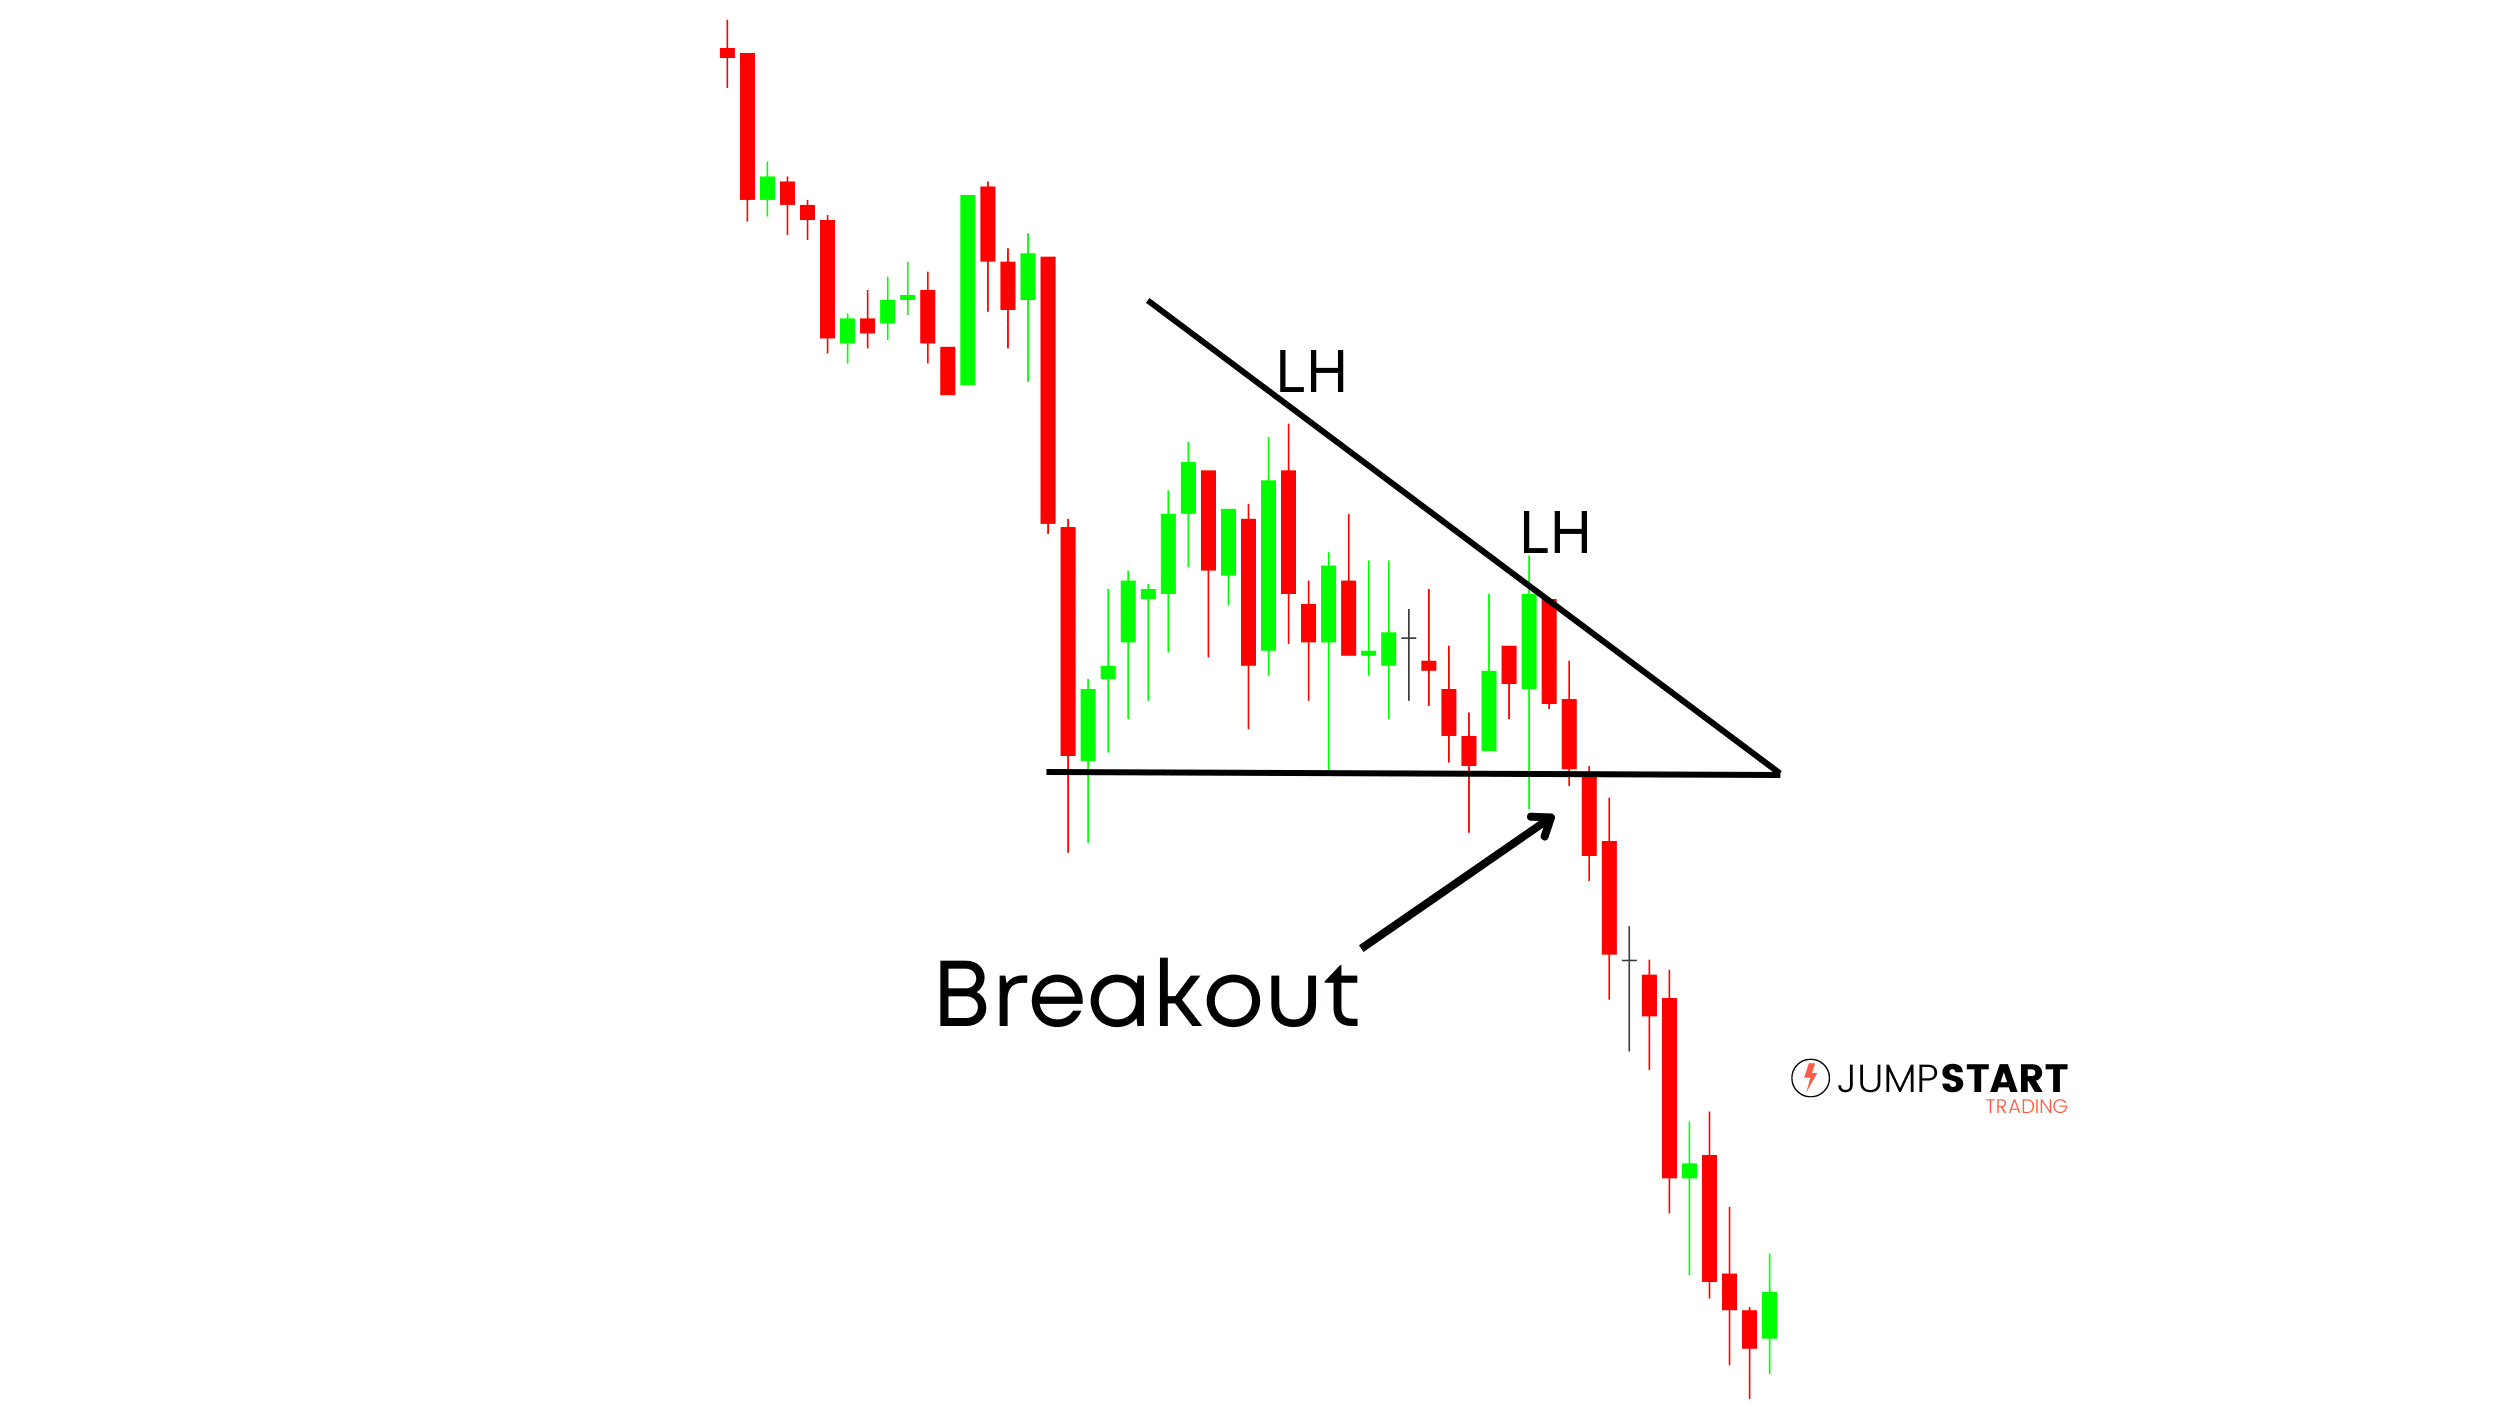
Descending triangles form in a downtrend when price reaches a support level that holds yet resistance is falling represented by price forming lower highs (LH).
Eventually a sell imbalance forms and price breaks out to the downside continuing the trend.
Symmetrical Triangle
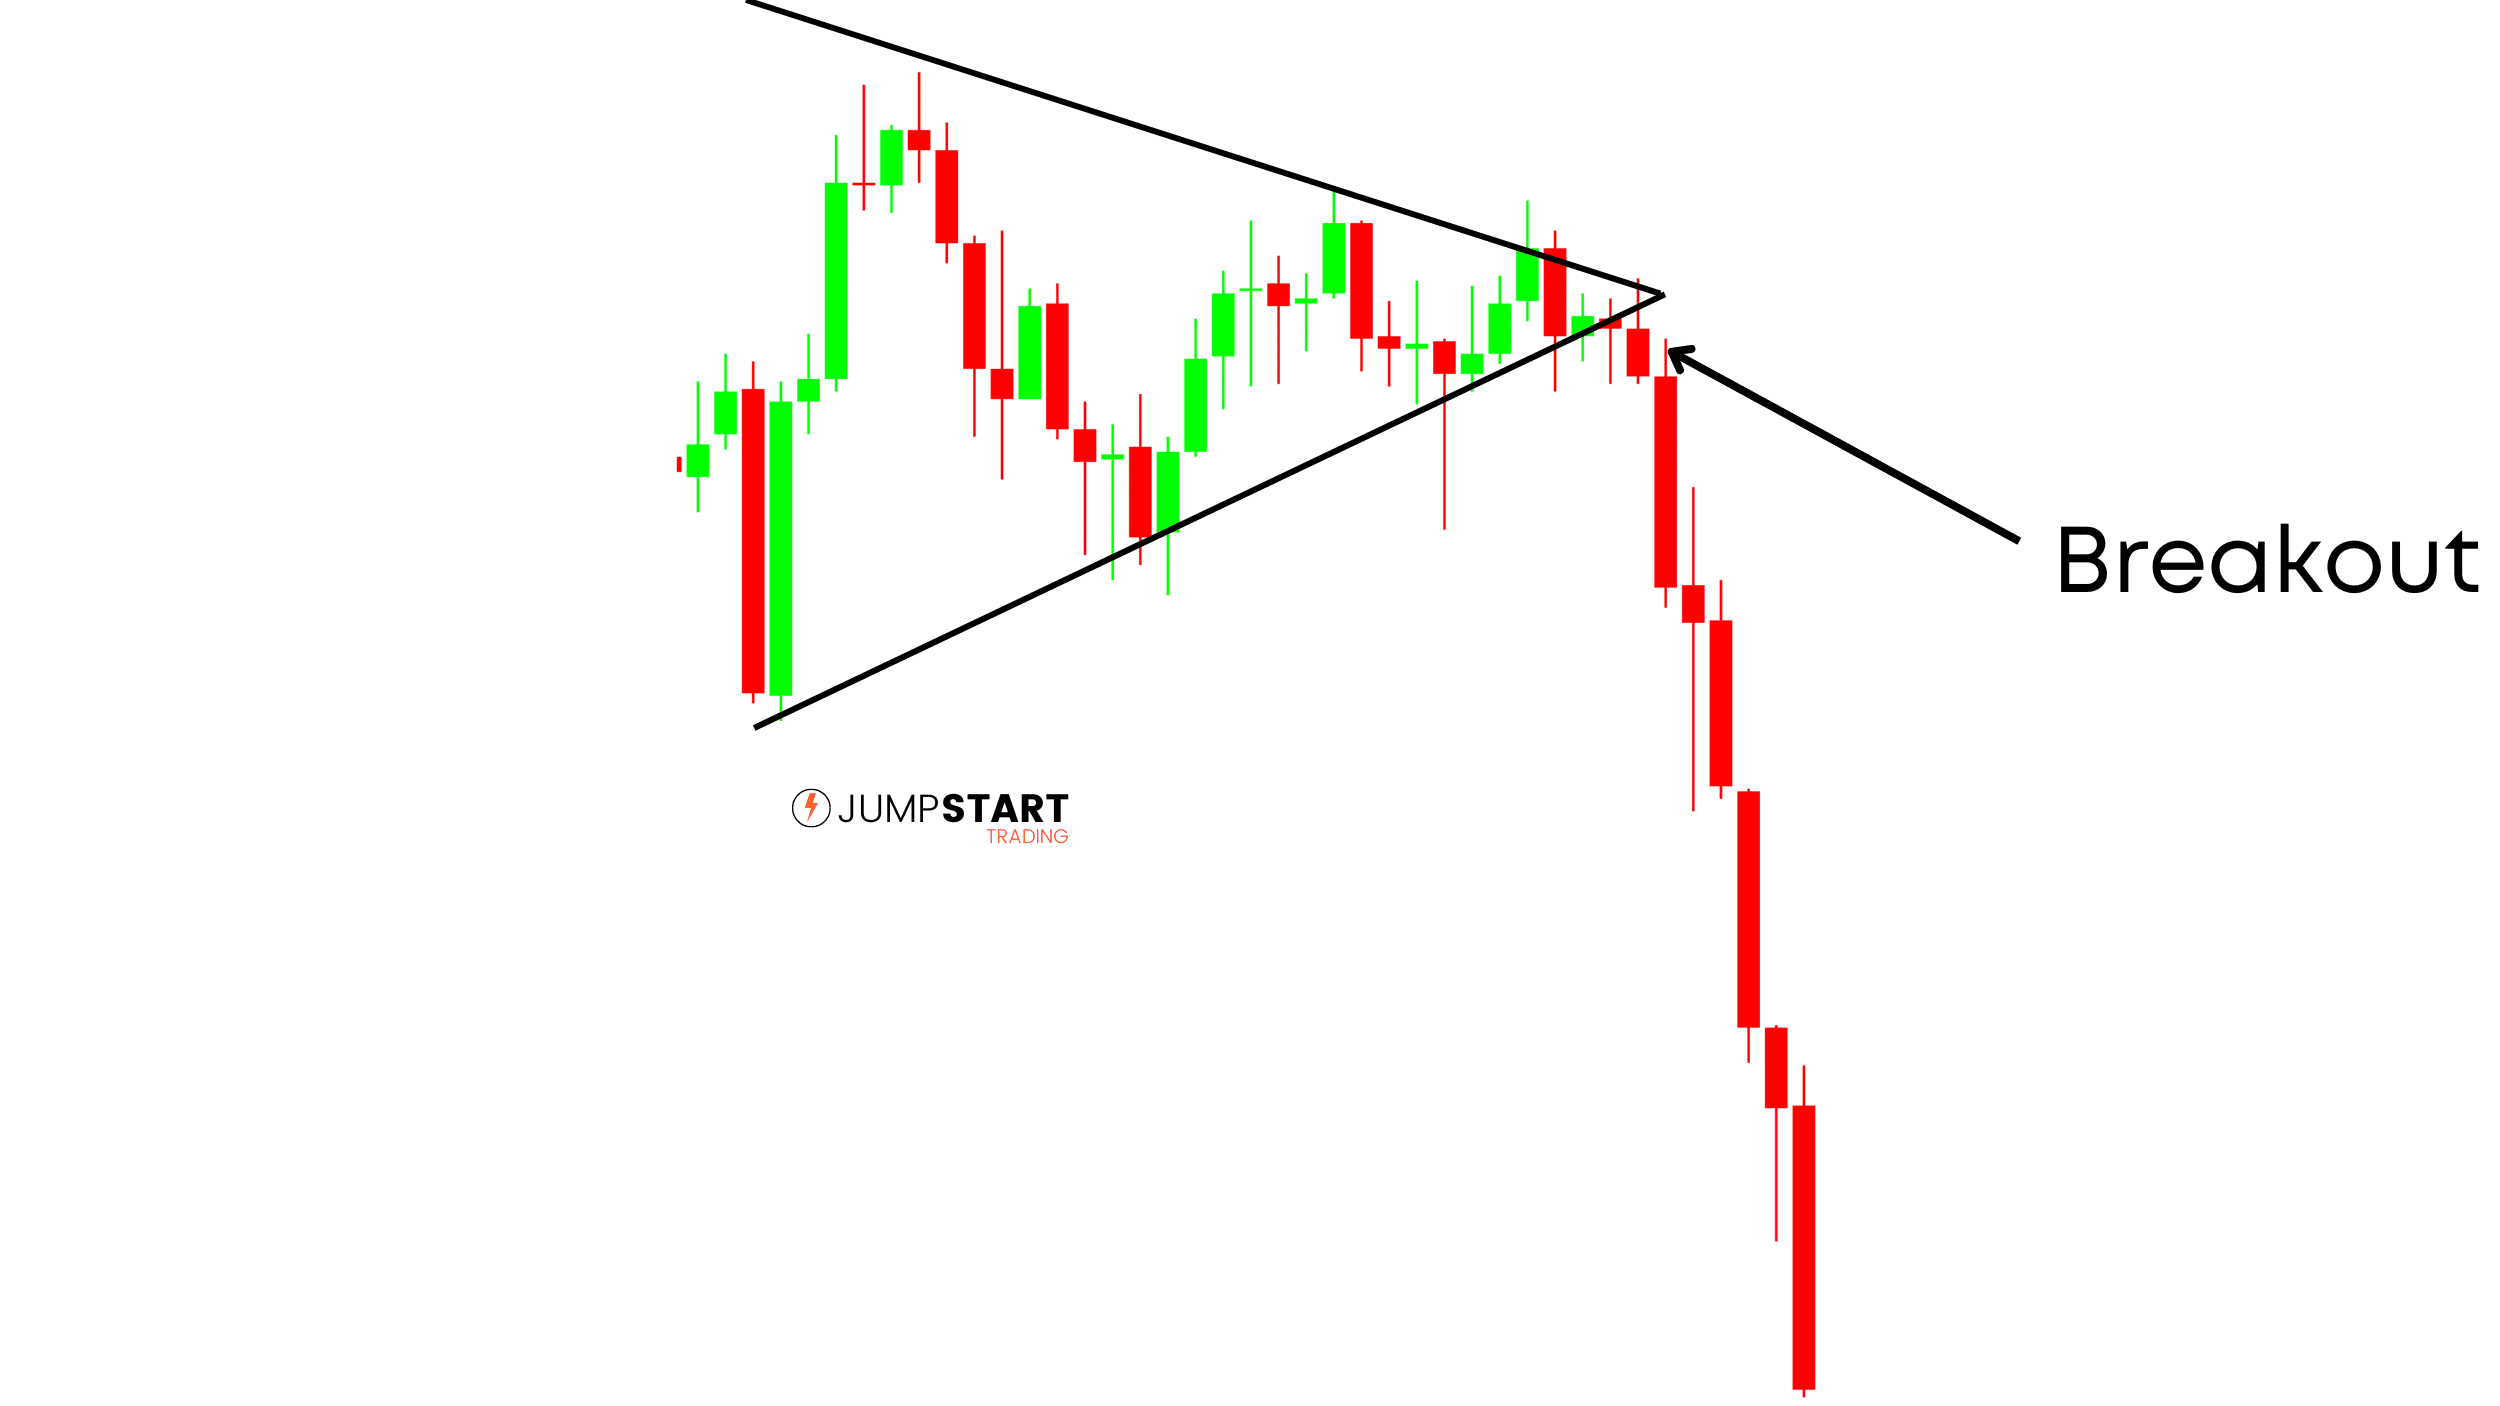
Finally, we have the symmetrical triangle pattern. Yep, just another fancy way to describe a pennant.
Price is trading into a constricting range and eventually an imbalance forms causing price to break out.
You can use these patterns on longer time frames to build context, or on your trigger charts to actually find entries.
Structural Trading Patterns
Structural trading patterns are defined by their shape, not as a result of consolidation.
While consolidation patterns can be used as a trigger or to build context, structural patterns are primarily used to build context around your setups.
1. Double Tops & Double Bottoms
Double tops and bottoms are great for building context and finding opportunities to look for a setup.
As the names imply, price retests a prior high or low and is rejected.
Double Bottom
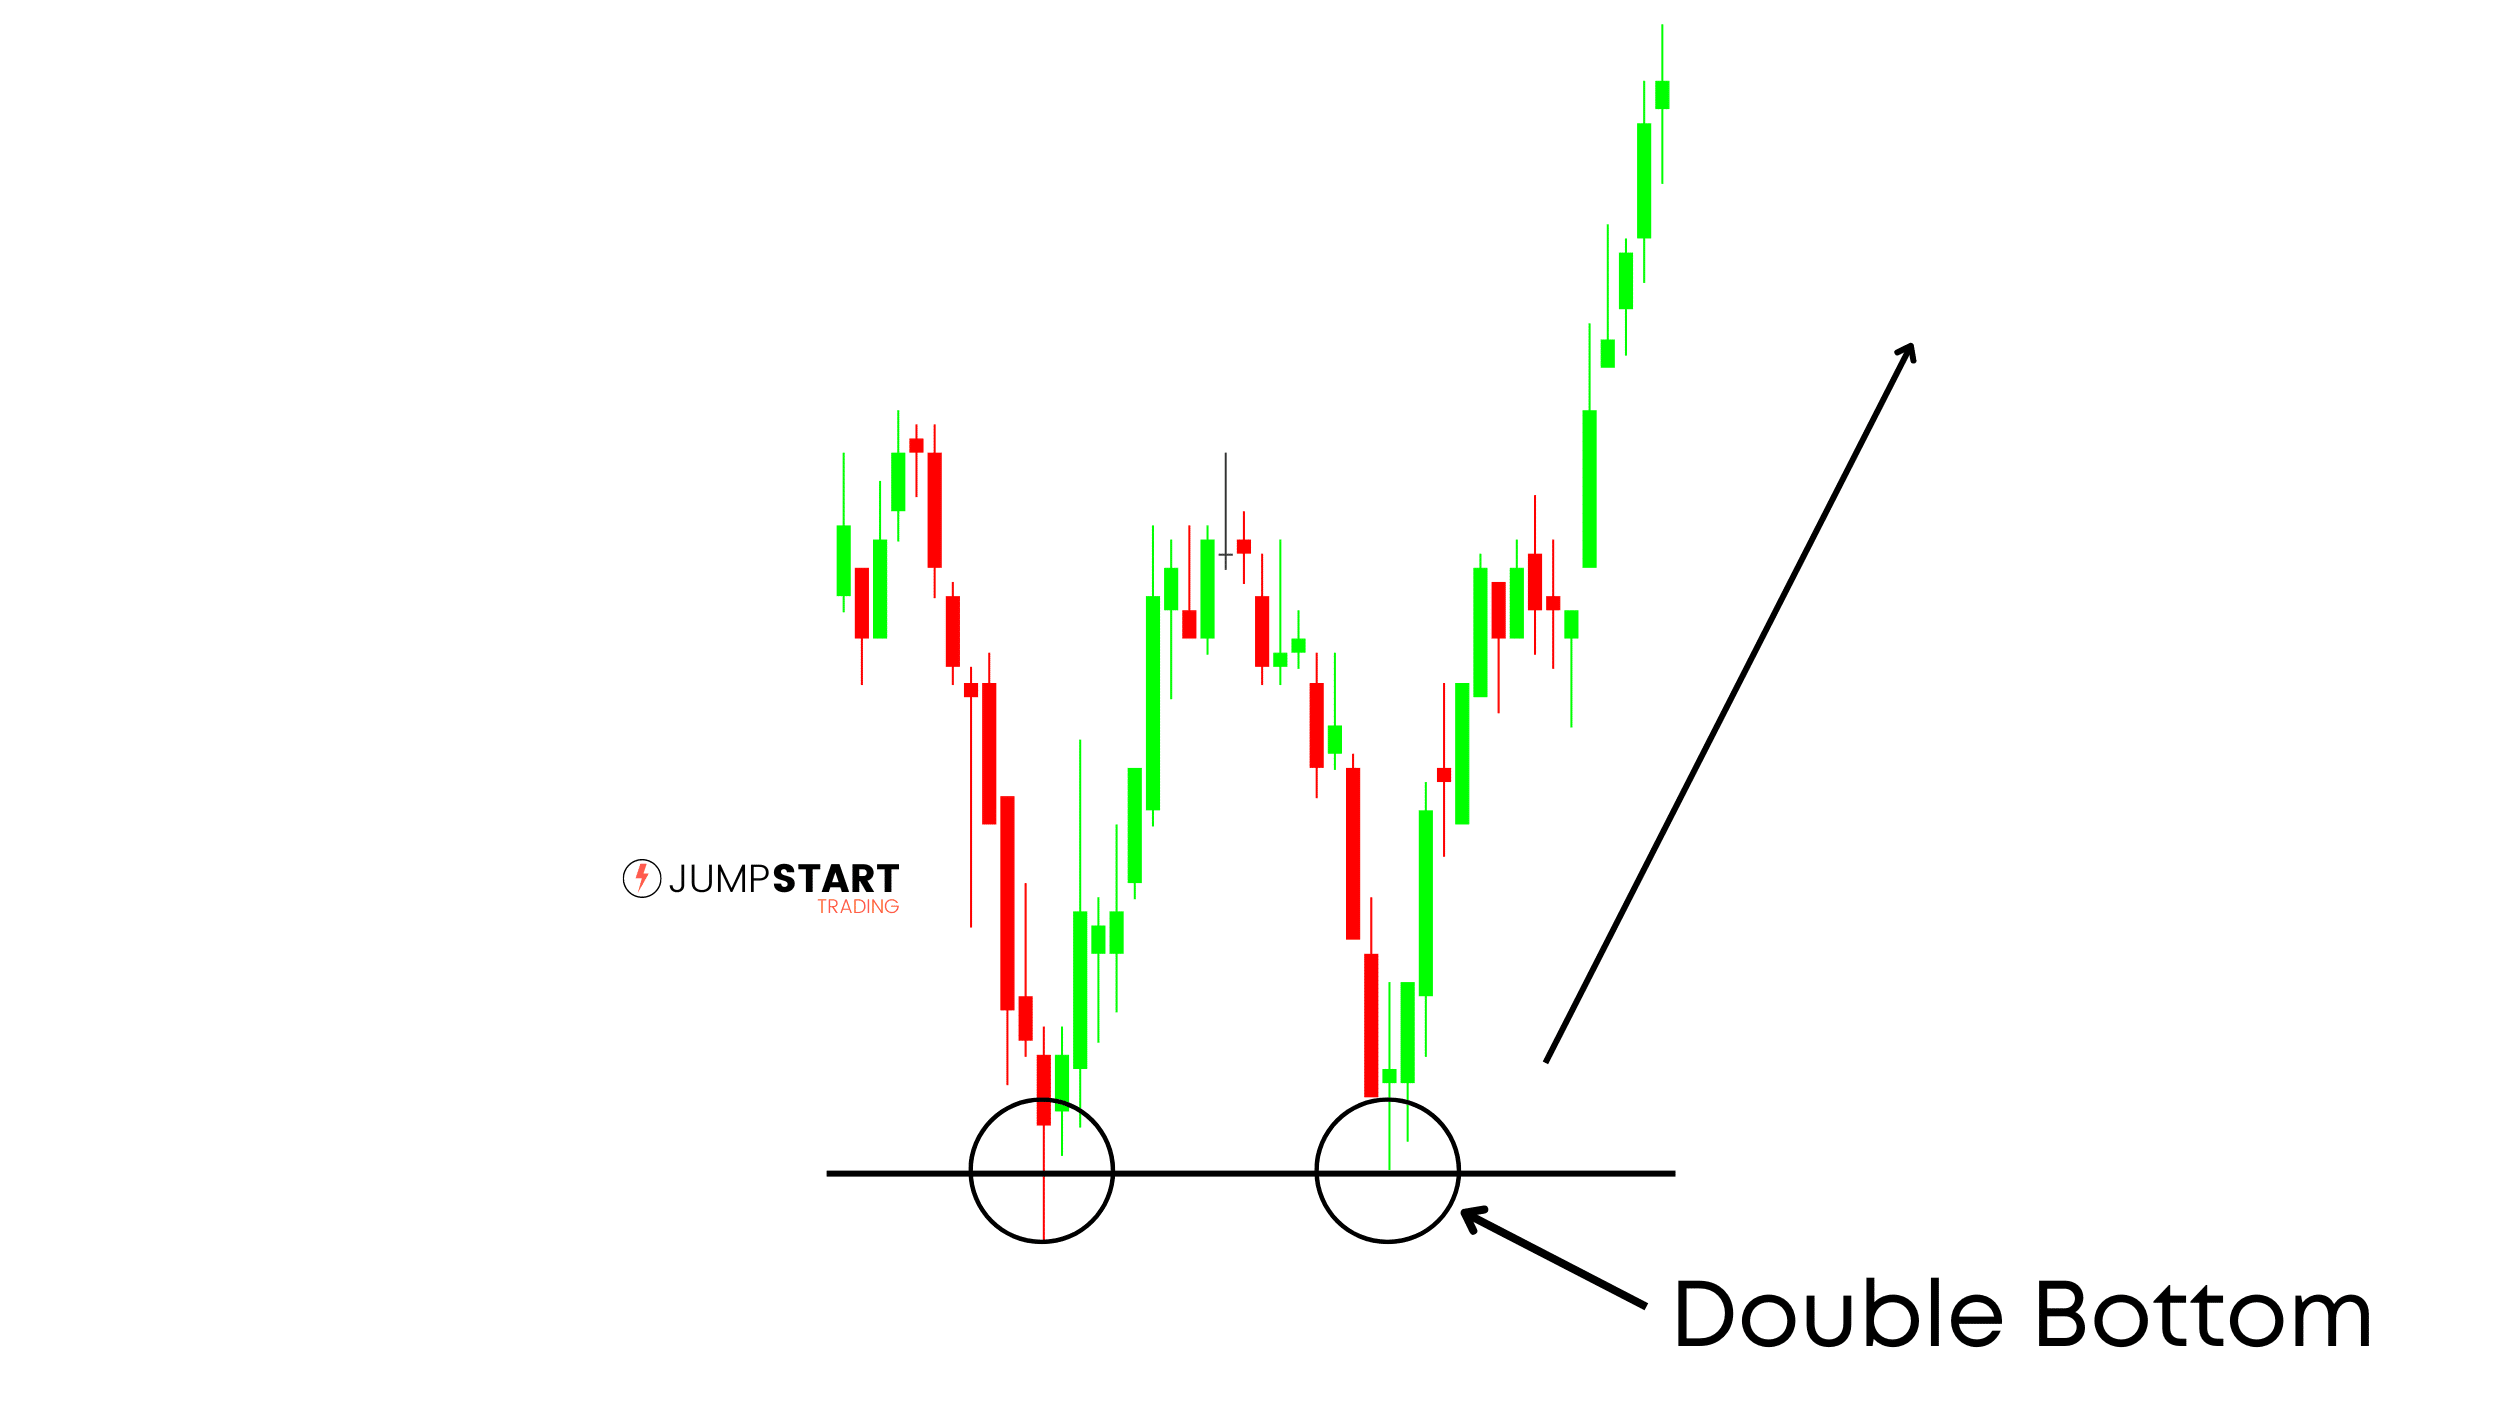
Double bottoms form after price is rejected for a second time at a support level, indicting a potential reversal in price.
This information is valuable for two reasons. First, it indicates a potential reversal. Second, it’s provides you with a logical spot to place your stop loss order, below the swing low.
Double Top
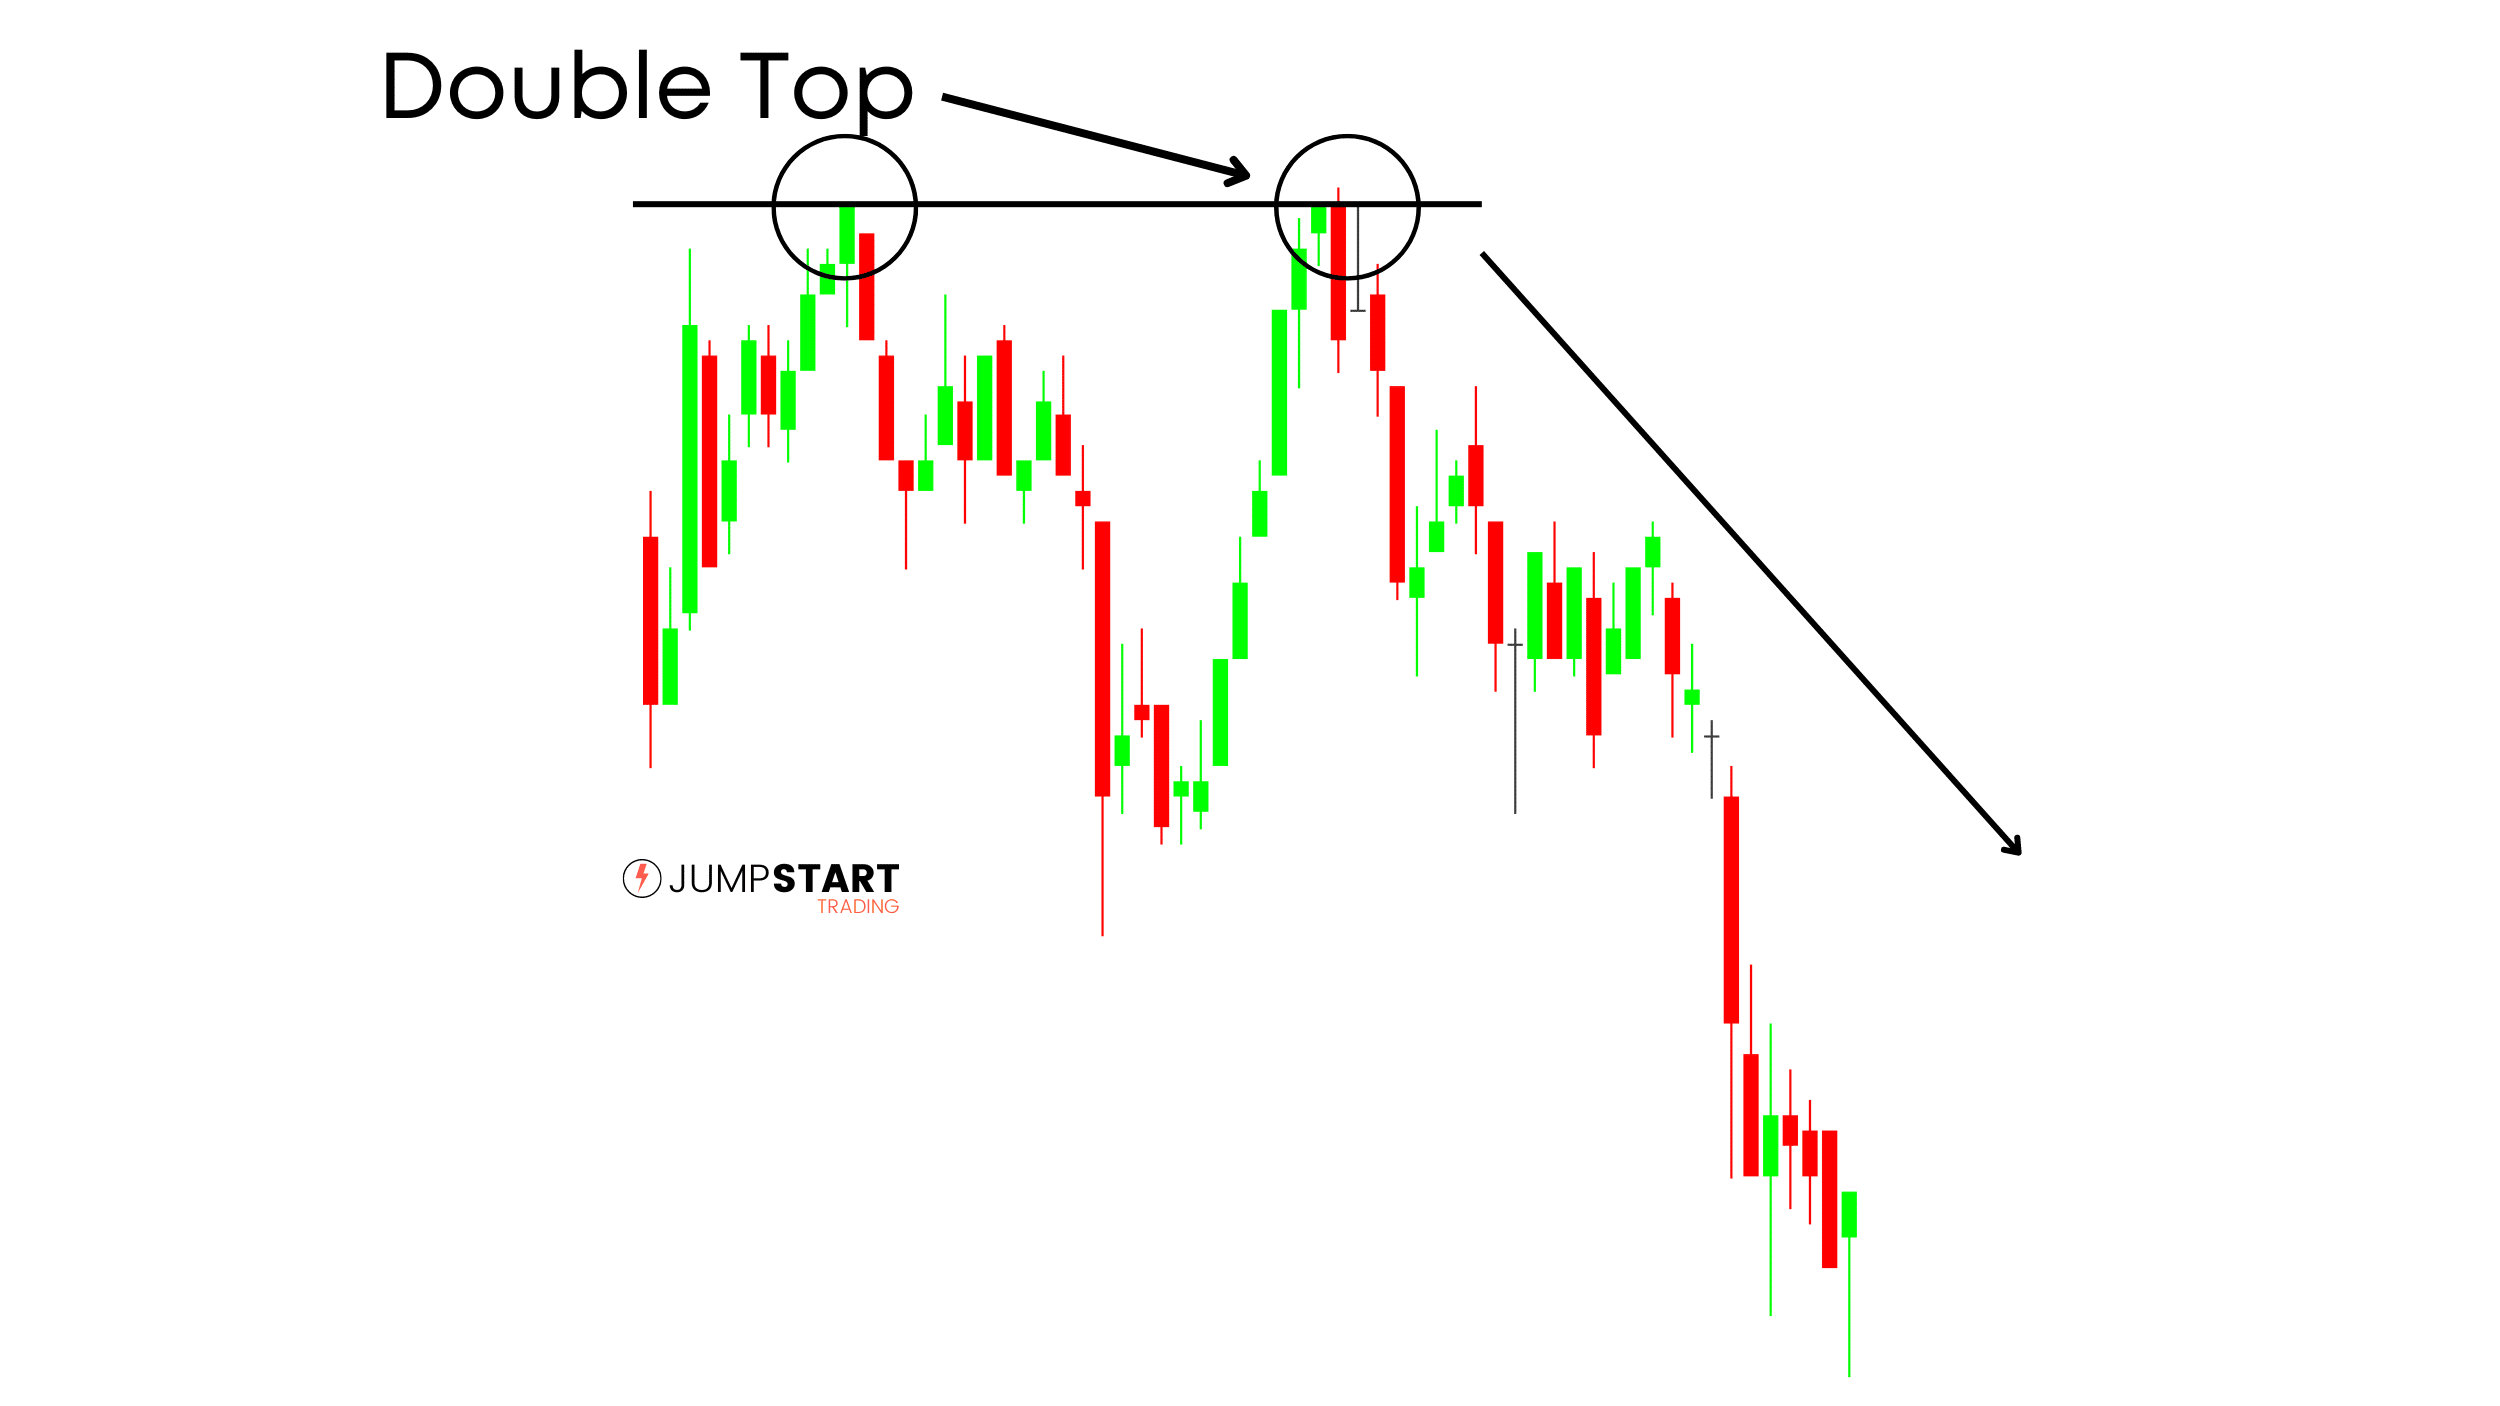
Double tops form after price is rejected for a second time at a resistance level, indicting a potential reversal in price.
You can also have triple or quadruple tops and bottoms, simply more confirmation of a support or resistance level.
2. Channels
Channels form in slower developing uptrends and downtrends. Recognizing when price is trading in a channel can be very useful to find setups with a high potential R.
Bullish Channel
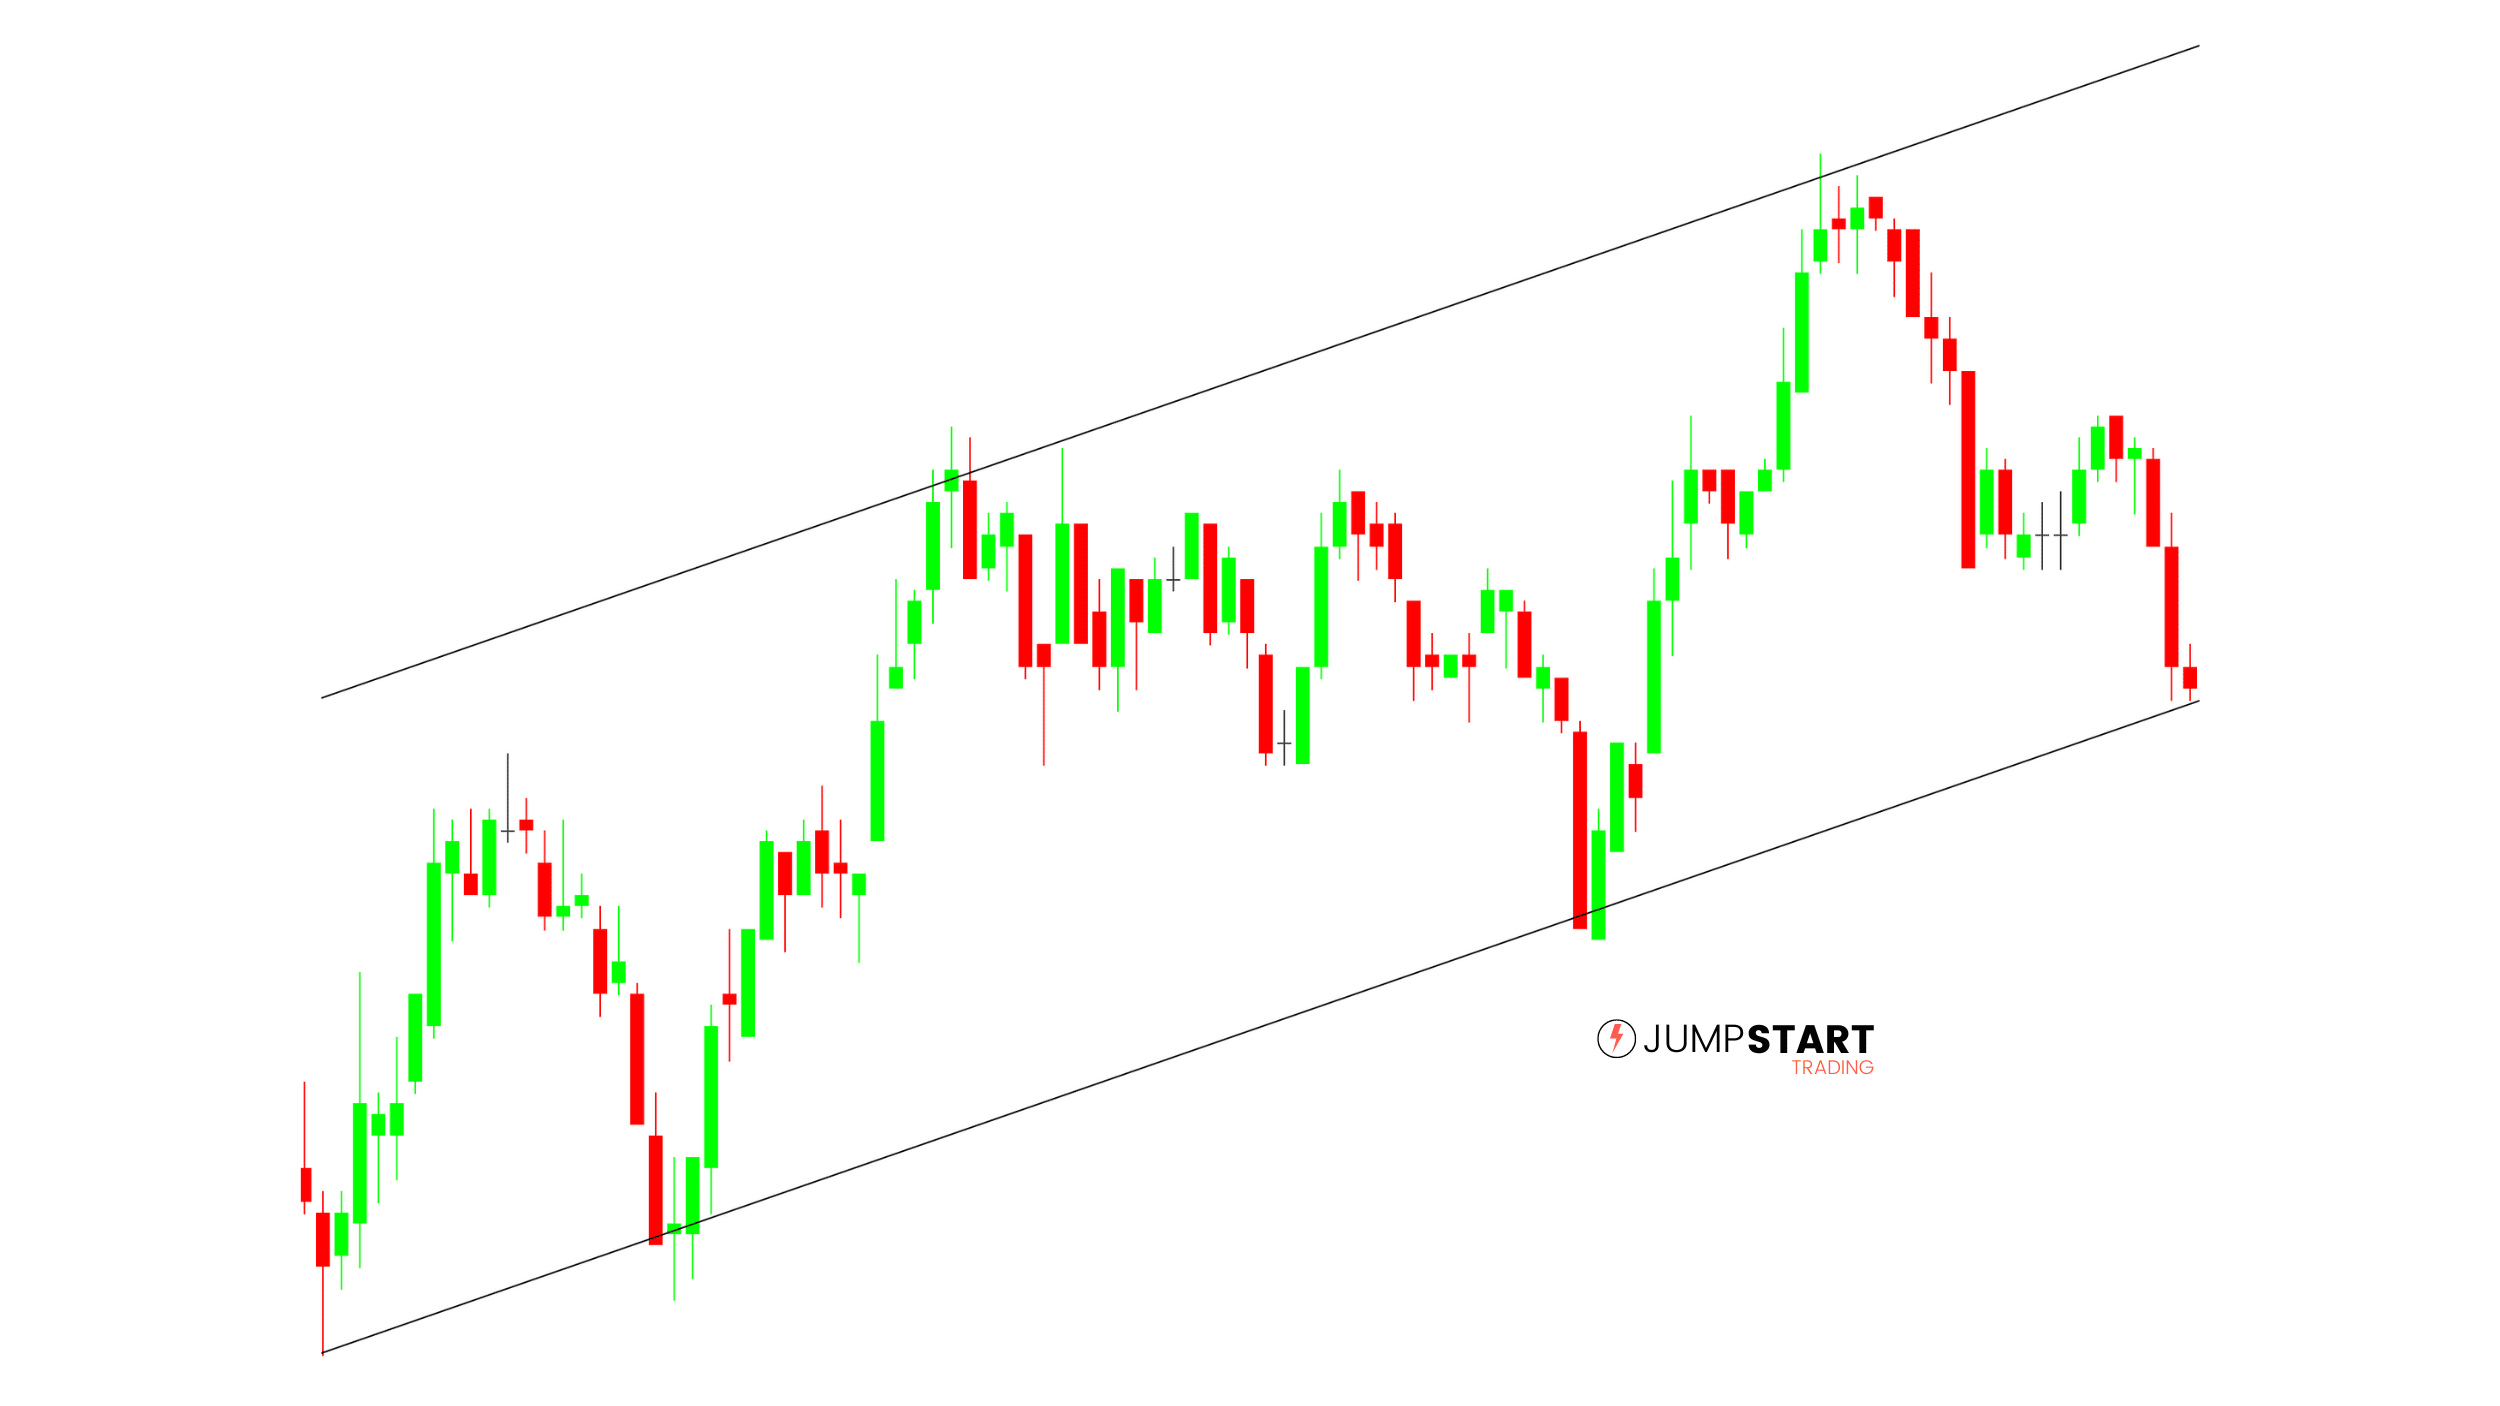
Bullish channels formed in uptrends. You can use a bullish channel to find opportunities to go long (green support trendline) with a well defined stop and take profit.
You simply place your stop loss behind the most recent swing low and set your take profit at the upper side of the channel (red line).
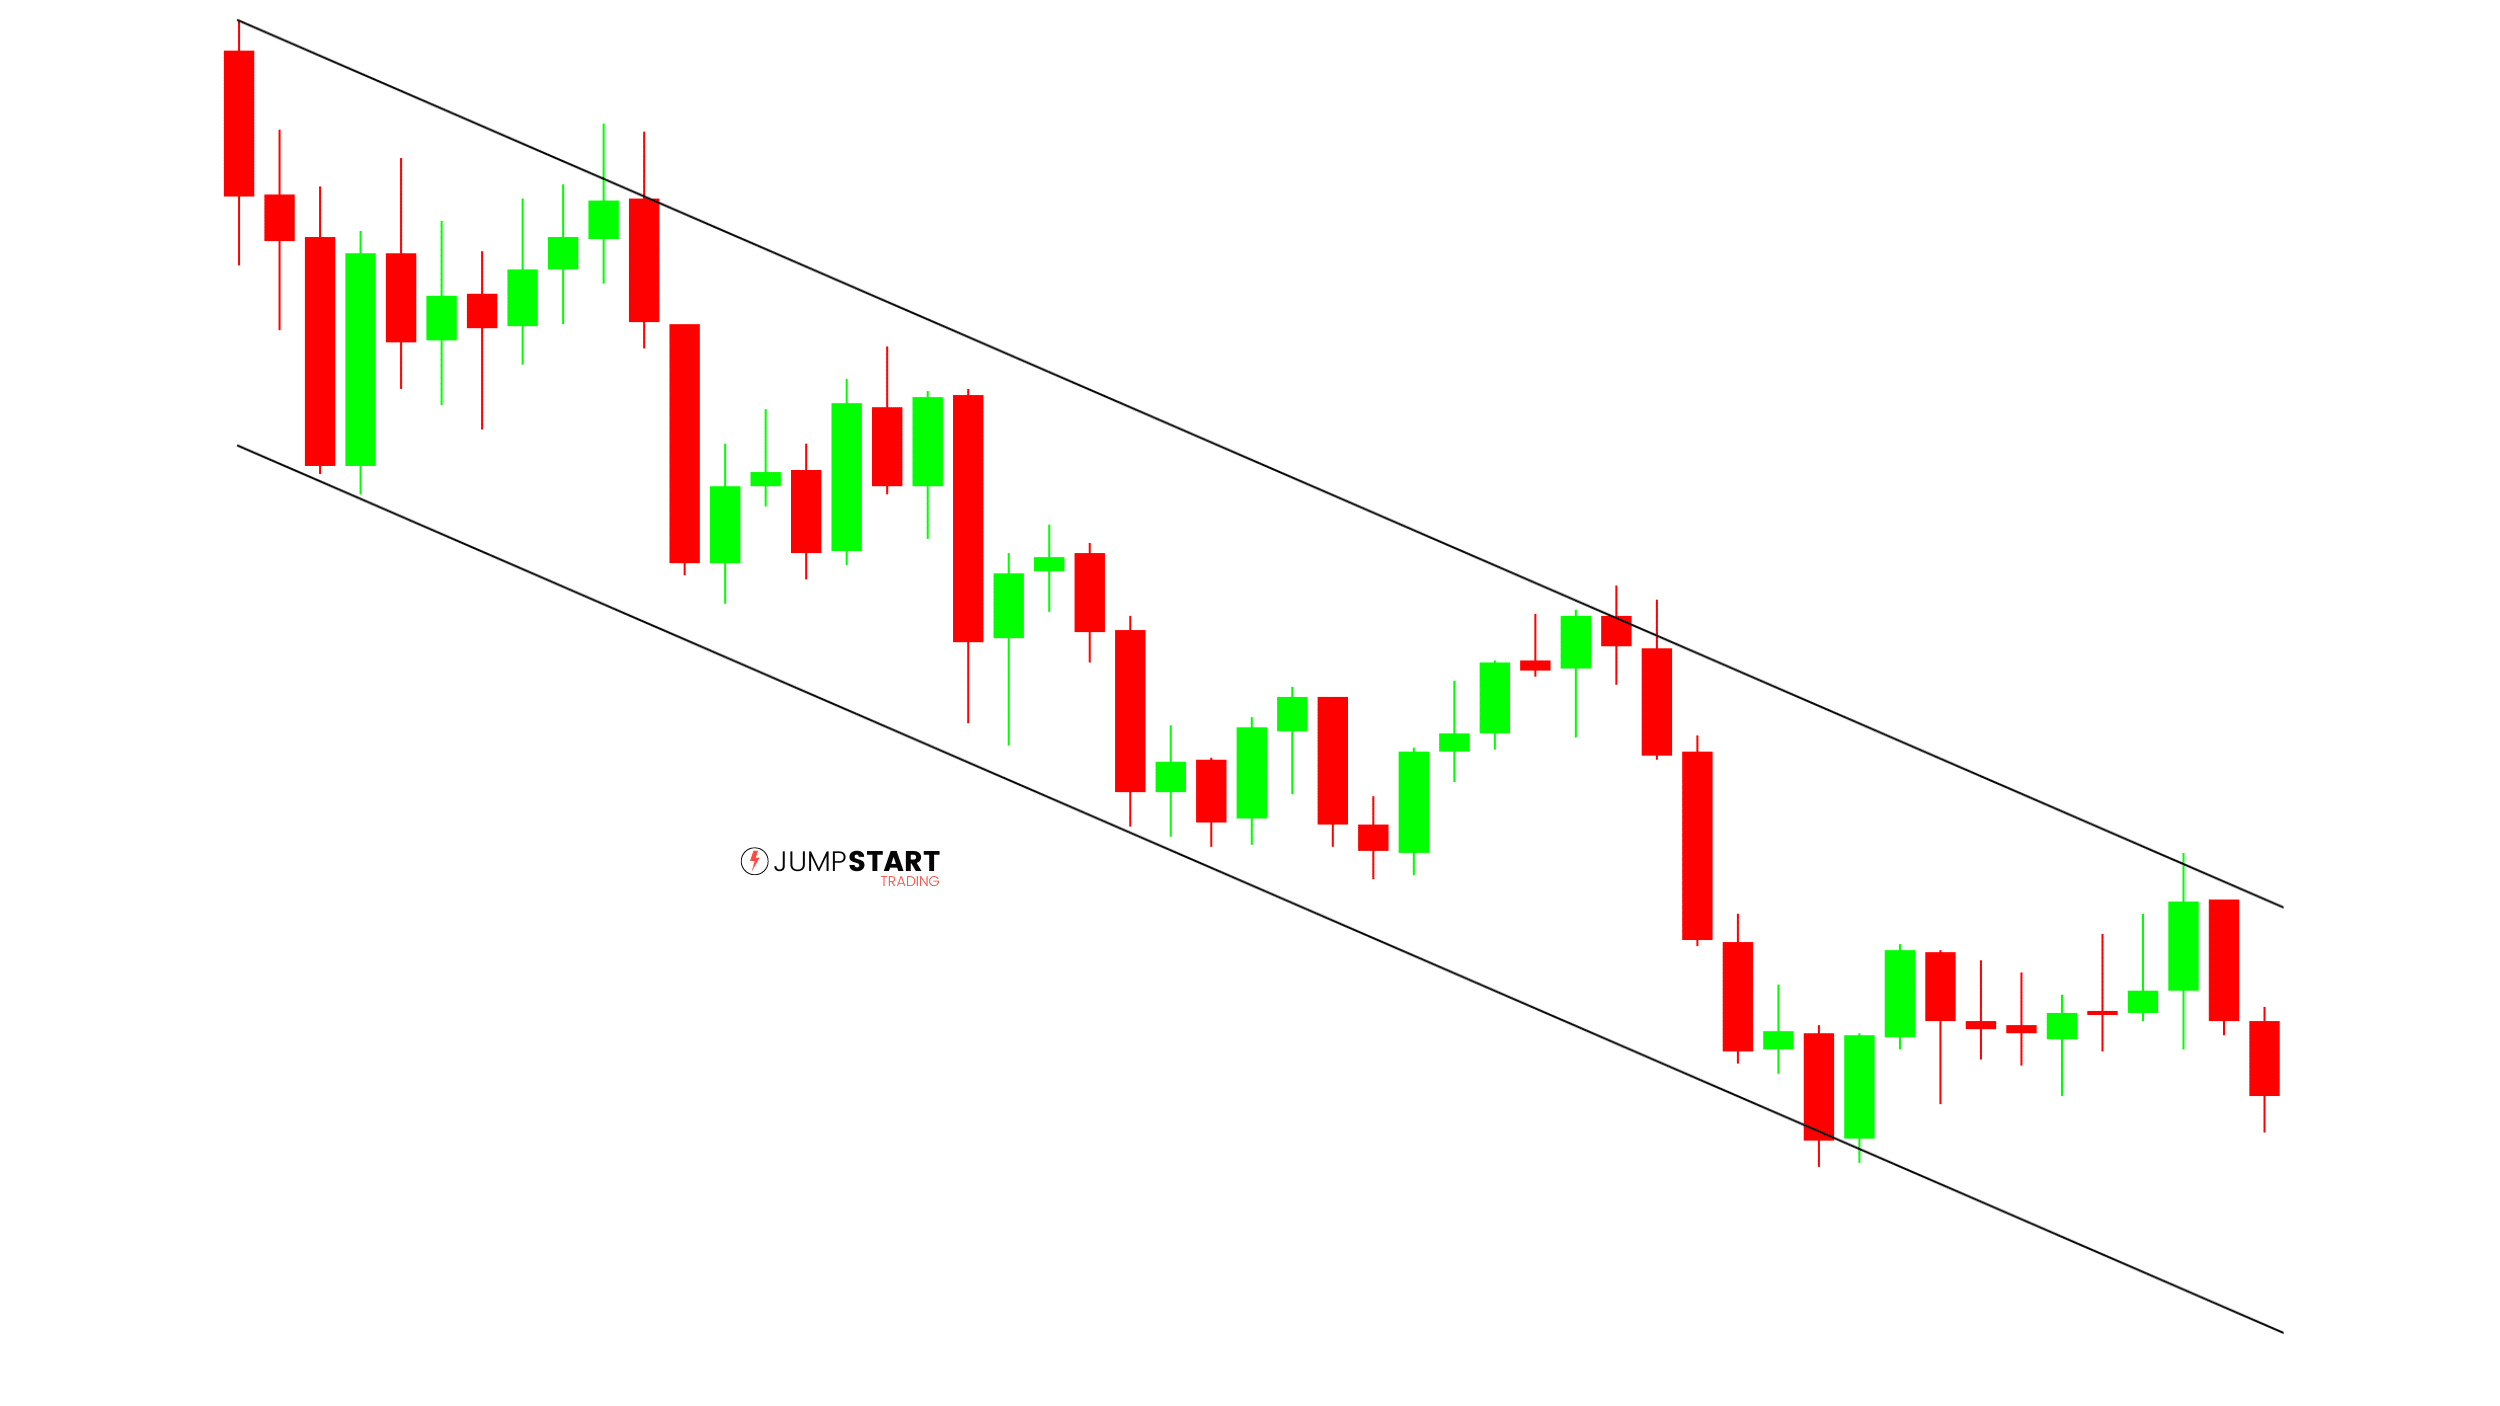
A bearish channel, seen below, is simply a channel that forms in a downtrend. You’d look to short at the upper portin of the channel and set your take profit at the bottom of the channel.
Bearish Channel
3. Head and Shoulders
Whoever came up with the name of this pattern deserves an award.
Head and shoulder patterns form at the end of trend, signaling a potential reversal.
They have four components: 2 Shoulders, a Head, and a Neckline.
Bullish Head & Shoulders

The four components are outlined in the bullish head and shoulders example above.
You would look to enter on the break of the neckline which is simply a trend line draw from the previous two highs.
A bullish head and shoulders pattern is nothing more than a price rejection on a retest of lows. So don’t over think it.
Bearish Head & Shoulders

Above we have a bearish head and shoulders example. Notice how the right shoulder is simply a failed retest of highs. Entry would be on a break below the trendline (neckline).
4. Cup & Handle
The Cup & Handle pattern was first defined by swing traders a long time ago.

Cup and Handle patterns are easy to recognize by their large “U” shaped retracement followed by a smaller retracement where price fails to break lows.
When trading a cup and handle you look to enter on the break out of the handle and place your stop below the bottom of the handle.
5. ABCD Patterns
The final structural patterns we will look at are ABCD patterns.
ABCD patterns were founded by Gartley and are considered harmonic patterns. They’re a great tool to help you manage your positions.
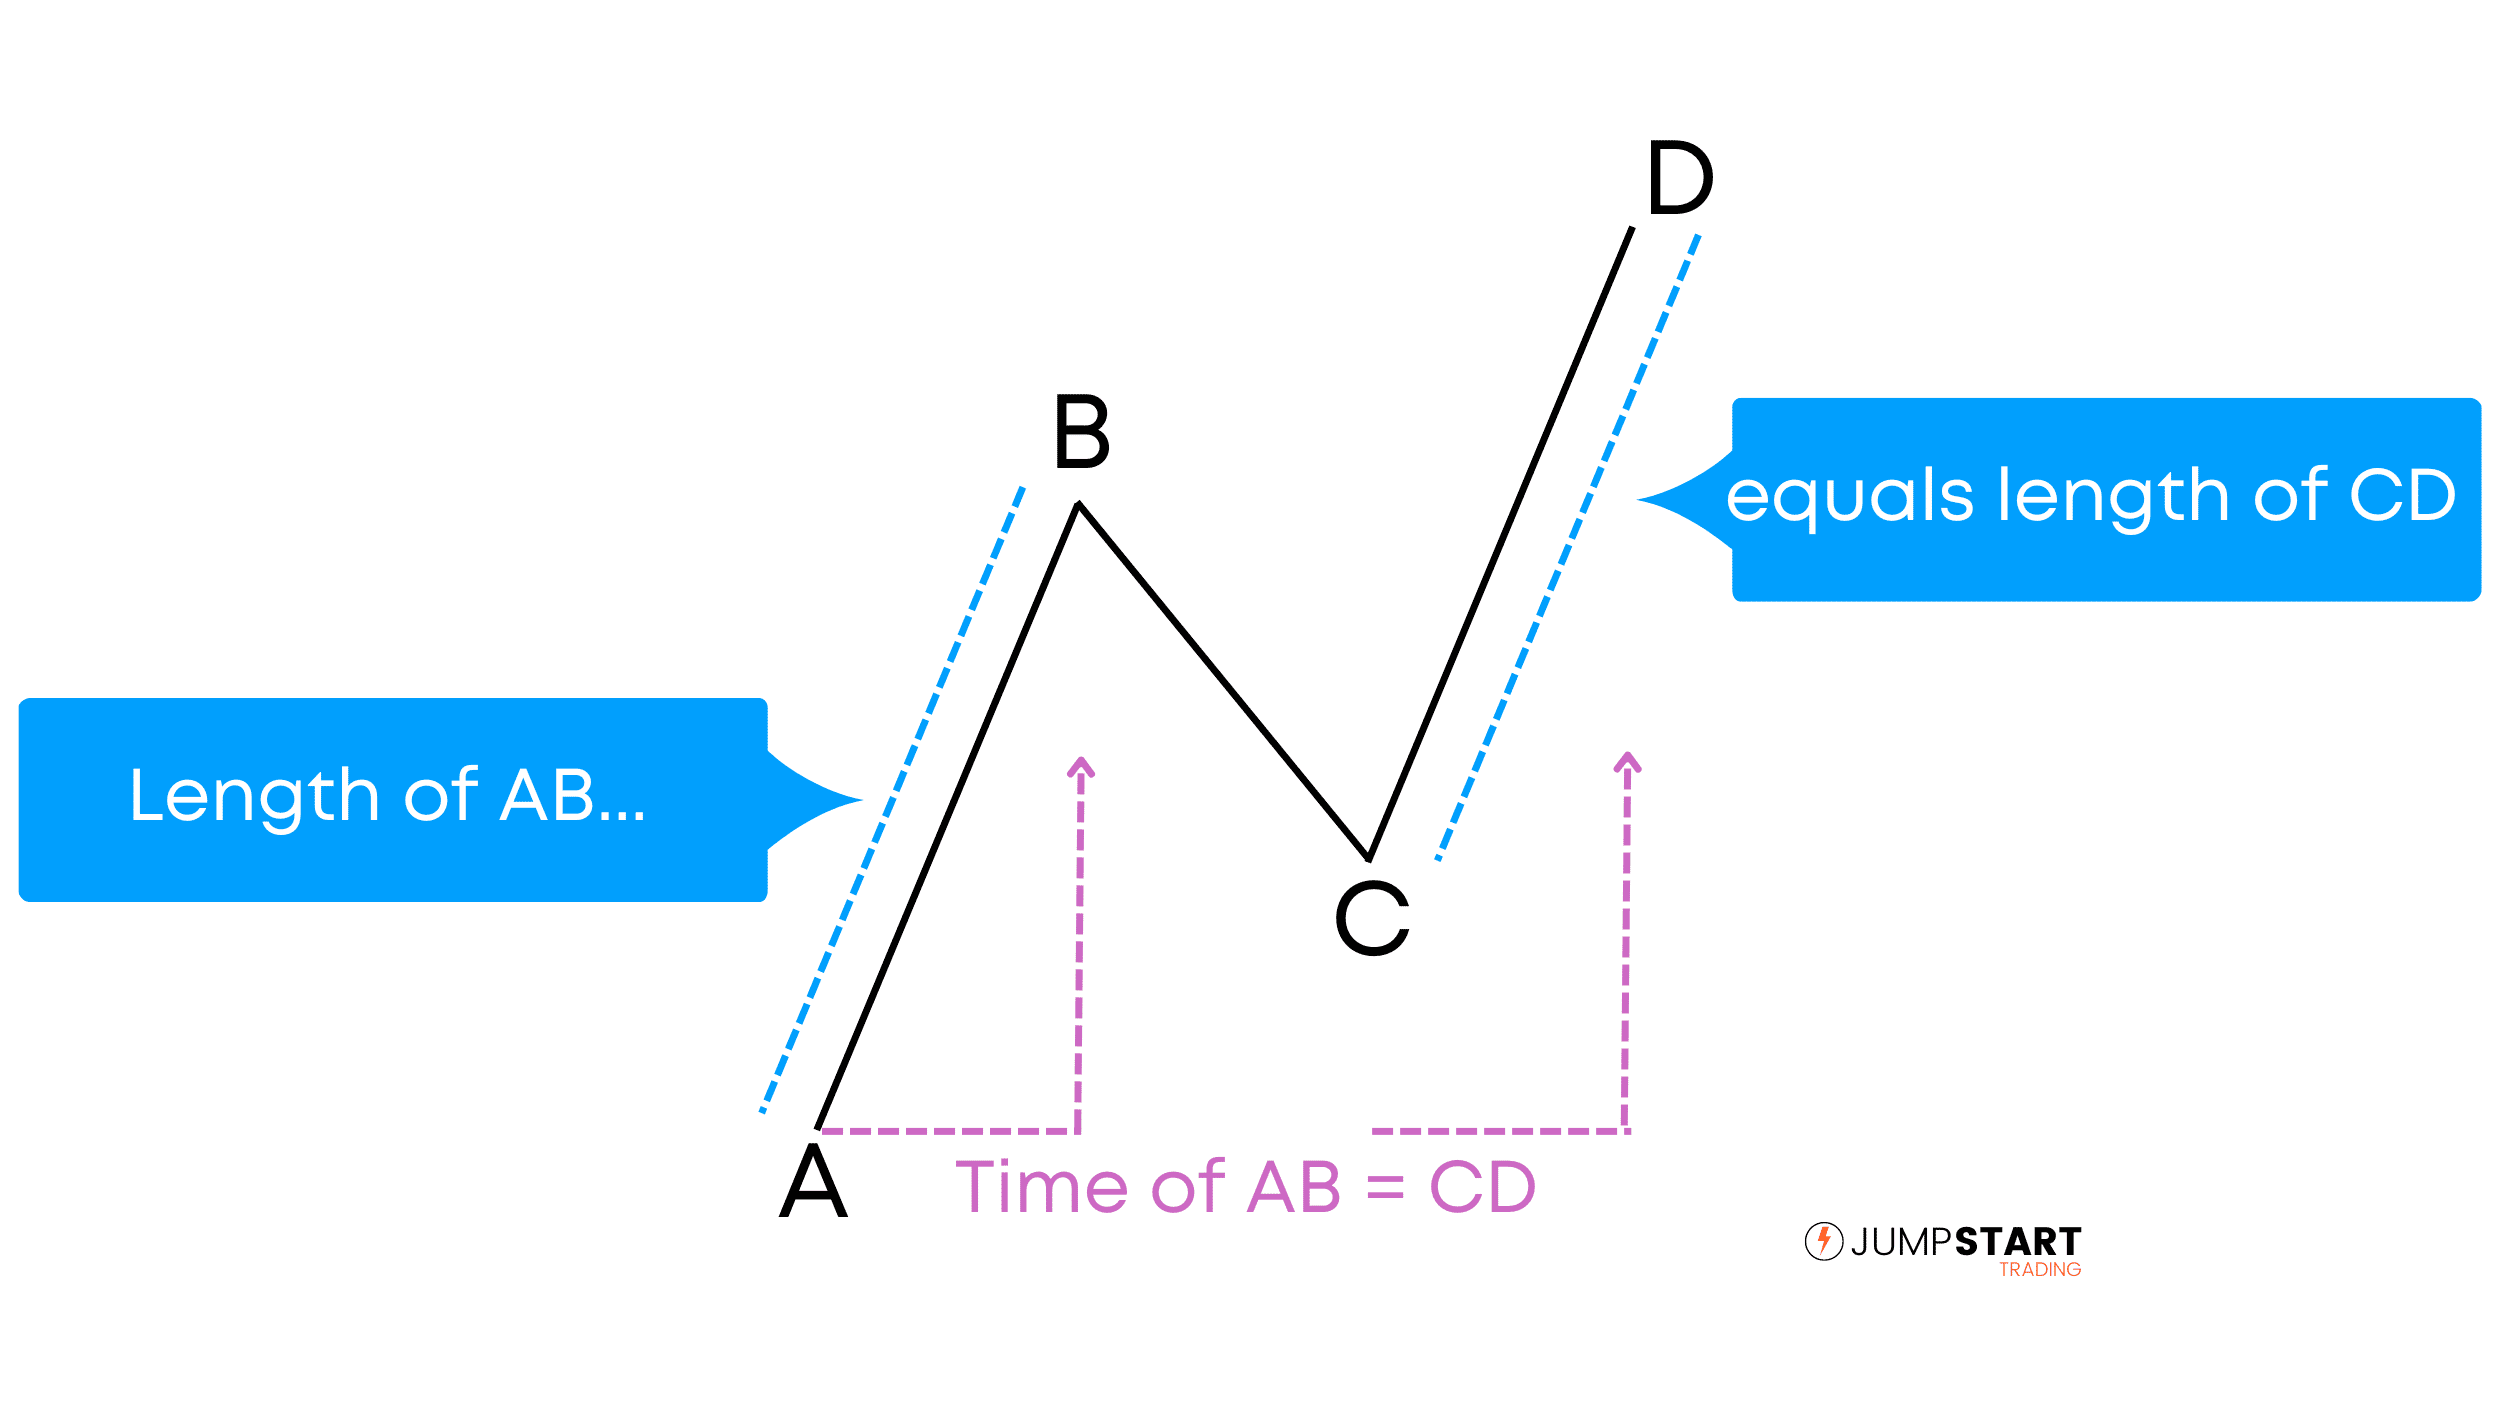
A traditional ABCD pattern will have an AB leg equal to the CD leg in terms of both price and time, as seen in the above example.
Again, this is a hypothetical example. The AB leg and CD legs don’t always take the exact amount of time to complete.
Let’s look at some examples.
Bullish ABCD Pattern

In the above bullish ABCD pattern, had you gone long near point C you would have targeted point D for your take profit.
Bearish ABCD Pattern
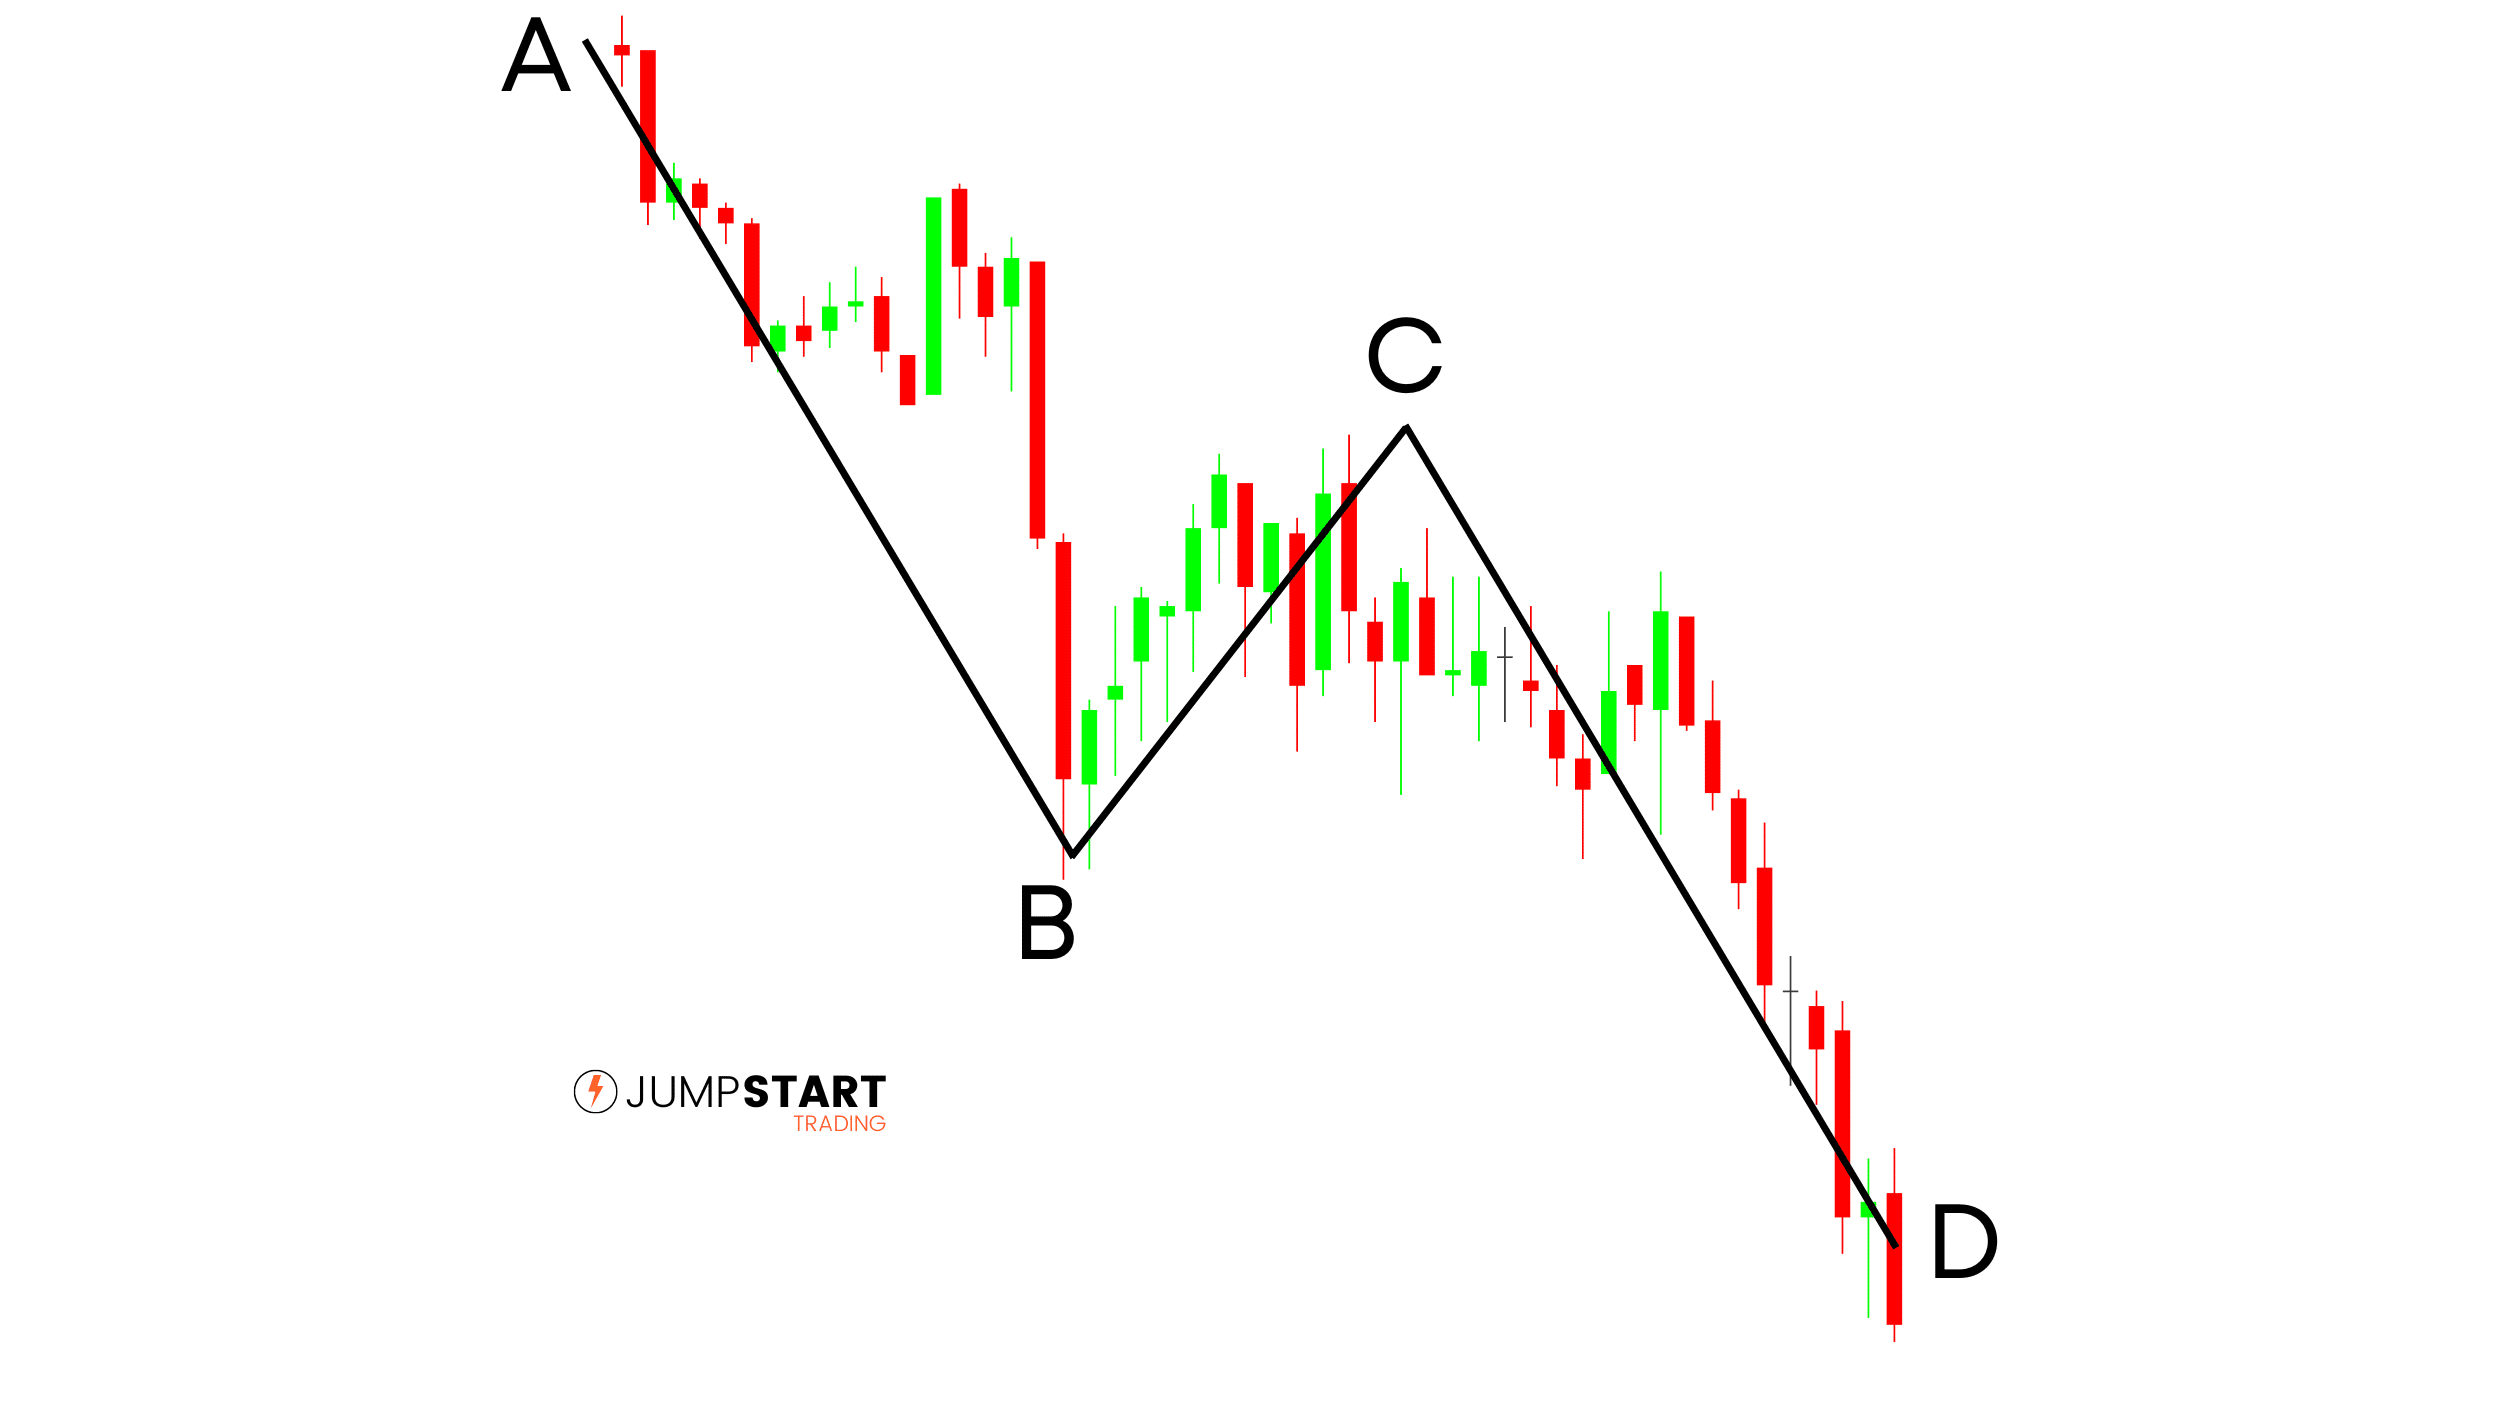
Similar to the bullish ABCD pattern, had you gone short at point C you would have targeted point D for your take profit.
To draw ABCD patterns on your charts, most platforms will have a Fibonacci Extension tool.
Finally, let’s take a look at a few of my favorite candlestick patterns.
Candlestick Trading Patterns
Candlestick charts can trace their roots all the way back to the 18th century and Japanese rice traders.
The following patterns are very simple, yet can be extremely powerful when the proper context is applied.
1. Pin Bars

A pin bar is a single candlestick with a long tail (wick) who’s price action demonstrates a rejection of a price level and reversal in price closing near its high (bullish pin bar) or low (bearish pin bar) for a user defined session.
They’re great reversal patterns to include in your playbook. If you have interest in learning more about pin bars, I’ve written entire guide you can read here.
2. Inverted Pin Bars
Inverted pin bars are single candlestick reversal patterns that typically have the potential for a high R due to their tight stop loss.
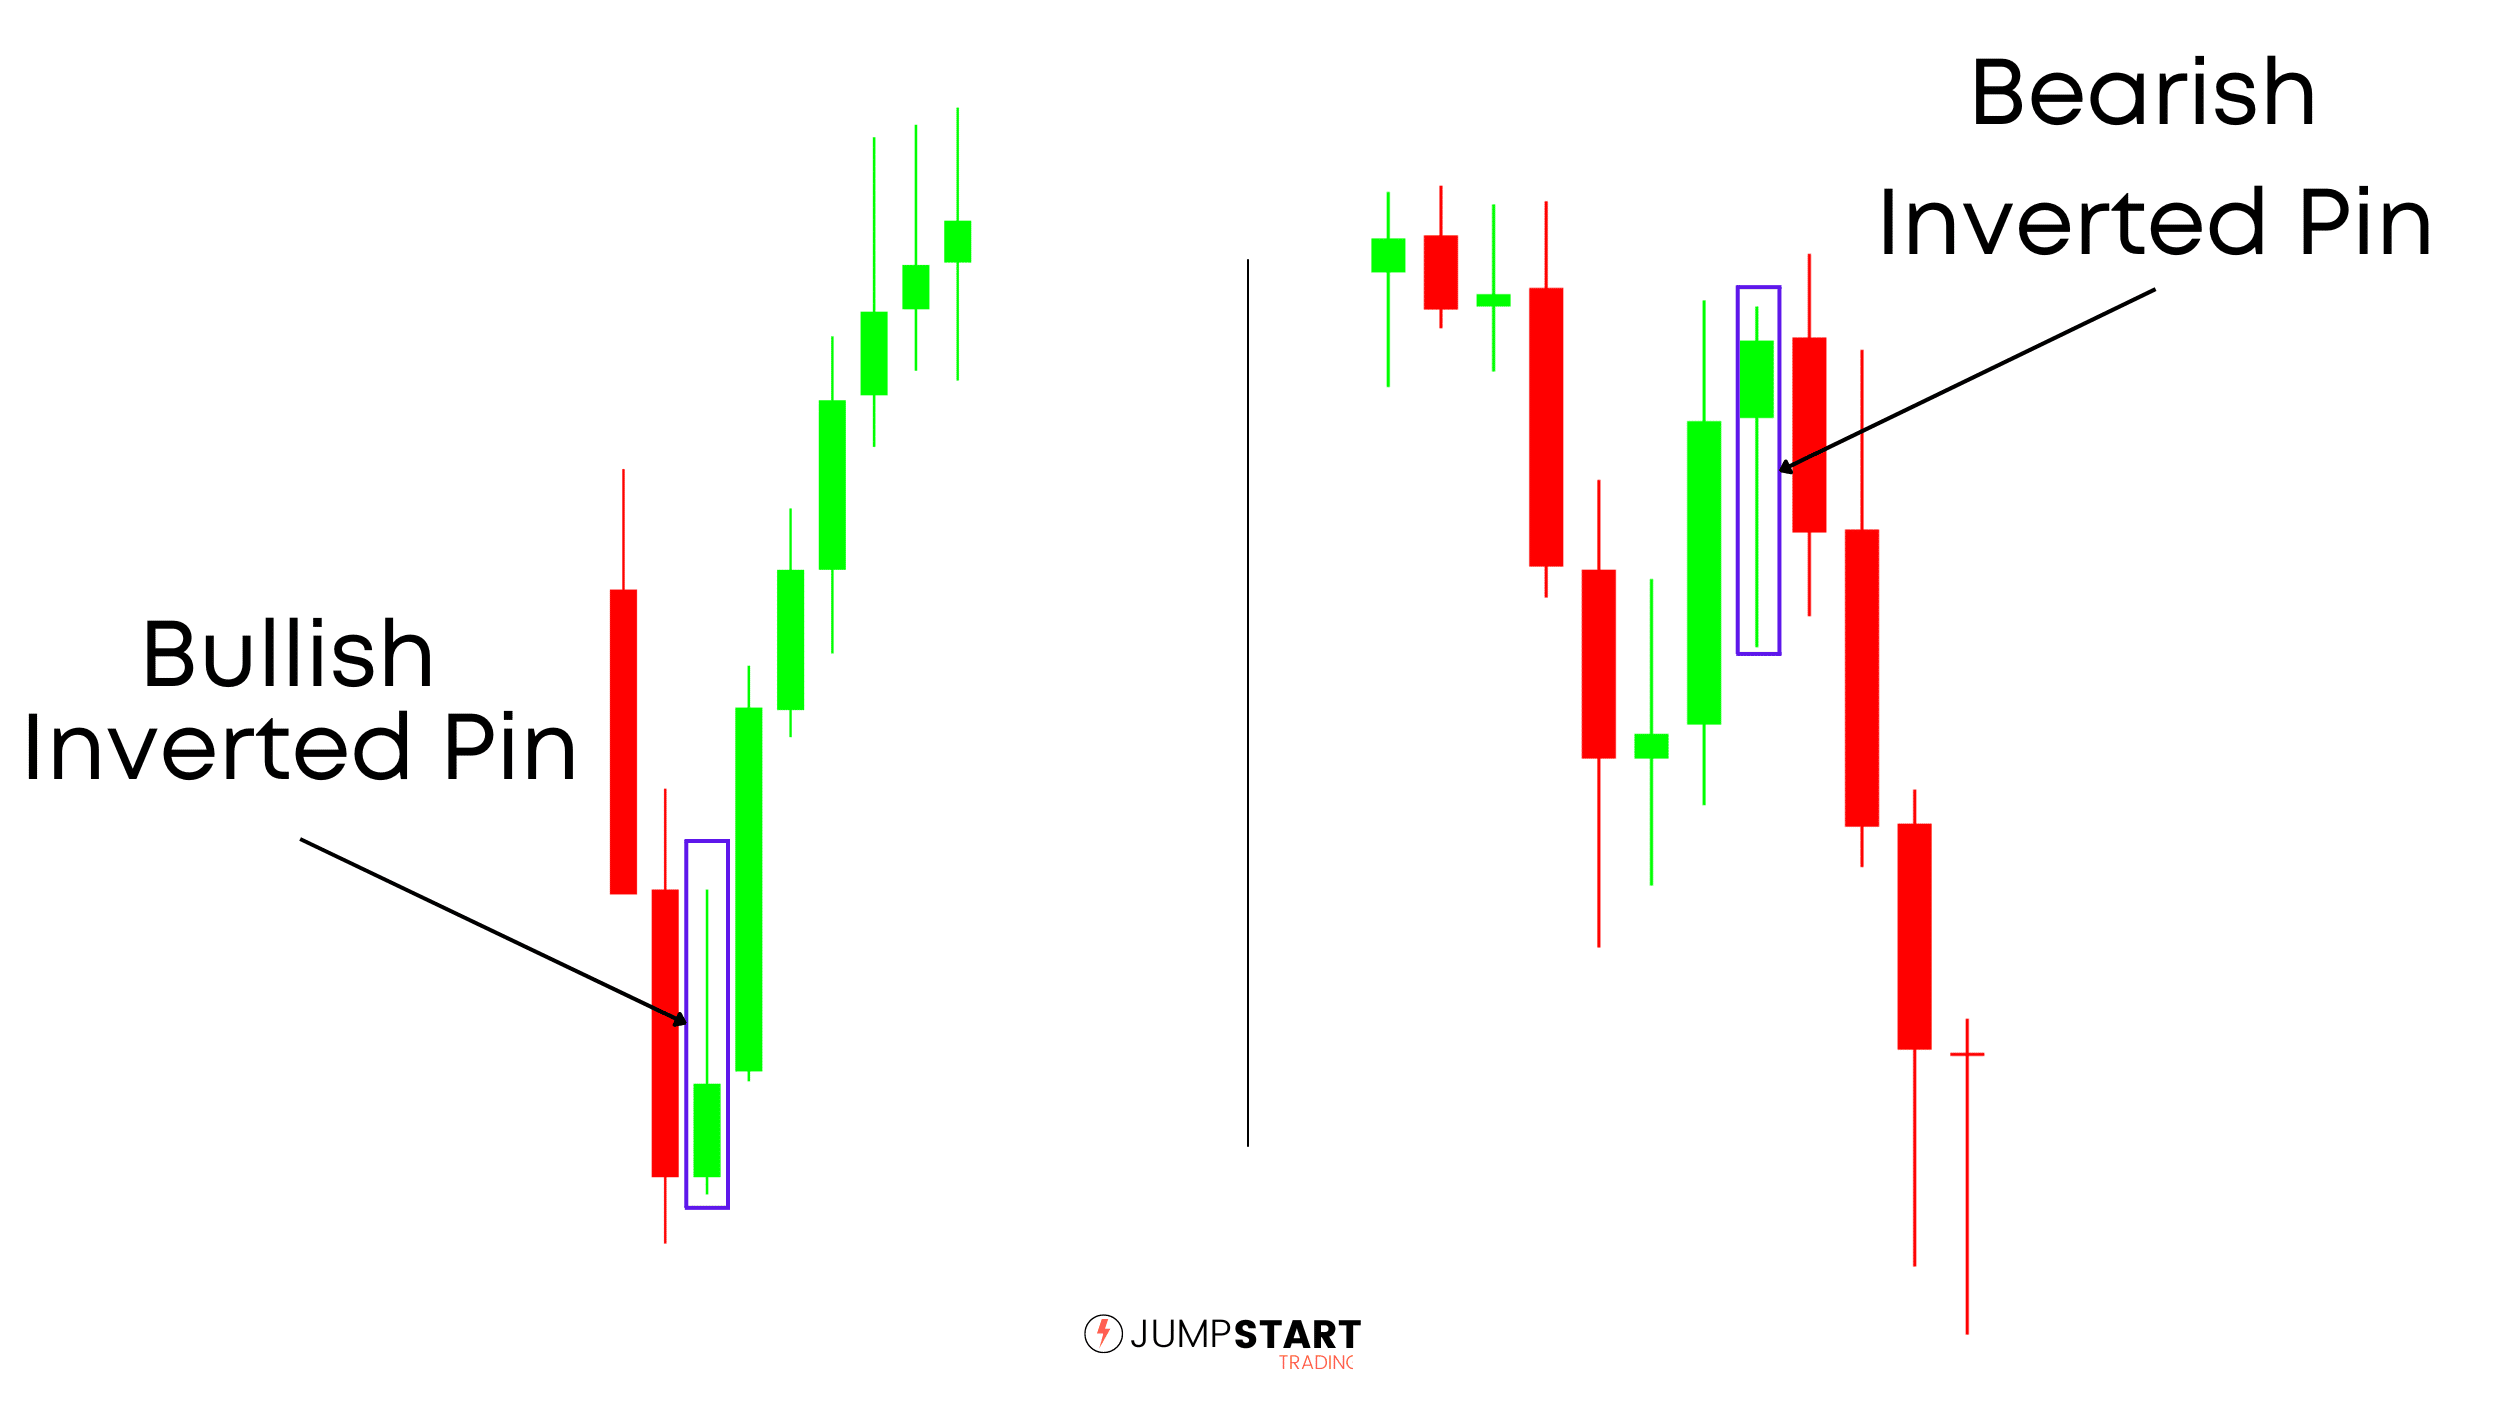
Bullish inverted pin bars form in a downtrend as seen on the left in the example above.
Buyers dominated the start of the session until sellers became the aggressor again driving price back near lows. However, sellers fail to close the session out at new lows, signaling a potential reversal coming.
Inverted Pins create high R opportunities as they allow you to have a really tight stop right below the swing.
Practice spotting them on your charts and you will see how powerful they can be.
You can use IP’s either as a trigger or as context off a longer interval.
3. Wicks
Wicks are another great pattern where you can find high R setups.
A large wick on a candlestick illustrates a fast rejection of price level, signaling capitulation and a potential reversal.
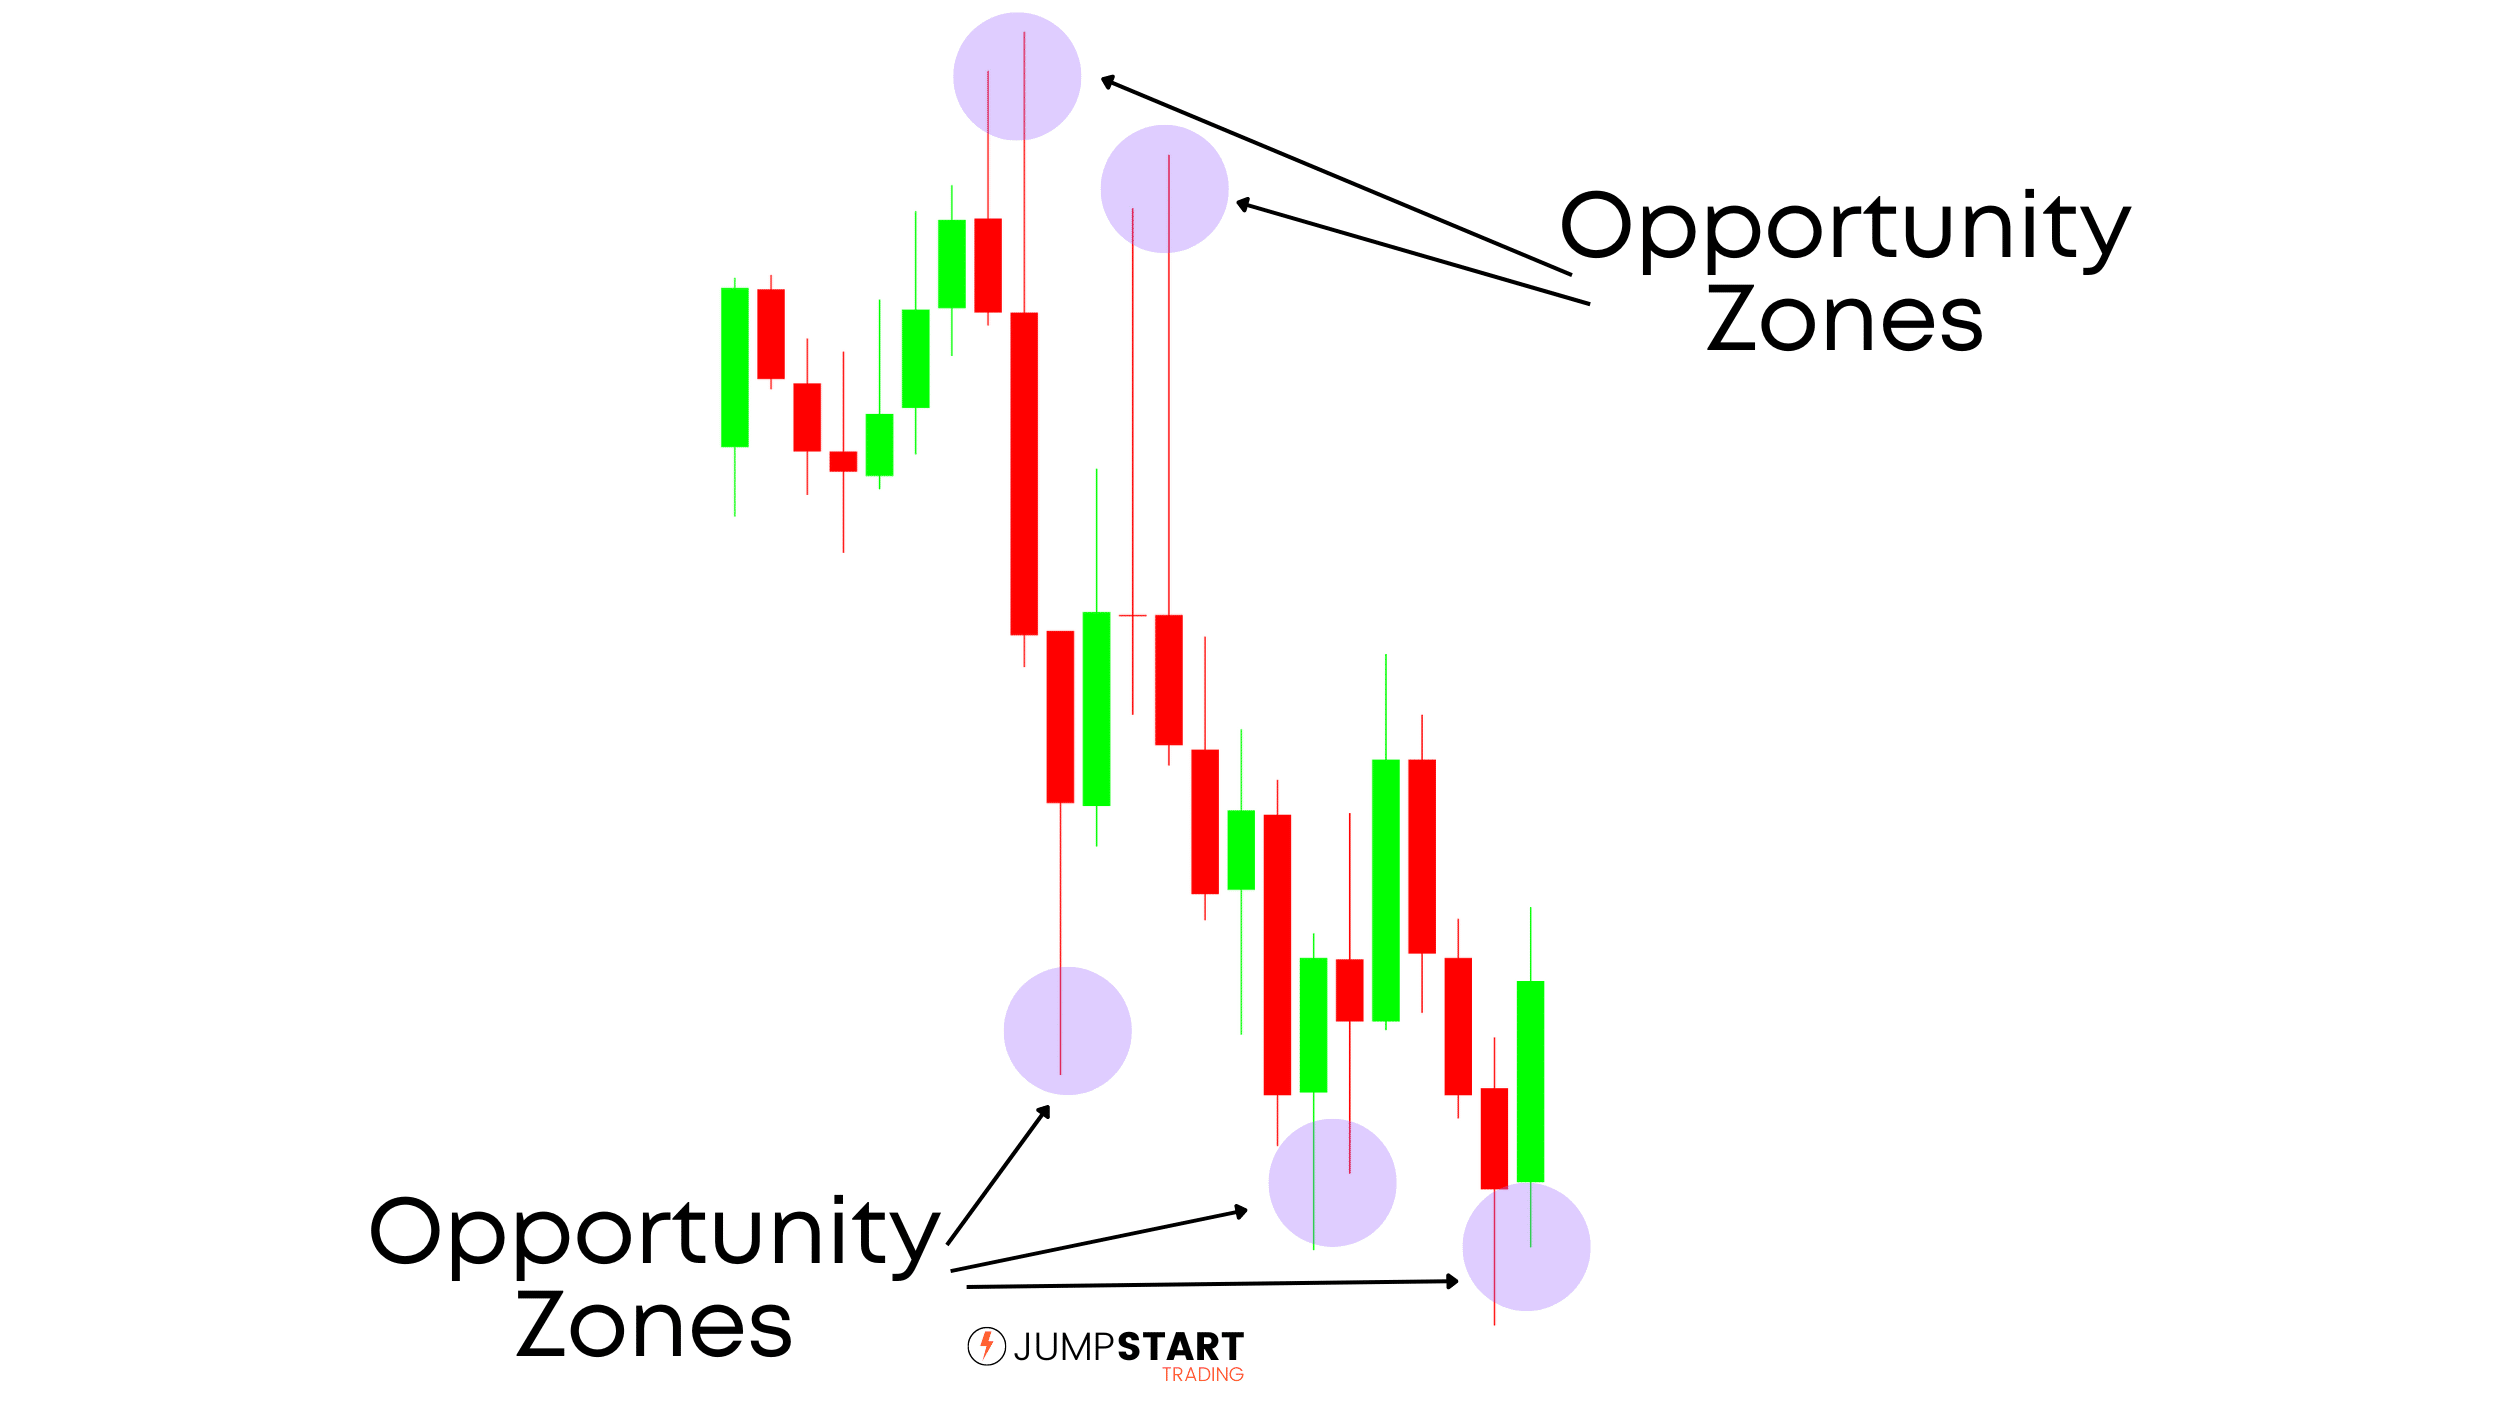
Personally I use wicks on a longer interval context chart to find potential areas to get long or short (opportunity zones). Let’s look at an example.

On the right is a 15 minute chart of the e-Mini Nasdaq 100, and on the left a 1 minute chart.
The 1 minute chart is our trigger chart where we will look for an entry. The 15 minute chart we will use to build context and find a logical place to take an entry.
After the wick formed on the 15 minute chart, we define the extreme price zone of the wick as an opportunity zone. Why? Well we will assume that if price retraces back to the extreme of the wick that formed, that buyers will once again be the aggressor at those price levels.
We wait for a price retracement look for a setup. In this example an inverted pin bar forms which could have been you’re trigger to go long.
How to Use Trading Patterns
It’s very important you don’t run just run off now and start trading the patterns you just learned on a live account.
Far too often I see new traders attempting to trade strategies with loose definitions and missing some of the key components that every trading strategy MUST HAVE.
Loose definitions lead to strategies that aren’t repeatable, and red trading accounts.
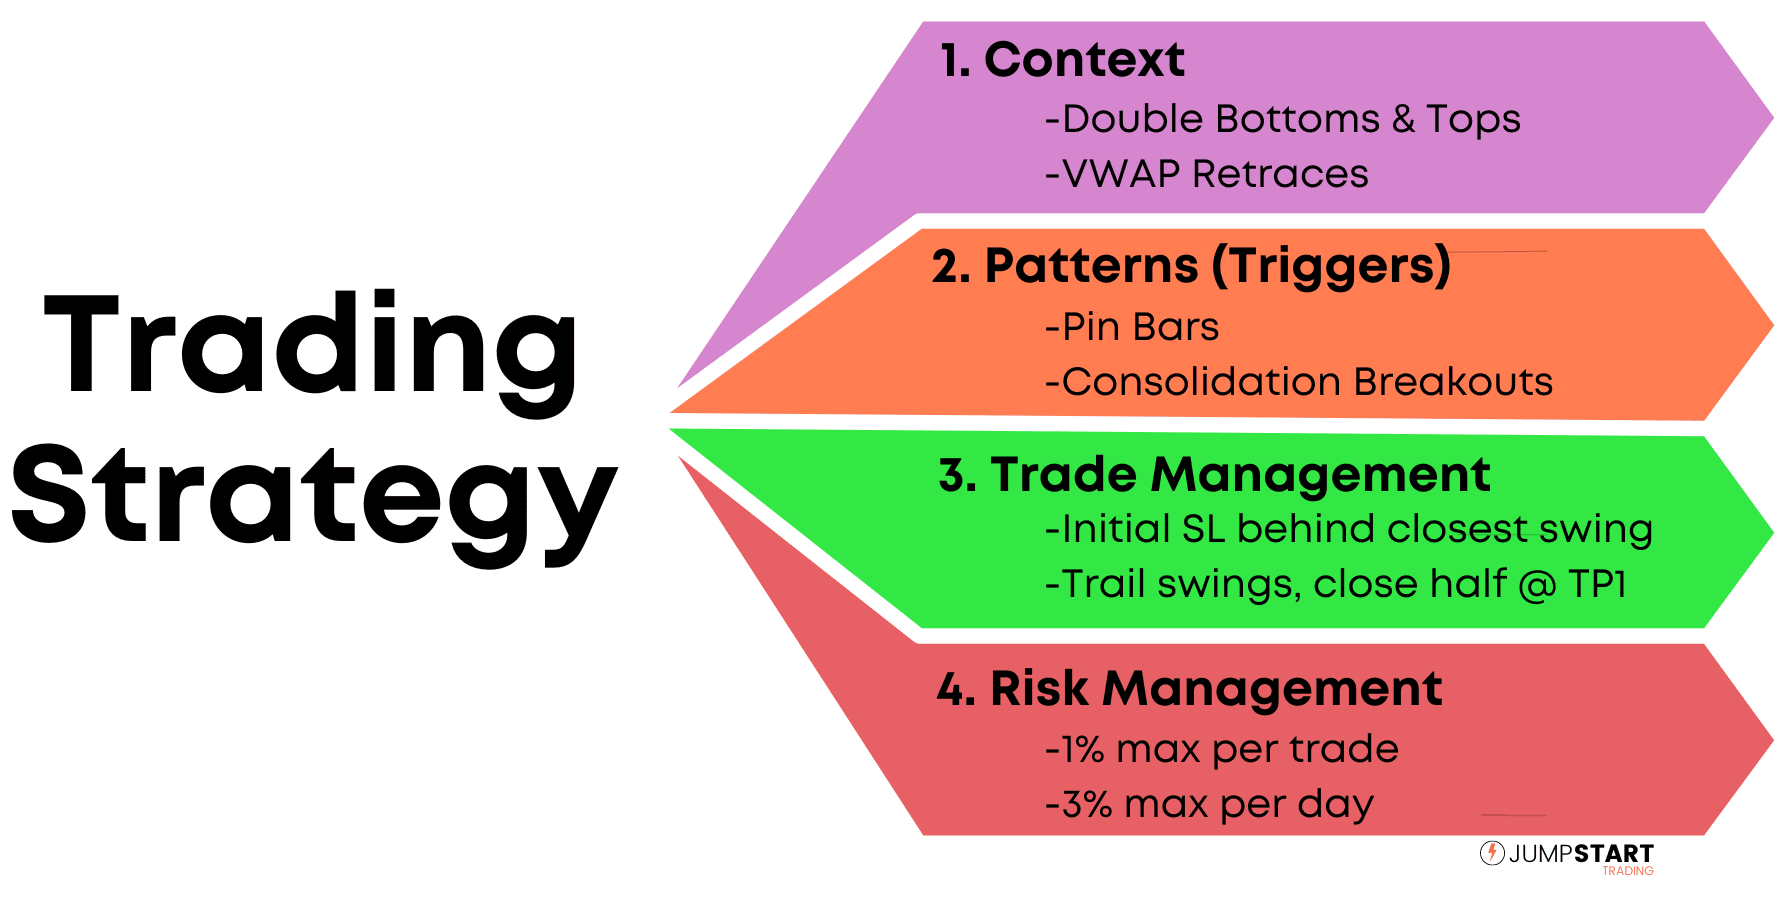
A Trading Strategy is made up of four primary components: Context, Patterns (Triggers), Trade Management, & Risk Management.
If you’ve never built a trading strategy, your next step should be reading our guide on trading strategies and developing a playbook.
Final Thoughts
It’s not necessary to learn all the different trading patterns that exist to become a successful trader.
Start by focusing on the two or three patterns that make the most logical sense to you.
Build a strategy around those patterns and focus on perfecting your execution. Then you can begin expanding your Playbook.
Have any specific patterns not mentioned in this guide that you like to trade? Leave a comment below!
SHARE THIS:
#kt-layout-id_2ab6b4-7d > .kt-row-column-wrap{align-content:start;}:where(#kt-layout-id_2ab6b4-7d > .kt-row-column-wrap) > .wp-block-kadence-column{justify-content:start;}#kt-layout-id_2ab6b4-7d > .kt-row-column-wrap{column-gap:var(–global-kb-gap-md, 2rem);row-gap:var(–global-kb-gap-md, 2rem);padding-top:25px;padding-bottom:25px;padding-top:var(–global-kb-spacing-sm, 1.5rem);padding-bottom:var(–global-kb-spacing-sm, 1.5rem);grid-template-columns:minmax(0, 15%) minmax(0, 85%);}#kt-layout-id_2ab6b4-7d > .kt-row-layout-overlay{opacity:0.30;}@media all and (max-width: 1024px){#kt-layout-id_2ab6b4-7d > .kt-row-column-wrap{grid-template-columns:repeat(2, minmax(0, 1fr));}}@media all and (max-width: 767px){#kt-layout-id_2ab6b4-7d > .kt-row-column-wrap{grid-template-columns:minmax(0, 1fr);}}

.kadence-column_57e7e9-93 > .kt-inside-inner-col{border-top-width:0px;border-right-width:0px;border-bottom-width:0px;border-left-width:0px;}.kadence-column_57e7e9-93 > .kt-inside-inner-col,.kadence-column_57e7e9-93 > .kt-inside-inner-col:before{border-top-left-radius:0px;border-top-right-radius:0px;border-bottom-right-radius:0px;border-bottom-left-radius:0px;}.kadence-column_57e7e9-93 > .kt-inside-inner-col:before{opacity:0.3;}.kadence-column_57e7e9-93{position:relative;}
Adam
20 Year Professional Trader
Founder of JumpstartTrading.com
FULL BIO >
- SEO Powered Content & PR Distribution. Get Amplified Today.
- PlatoAiStream. Web3 Data Intelligence. Knowledge Amplified. Access Here.
- Minting the Future w Adryenn Ashley. Access Here.
- Source: https://www.jumpstarttrading.com/day-trading-patterns/

