Posted June 6, 2024 at 6:45 am EST.
Investing in cryptocurrencies can often seem like a gamble, given their extreme volatility and how unforeseeable events, such as a viral moment on X (Twitter), can send prices moving in different directions. On these occasions, especially amid the sudden rise of memecoins, it can seem as if this market has little to no fundamentals to those unfamiliar with it. Yet due to the public nature of blockchains, which host these coins and tokens, a multitude of insights can be gathered about these assets and put to use by investors.
“Onchain data is like understanding the physical supply and demand of an asset,” said Philip Gradwell, chief economist at blockchain data firm Chainalysis, in an email to Unchained. “If you were trading natural gas, you would want to know how much gas is being produced from wells, how much is in storage, and how many households and factories are using it.”
Here are the top four metrics every crypto investor needs to know, according to experts.
Metric 1: Distribution and Balances of Whale Holdings
Understanding who the biggest holders of a particular cryptocurrency are — a group commonly referred to as “whales” — can be essential to understanding the asset itself.
One of the best ways to examine whale activity is to look at “top holder balances and distribution,” which blockchain analytics firm Nansen lists as a key onchain metric to analyze in its 2023 onchain data report.
For investors looking to decipher the “whales” of a particular token, they can lean on blockchain data platforms such as Nansen. On Nansen users can leverage “token god mode” and the balances tab to sort wallet addresses by percentage of ownership, the balance of the asset held, and other relevant factors.
Users can also use blockchain explorers, such as Etherscan and Blockchair, which typically list the top addresses for that respective network’s native token.
Identifying whales can help assess the quality of a project; if the addresses holding the largest amounts of a certain crypto are associated with reputable investors or entities then this can be a good sign for those interested in the asset, according to Nansen’s report.
Looking at how concentrated the asset is in the hands of whales is also important. If a token’s supply is mostly held by just a few then this puts the asset at risk of price manipulation.
An analysis of token concentration can be especially valuable when looking into “low float” coins, which have a small amount of tokens available for trading. The larger the share of these cryptocurrencies owned by whales, the greater the ability to manipulate the price. It can also be important for investors “trading short-term in assets with little liquidity,” Gradwell said.
“If a whale sends a lot of assets to an exchange or liquidity pool, then expect the price to fall as they could be selling an amount that will overwhelm the market,” he added.
Learn more: What Is Tokenomics? A Beginner’s Guide
Metric 2: Daily Active Addresses
One of the most important onchain metrics for investors is tracking the activity of blockchain users and what they are paying for, said Thomas Dunleavy, partner and chief investment officer at crypto investment firm MV Capital. He believes the best way to do this is by looking at the daily active addresses engaging with a project or blockchain.
Daily active addresses, meaning unique addresses that send or receive a specific crypto within 24 hours, can be utilized to do fundamental analysis on cryptocurrency projects by gauging user activity growth, said analysts in Nansen’s report, and in turn can specifically help investors understand the user activity growth for a particular digital asset.
Another common metric used for this type of analysis is number of transactions but it is not a great method because they can often be spoofed, said Dunleavy, adding that automated transactions made by bots and algorithmic trading tools can make it hard to determine genuine interactions.
Number of addresses should also be taken with a pinch of salt, said Chainalysis economist Gradwell.
“To identify bots, you need to look at behavior: does this address hold assets for a short time, does it make transfers really fast, how many counterparties does it have, how much does it pay in fees, are those fees paid in an illiquid asset, so may not actually cost as many dollars as you think?” he said.
Advanced tools such as Chainalysis and Elliptic can be used to get insights on patterns and behaviors of transactions. Additionally, blockchain explorer Etherscan offers advanced filters when browsing wallets, such as high transaction speed, large fees, and numerous counterparties.
Metric 3: MEV (Maximal Extractable Value)
MEV has become a hot topic in crypto, with some describing it as a major threat to the Ethereum blockchain. MEV is a practice in crypto where validators reorder transactions to maximize profit, through methods such as front-running and arbitrage, which sometimes can result in higher fees for the end user. MEV practices have gained popularity and as a result data from these types of transactions can play to the benefit of investors.
Learn more: What Is MEV in Crypto?
The amount of MEV occurring on a blockchain can be an indicator of what people are willing to spend on it, said Dunleavy, who has a TradFi background from his time working in fixed income at financial services firm State Street.
MEV activity resembles co-location and high-frequency trading in traditional markets, said Dunleavy, adding that “MEV can be used as a proxy for the financialized value that people actually have as their revealed preference for the blockchain.”
“Solana’s valuation really isn’t proxied through dollar amount spent or transaction fees like it is on Ethereum, but is actually proxied through something like MEV as fees compress to zero,” he added.
To gather metrics that will shed light on MEV activity, Dunleavy suggests investors turn to blockchain data platforms such as Defi Llama, Token Terminal, and Messari.
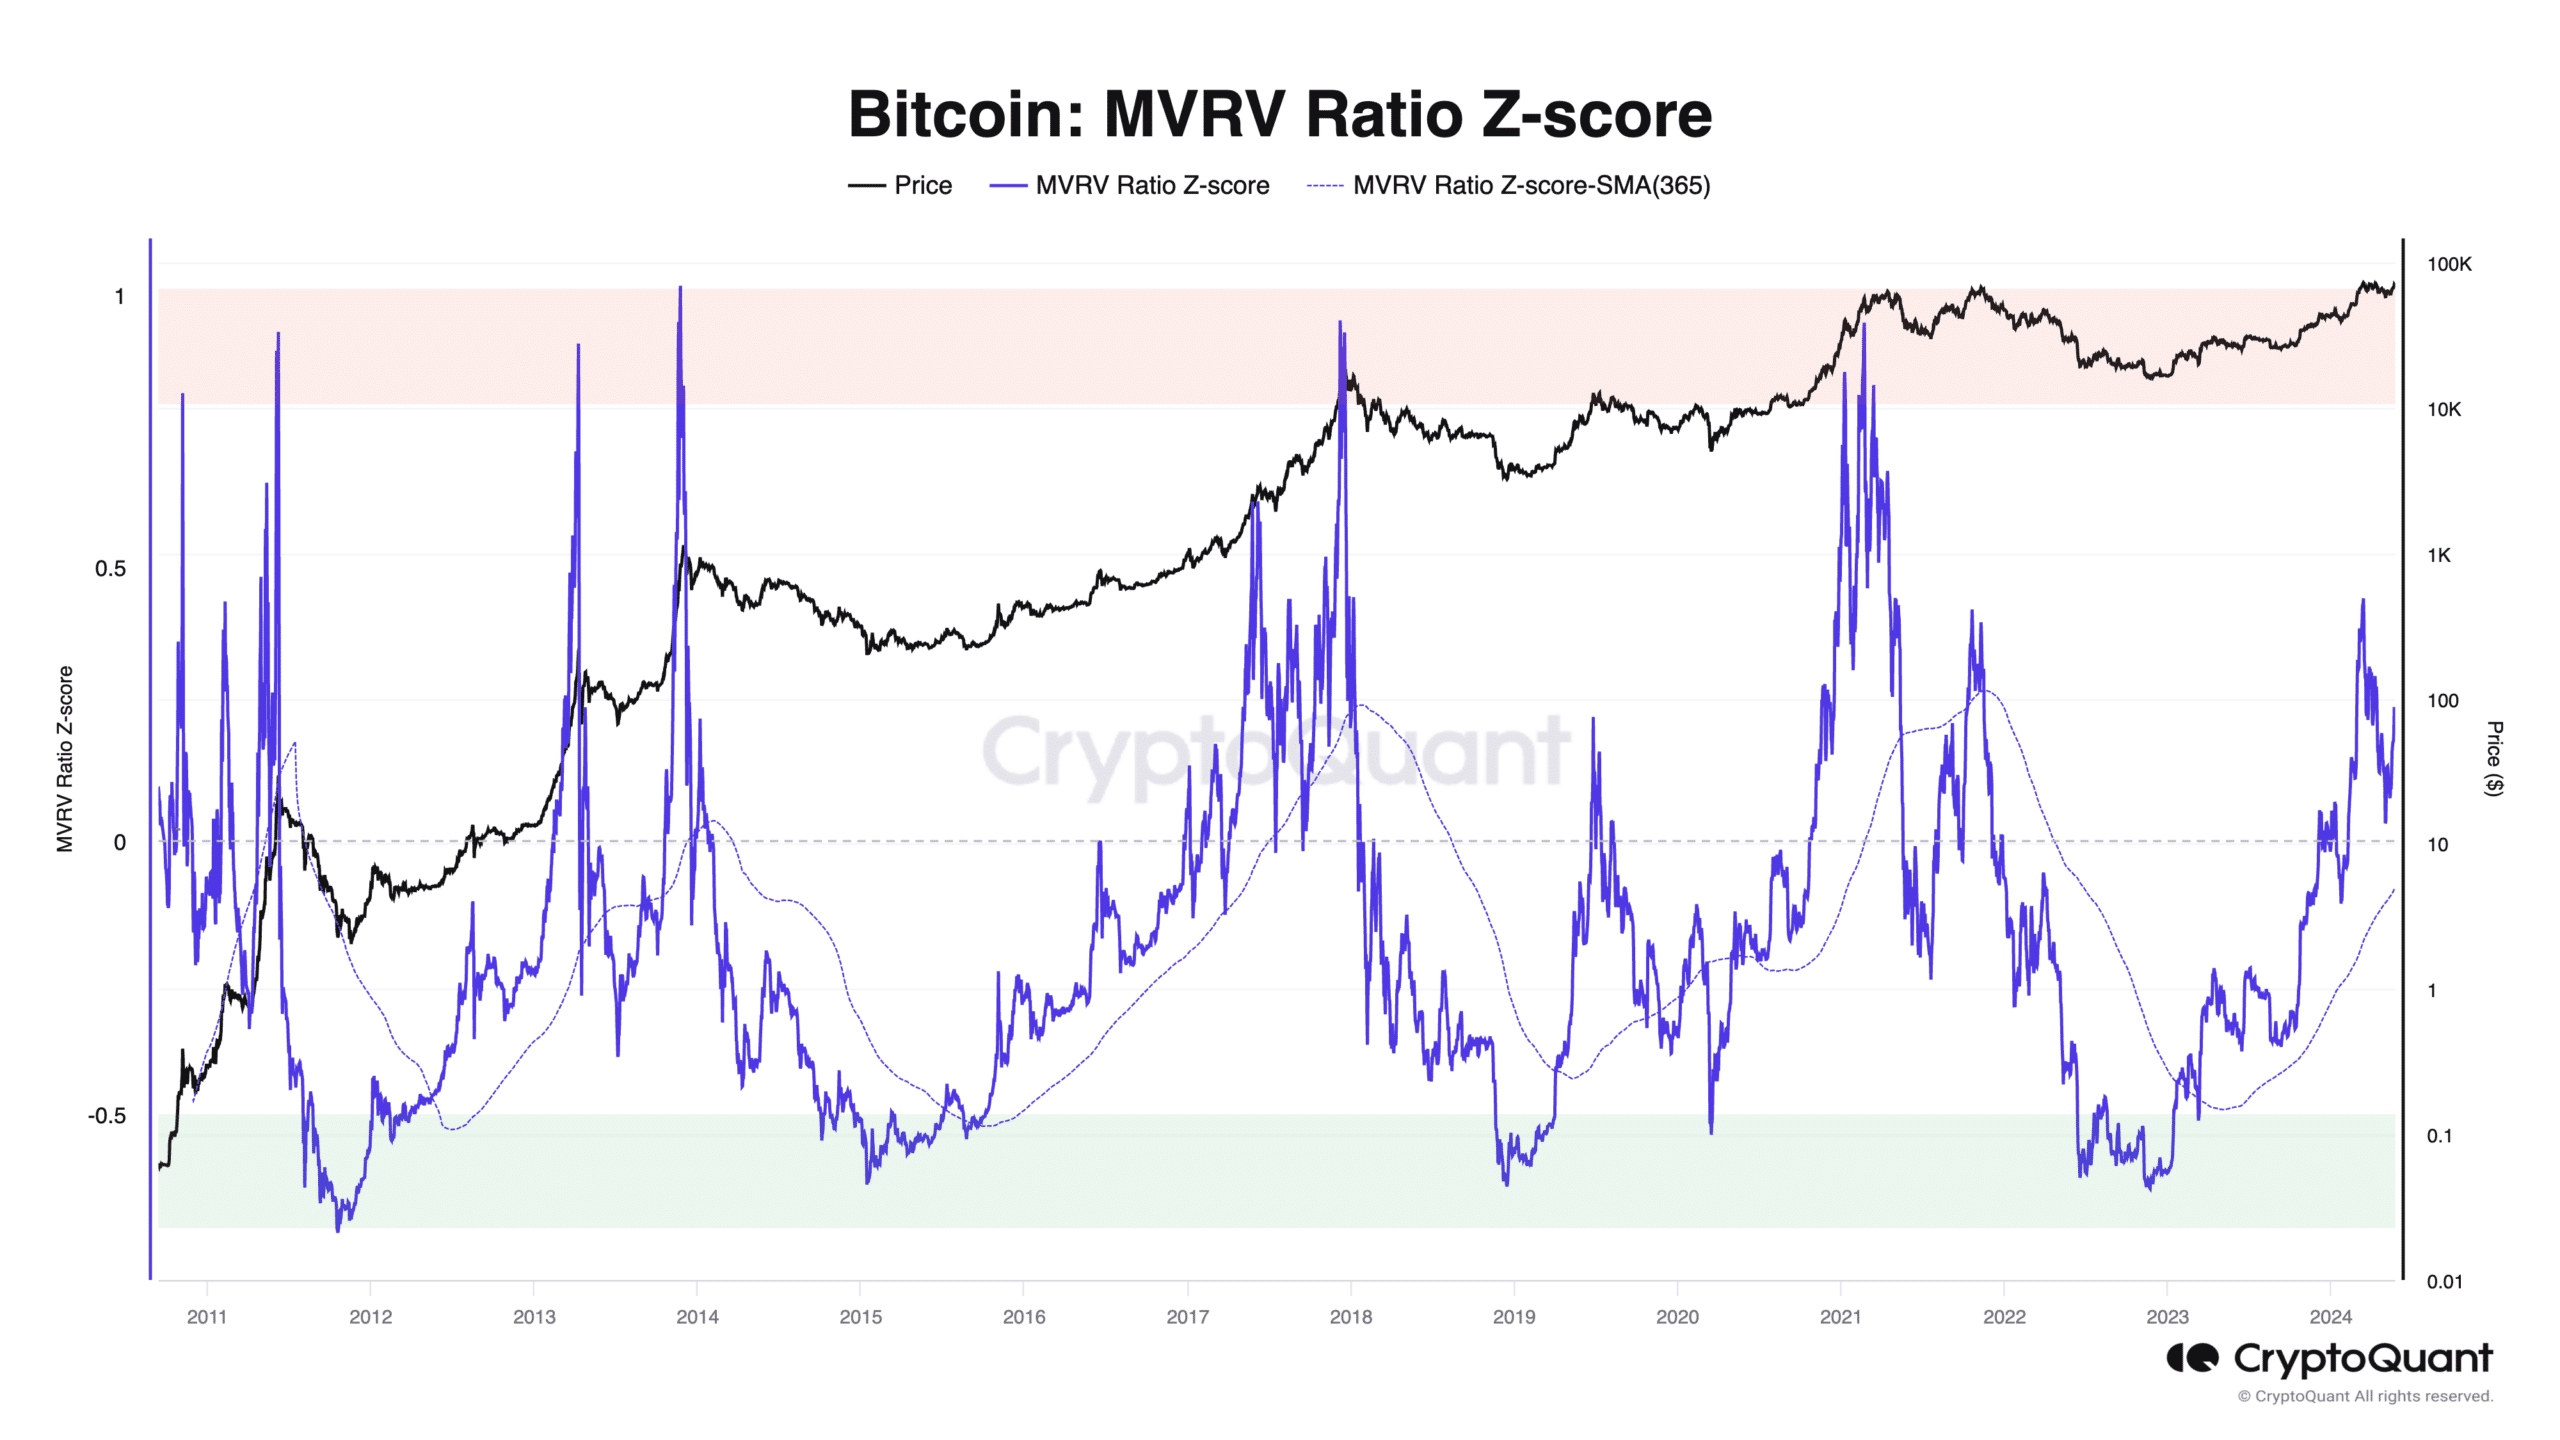
Metric 4: Market Value to Realized Value (MVRV)
Another key metric for traders is a cryptocurrency’s MVRV ratio, especially for those interested in bitcoin. MVRV is calculated by taking the current market capitalization and dividing it by the average purchase price, known as the realized capitalization. MVRV is primarily used for bitcoin because of the asset’s stability and multi-year trading history. As the metric is used to analyze long-term cycles, it is less reliable when analyzing datasets belonging to newer and more volatile cryptocurrencies.
The metric has been particularly useful in determining whether bitcoin is undervalued or overvalued at a given point in time, said Julio Moreno, head of research at onchain and market analytics firm CryptoQuant, in an email to Unchained.
For example, Moreno said that currently the MVRV is at .2 and is above its 365-day moving average (illustrated in the dashed purple line), which indicates that bitcoin remains in an upward cycle. If the ratio were to fall below the 365-day moving average this would mean bitcoin has entered a bear market.
This particular metric “has been really good at calling bottoms,” MV Capital’s Dunleavy said. But he has concerns about the metric’s reliability as a new wave of institutional investors enter the bitcoin market.
He said that following the approval of the spot bitcoin ETFs in the US and the over $15 billion worth of inflows to those products, “you’re going to have these price agnostic buyers going forward every two weeks buying it in their 401ks or with market buys. I think that really distorts the previous signal of momentum and bullishness you would have from actual transaction prices of bitcoin in that ratio.”
With renewed investor interest in cryptocurrencies following the spot bitcoin ETF approvals combined with bitcoin reaching an all-time high earlier this year, investors in the crypto space need to understand all the data and tools available.
“The communication gap to the everyday investor is still really, really large because it’s really hard to communicate why these things are still valuable,” Dunleavy said.
Learn more: How Token Supply Affects the Price of a Cryptocurrency
- SEO Powered Content & PR Distribution. Get Amplified Today.
- PlatoData.Network Vertical Generative Ai. Empower Yourself. Access Here.
- PlatoAiStream. Web3 Intelligence. Knowledge Amplified. Access Here.
- PlatoESG. Carbon, CleanTech, Energy, Environment, Solar, Waste Management. Access Here.
- PlatoHealth. Biotech and Clinical Trials Intelligence. Access Here.
- Source: https://unchainedcrypto.com/top-onchain-metrics-crypto-investor-know-understand-investing/

