OpenTelemetry (also known as OTel) is a collection of tools, APIs, and SDKs used for instrumenting, generating, collecting, and exporting telemetry data (metrics, logs, and traces) for analysis. The Cloud Native Computing Foundation (CNCF) manages this open-source observability platform, which aims to provide all the necessary components to observe your services in a vendor-neutral manner.
OpenTelemetry enables developers to build standardized and interoperable telemetry data collection pipelines across a wide array of industries. It makes it easy for developers to instrument their software with telemetry data, whether they’re working on a small, in-house project or a large-scale distributed system.
Observability is becoming a major focus of software development in many fields, but especially in the Internet of Things (IoT) industry. IoT deployments are hyper-distributed, with as many as millions of connected devices.
Because IoT devices have limited computing capabilities, it may not be possible to monitor them using traditional tools. This is where OpenTelemetry comes in, providing flexible ways to collect telemetry from IoT devices and achieve observability even for the most complex IoT environments.
We’ll introduce the basics of OpenTelemetry and then explain how it can help monitor and manage IoT communications, in particular using the MQTT protocol.
3 Core Concepts of OpenTelemetry
#1: Metrics
Metrics in OpenTelemetry are numerical representations of data measured over intervals of time. These could be measurements of system properties like CPU usage, and memory consumption, or custom business metrics like the number of items in a shopping cart.
Metrics help developers monitor the health of their applications and make informed decisions about resource allocation, performance tuning, and many other aspects of application development and maintenance.
#2: Logs
In OpenTelemetry, logs are timestamped records of discrete events. These events could be anything from an error or exception in your code, a system event, or a user operation.
Logs are crucial for understanding the behavior of an application and for debugging purposes. They provide a granular view of the events that occur within an application, making it easier to identify and fix issues.
#3: Tracing
One of the core concepts of OpenTelemetry is tracing. A trace in OpenTelemetry is defined as the representation of a series of causally-related events in a system.
These events can be anything from the start and end of a request, a database query, or a call to an external service. Tracing helps developers understand the sequence of events that led to a particular outcome, making it easier to debug and optimize their applications.
Components of OpenTelemetry
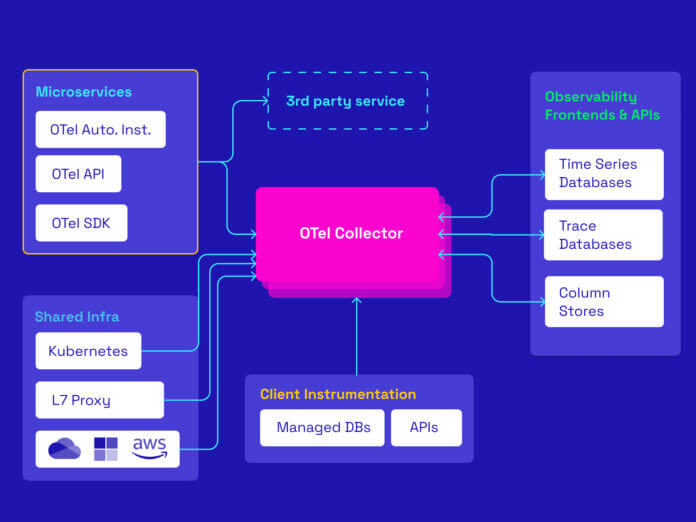
Let’s break down the components of OpenTelemetry. The diagram below illustrates how they work together.
OpenTelemetry Collector
The OpenTelemetry Collector acts as a vendor-agnostic bridge between your applications and the backends that process the data. The Collector can ingest, process, and export telemetry data.
It acts as an intermediary, allowing you to reduce the number of points of contact your applications need to make with your telemetry backend. It also standardizes your data so that it can be read by different telemetry backends.
Language SDKs
OpenTelemetry provides Language SDKs in several languages like Java, Python, and Go, among others. The SDKs are necessary for developers to instrument their code to capture telemetry data.
They provide APIs for manual instrumentation and also include automatic instrumentation libraries. The SDKs also handle batching and retry logic, making it easier for developers to ensure reliable data delivery.
Agents and Instrumentation
Agents are the components that you install into your services to generate telemetry data. They automatically instrument your code, adding trace and metric data collection with minimal code changes.
Instrumentation is the code that is inserted into your applications to collect the data. It can be manual, where developers add it to their code, or automatic, provided by the agents.
Exporters
Exporters are the components that transmit the telemetry data from your services to the backends. They transform the data into a format that your backend can understand. OpenTelemetry provides several exporters for common backends like Jaeger and Prometheus, but you can also write your custom exporters.
Benefits of OpenTelemetry for IoT Deployments
OpenTelemetry is increasingly being used to support observability in IoT environments. Here are several ways this versatile platform can benefit organizations managing large-scale IoT deployments:
- Enhanced observability: By integrating Internet of Things (IoT) systems with OpenTelemetry, you can gather data from various sources, including connected devices, to gain a holistic view of the system’s functionality. This comprehensive view is invaluable in identifying bottlenecks, potential failures, and areas for optimization.
- Improved troubleshooting: OpenTelemetry also aids in troubleshooting by providing detailed insights into the system’s operations. When issues arise, it can be difficult to identify the root cause, especially in distributed systems. However, OpenTelemetry’s trace and log data can help pinpoint the point of failure and maintain system uptime.
- Performance monitoring: Performance monitoring is another significant benefit of using OpenTelemetry. It allows developers to track the performance of their applications in real-time, ensuring they meet the desired performance standards. If performance drops, developers can use the detailed metrics provided by OpenTelemetry to identify the cause and implement necessary optimizations.
- Security insights: OpenTelemetry provides valuable security insights when it is used to track security-related events such as login attempts. Gaining visibility over security metrics and analyzing them can help identify security breaches or vulnerabilities, respond to them, and secure IoT systems.
- Facilitate distributed tracing: OpenTelemetry facilitates distributed tracing, a crucial feature in microservices architecture. Distributed tracing helps developers understand the journey of a request as it travels through various microservices. This is instrumental in diagnosing issues and optimizing service interaction in IoT environments.
Using OpenTelemetry with MQTT
MQTT (Message Queuing Telemetry Transport) is a popular lightweight messaging protocol that’s widely used in IoT deployments. MQTT’s strength lies in its simplicity and efficiency, making it well-suited for scenarios where network bandwidth is at a premium.
When coupled with OpenTelemetry, MQTT gains the power of a comprehensive observability framework. Here’s how OpenTelemetry complements MQTT:
- Data enrichment: OpenTelemetry can enrich the data packets transmitted via MQTT with additional metadata. This could include information like device identifiers, location tags, and more. This enriched data provides a more contextualized view of operations, thereby making it easier to draw meaningful insights.
- Centralized data collection: OpenTelemetry can collect data from multiple MQTT brokers and aggregate it into a centralized data store. This is particularly useful for large-scale IoT deployments that involve multiple brokers disseminating messages to numerous devices.
- Real-Time monitoring: Using OpenTelemetry, organizations can enable real-time monitoring of MQTT messages. This feature helps in identifying any delays or bottlenecks in message delivery, which is vital for mission-critical IoT applications where latency can have significant repercussions.
- Data export flexibility: With OpenTelemetry’s various exporters, you can push your telemetry data to a variety of data backends for further analysis. For example, you can export data from MQTT to cloud-based solutions like Azure Monitor or an on-premises setup like Grafana.
- Analytics and insights: By combining MQTT’s lightweight data transmission capabilities with OpenTelemetry’s robust analytics, organizations can perform deep dives into their data. This pairing makes it possible to optimize device performance, carry out predictive maintenance, and even identify market trends based on user behavior.
MQTT with OpenTelemetry: Key Metrics to Monitor
OpenTelemetry can provide valuable insights into an MQTT environment’s performance. Let’s look at the key metrics to monitor.
Client Metrics
Client metrics are crucial as they give insights into how each MQTT client is performing. These include metrics like the number of messages published, the number of messages received, and the number of active connections. Monitoring these metrics can help you identify any clients that are underperforming or causing issues in your system.
Message Metrics
Message metrics give you an overview of the overall message flow in your system. These include metrics like the total number of messages sent and received and the size of the messages.
By monitoring these metrics, you can gain insights into the load on your system and identify any potential bottlenecks or issues.
Broker Metrics
Broker metrics provide insights into the performance of your MQTT broker. These include metrics like the number of connected clients, the number of subscriptions, and the memory usage of the broker.
Monitoring these metrics can help you ensure that your broker is performing optimally and identify any potential issues early.
Latency Metrics
Latency metrics are crucial for understanding the performance of your system. These include metrics like the end-to-end latency and the latency of individual operations. High latency can affect the performance and reliability of your system, so monitoring these metrics can help you identify and address any issues early.
Error and Fault Metrics
Error and fault metrics are essential for understanding the reliability of your system. These include metrics like the number of dropped messages, the number of disconnects, and the number of errors thrown by your clients or broker.
Monitoring these metrics can help you detect and fix issues early, reducing the impact on your system’s performance and reliability.
- SEO Powered Content & PR Distribution. Get Amplified Today.
- PlatoData.Network Vertical Generative Ai. Empower Yourself. Access Here.
- PlatoAiStream. Web3 Intelligence. Knowledge Amplified. Access Here.
- PlatoESG. Carbon, CleanTech, Energy, Environment, Solar, Waste Management. Access Here.
- PlatoHealth. Biotech and Clinical Trials Intelligence. Access Here.
- Source: https://www.iotforall.com/the-benefits-of-opentelemetry-for-mqtt-and-iot-observability


