SNIP1 is required for the survival of NPCs in the murine embryonic brain
We first examined the expression of Snip1 in the murine embryonic brain by RNAscope40. At embryonic day E11.5 and E13.5, Snip1 transcripts were expressed in nearly all cells and robustly expressed in the neuroepithelia lining the ventricles, where NPCs reside (Supplementary Fig. 1b, c). To study SNIP1 in the murine embryonic brain, we used Nestin (Nes)::Cre to conditionally deplete SNIP1 in NPCs, hereafter referred to as Snip1Nes–KO. Nes::Cre is expressed in NPCs to recombine the flox sites and excise exon 2 of Snip1 (Fig. 1a, Supplementary Fig. 1d–f, Supplementary Fig. 2a–d). By E15, Snip1Nes-KO embryos displayed severe thinning of brain tissues and dysplasia with 100% penetrance (Fig. 1b, c, p < 0.0001 by Fisher’s exact test). To understand the cellular underpinnings of the brain dysplasia in Snip1Nes–KO, we examined cell proliferation and apoptosis of NPCs. NPCs were identified by their expression of the neural stem cell marker SRY-box 2 (SOX2). To identify proliferating cells in vivo, we injected BrdU into pregnant dams and/or detected the proliferative marker Ki67. Quantification of these markers in neuroepithelia did not reveal significant difference in proliferative NPCs in sibling control and Snip1Nes–KO embryos (Supplementary Fig. 2e–h).
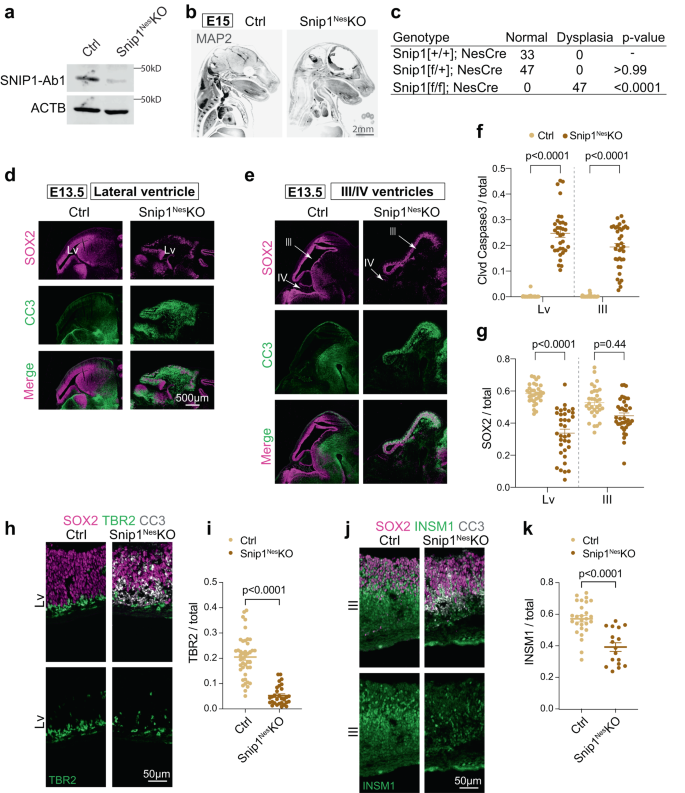
a WB of control and Snip1Nes-KO NPCs at E13.5. At least 5 replicates of control and Snip1Nes-KO NPCs showed similar results. SNIP1-Ab1; anti-SNIP1 antibody from ProteinTech. b IF of MAP2 in control and Snip1Nes-KO embryos at E15. Embryos were cleared by the iDISCO method and imaged with light sheet microscopy. Two replicates of IF showed similar results. Bar, 2 mm. c Penetrance of brain dysplasia in E13.5 embryos. Brain dysplasia was determined by the thinning of the brain tissue. Statistical significance was calculated by Fisher’s exact test. d–e IF of SOX2 and cleaved caspase 3 (CC3) in sagittal cryosections of the E13.5 brain. Germinal zones around lateral ventricle (Lv, forebrain), third ventricle, (midbrain) and fourth (hindbrain) ventricle were examined. Bar, 500 μm. f, g Quantification of CC3-positive and SOX2-positive cells in the neuroepithelial lining of the ventricles of control and Snip1Nes-KO embryos at E13.5. DAPI staining was used to count the total number of cells. Each data point represents one image. Eight control embryos and 7 Snip1Nes-KO embryos were analyzed. In (f), for lateral ventricle, n = 38 images (control) and n = 34 (Snip1Nes-KO); for the third ventricle, n = 38 (control) and n = 36 (Snip1Nes-KO). In (g), for lateral ventricle, n = 33 (control) and n = 35 (Snip1Nes-KO); for the third ventricle, n = 32 (control) and n = 37 (Snip1Nes-KO). Data are presented as mean ± SEM, and two-way ANOVA was used for statistical analysis. h–j IF of SOX2 and CC3 overlayed with neural lineage markers TBR2 and INSM1 of the E13.5 brain. Bar, 50 μm. i, k Quantification of TBR2-positive or INSM1-positive cells in the neuroepithelial lining of lateral or third ventricles. Each data point represents one image. Five to 8 control embryos and 3-7 Snip1Nes-KO embryos were analyzed. In (i), n = 43 images (control) and n = 30 (Snip1Nes-KO); in (k), n = 27 (control) and n = 17 (Snip1Nes-KO). Data are presented as mean ± SEM, and two-way ANOVA was used for statistical analysis. Source data are provided in a Source Data file (a, f, g, i, k).
We next probed apoptosis by IF of cleaved (cl)-caspase 3. At E13.5, all ventricles of Snip1Nes–KO displayed strong induction of cl-caspase 3 in the subventricular zones of neuroepithelia (Fig. 1d–f). The cl-caspase 3 signals overlapped SOX2-positive NPCs and TBR2-positive intermediate progenitors (Supplementary Fig. 2i–l), which were markedly reduced in Snip1Nes–KO neuroepithelia (Fig. 1d–i). INSM1-positive intermediate progenitors were similarly reduced in Snip1Nes–KO midbrain (Fig. 1j, k). These data suggest that SNIP1 suppresses apoptosis in NPCs and intermediate progenitors in the developing brain.
To capture the earlier events of the Snip1Nes–KO brain, we examined cl-caspase 3 in the E11.5 embryonic brain. By E11.5, cl-caspase 3 signals were detected throughout the Snip1Nes–KO brain (Supplementary Fig. 3a–d). As Nes::Cre is turned on by E10.541, SNIP1 depletion likely induces apoptosis within 24 h. The quantification of SOX2-positive cells in lateral, third, and fourth ventricles showed that only NPCs in the fourth ventricle became depleted by E11.5 (Supplementary Fig. 3e). Hereafter, we focused our analyses of lateral and third ventricles to study apoptosis control by SNIP1.
To ascertain that SNIP1 depletion consistently causes the observed apoptosis, we used Emx1::Cre to conditionally deplete SNIP1 in NPCs of the dorsal telencephalon42. The Snip1Emx1–KO embryos also showed strong induction of apoptosis, loss of TBR2-positive intermediate progenitors, and dysplasia of the forebrain (Supplementary Fig. 3f–k). These findings support that in the developing murine brain, apoptosis induction and dysplasia are specific to SNIP1 depletion. These data further support our conclusion that SNIP1 is required for an anti-apoptotic and pro-survival mechanism in NPCs and intermediate progenitors.
SNIP1 suppresses intrinsic apoptosis program
To shed light on the molecular underpinnings of the defective Snip1Nes–KO NPCs, we performed RNA-sequencing (RNA-seq) of SOX2-positive NPCs sorted from E13.5 Snip1Nes–KO and sibling controls (Fig. 2a, Supplementary Fig. 4a). We analyzed genes with count per million (CPM) values > 1 in either control or Snip1Nes–KO NPCs. Using the criteria of false discovery rate (FDR) < 0.05 to compare 4-replicate datasets each from control and Snip1Nes-KO NPCs, we identified 1210 upregulated genes and 1621 downregulated genes in Snip1Nes-KO (Fig. 2b, Supplementary Fig. 4b–d).
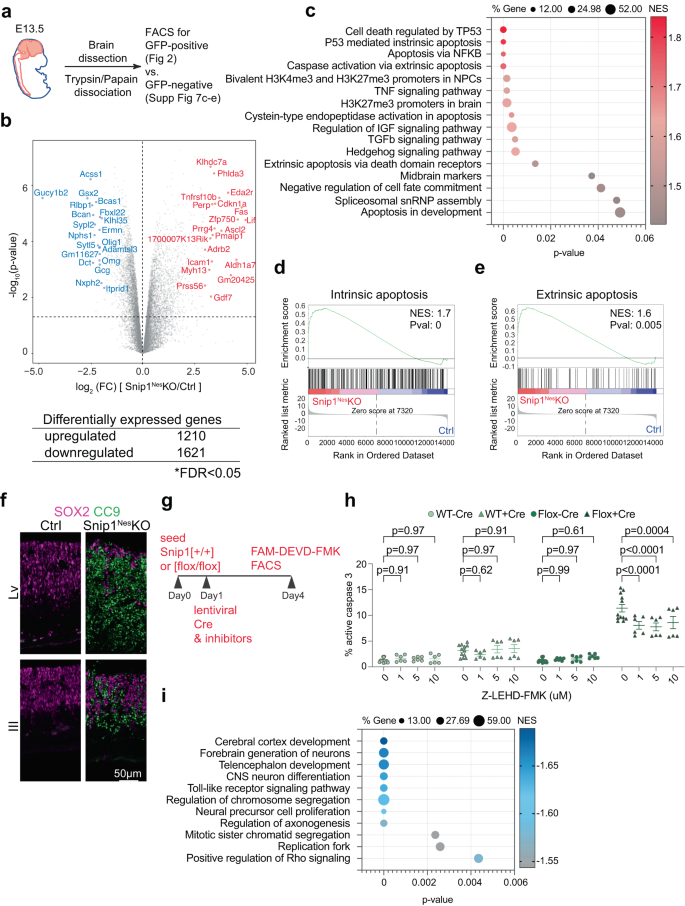
a Schematic of the brain NPC collection. b Volcano plot and the number of differentially expressed genes between the control and Snip1Nes-KO NPCs. The table shows the number of genes that passed the cutoff of FDR < 0.05. FDR was calculated by the Benjamini & Hochberg method. P values were calculated by two-sided Voom-limma t test. c, i Bubble plots of the enriched gene sets in upregulated genes and downregulated genes in Snip1Nes-KO vs. control NPCs. Differentially expressed genes were first ranked by their fold-change, p-value, and expression level before Gene Set Enrichment Analysis (GSEA) was performed. P-values were calculated by a right-sided permutation test with FDR adjustment. d, e Representative GSEA of upregulated genes in Snip1Nes-KO vs. control NPCs. Upregulated genes were enriched in gene sets related to both intrinsic and extrinsic apoptosis. Differentially expressed genes were first ranked by their fold-change and p-value before GSEA was performed. f IF of cleaved caspase 9 (CC9) overlayed with SOX2 in sagittal cryosections of the E13.5 brain. Bar, 50 μm. g Schematic of transduction with mCherry-Cre lentivirus and treatment with inhibitors in Snip1[+/+] and Snip1[flox/flox] NPCs. h The percentage of cells with active caspase 3 quantified by FACS. Caspase 9 inhibitor (Z-LEHD-FMK) was added at different concentrations along with mCherry-Cre lentivirus. The percentage of FAM-FLICA (active caspase 3)-positive population (out of total population) is shown. N = 12 for DMSO control and n = 6 for the rest of the sample. Data are presented as mean ± SEM, and two-way ANOVA was used for statistical analysis. The gating strategy and representative FACS plots are shown in Supplementary Information (Supplementary Fig. 4e, Supplementary Fig 14a). Source data are provided in a Source Data file (c, h, i).
Gene set enrichment analysis (GSEA) revealed that upregulated genes in Snip1Nes–KO NPCs were enriched in functions related to p53-mediated apoptosis, H3K27me3 or bivalent promoters in NPCs and the brain, midbrain markers, spliceosomal small nuclear ribonucleoprotein particles, and signaling pathways involving TNF, IGF, TGFβ, and Hedgehog (Fig. 2c). As intrinsic and extrinsic apoptotic signatures were enriched in the upregulated genes in Snip1Nes–KO NPCs (Fig. 2d, e), we examined the activation of these two pathways. IF showed little signal of cl-caspase 8, an effector of the extrinsic apoptosis pathway43,44 (Supplementary Fig. 5a) but strong signals of cl-caspase 9, an effector of the intrinsic apoptosis pathway45,46,47, throughout the neuroepithelia of ventricles (Fig. 2f). Additionally, quantification of cl-caspase 3 by FACS of FAM-DEVD-FMK staining48,49 show that whereas inhibition of caspase 8 modestly altered apoptosis, inhibition of caspase 9 robustly reduced apoptosis in the Snip1Nes–KO NPCs (Fig. 2g, h, Supplementary Fig. 4e, Supplementary Fig. 5b). A caspase 9 inhibitor, Z-LEHD-FMK, had effectively inhibited caspase 9 at 1 μM and caused cytotoxicity at 20 and 40 μM (Fig. 2h, Supplementary Fig. 4f). For identifying a cause of increased apoptosis, we did not detect an increase in DNA damage (Supplementary Fig. 5c–f) but detected strong increases of p53 signals in SOX2-positive NPCs (Supplementary Fig. 5g–i). These data suggest that the Snip1Nes–KO embryo displayed dysregulated control of p53-mediated intrinsic apoptosis in NPCs. We propose that SNIP1 primarily suppresses intrinsic apoptosis as part of a neurodevelopmental program.
Downregulated genes in Snip1Nes–KO NPCs were enriched in functions related to forebrain and cortex development, CNS neuron differentiation, chromosome segregation, NPC proliferation, axonogenesis, replication fork, and signaling pathways involving TLR and Rho (Fig. 2i). Although the Snip1Nes–KO forebrain tissues displayed severe thinning as a consequence of apoptosis, the forebrain marker FOXG1 and the mid/hindbrain marker OTX2 were similarly detected between the control and Snip1Nes–KO brains (Supplementary Fig. 5j). These data suggest that SNIP1 depletion did not alter forebrain specification.
Other downregulated genes in the Snip1Nes–KO NPCs were involved in the control of self-renewal (Fig. 2i). Characterization of the Snip1Nes–KO NPCs in vitro showed that, compared with control NPCs, cultured Snip1Nes–KO NPCs had reduced SOX2 expression (Supplementary Fig. 6a, b). By allowing NPCs to form neurospheres in suspension and through serial passaging, we observed that neurosphere number and cross-sectional area were significantly lower in Snip1Nes–KO compared with control (Supplementary Fig. 6c–e). Overexpressing human SNIP1 (85% identity with mouse SNIP1) was sufficient to rescue self-renewal in cultured Snip1Nes–KO NPCs (Supplementary Fig. 6f, g), suggesting functional conservation of SNIP1 between humans and mice. Overall, we conclude that SNIP1 promotes cell survival to maintain NPC self-renewal.
SNIP1 suppresses differentiation in NPCs
Because at E13.5, the embryonic brain undergoes neurogenesis, we examined the immature neuron marker TUJ1. The relative thickness of the TUJ1-positive region did not significantly differ between Snip1Nes–KO and control at E13.5 (Supplementary Fig. 7a, b). Considering that Snip1Nes–KO NPCs were progressively depleted, this lack of difference was a surprise. Therefore, we examined the molecular effect of SNIP1 in differentiating neural cells, which have lost the expression of NPC marker SOX2. We performed RNA-seq of SOX2:GFP-negative cells sorted from E13.5 Snip1Nes–KO and sibling control brains (Fig. 2a, Supplementary Fig. 4a). Using the criteria of fold-change >2 and p < 0.05 to compare 2-replicate datasets each from control and Snip1Nes-KO, we identified 658 upregulated genes and 150 downregulated genes in Snip1Nes-KO (Supplementary Fig. 7c). GSEA revealed that upregulated genes in Snip1Nes–KO cells were enriched in functions related to apoptotic clearance, neuronal specification and differentiation, midbrain markers, and known high-CpG-density promoters occupied by bivalent marks (H3K27me3 and H3K4me3) in NPCs50 (Supplementary Fig. 7d). Downregulated genes in Snip1Nes–KO cells were enriched in functions related to spliceosome, translation and ribosome, nucleosome organization, and apoptosis via p21 but not p53 (Supplementary Fig. 7e). These results suggest that SNIP1 suppresses apoptosis, neuronal specification and differentiation, midbrain genetic programs, and H3K27me3-occupied genes. At E13.5, although upregulated apoptosis reduces Snip1Nes–KO NPCs and intermediate progenitors, the remnant of which give rise to cells that had upregulated neuronal specification and differentiation. These in combination likely lead to no apparent difference in TUJ1-positive cortical thickness between Snip1Nes–KO and control.
Next, we assayed SNIP1 via in vitro differentiation of NPCs. We depleted SNIP1 on either Day 1 or Day 5 by transducing Snip1[flox/flox] NPCs with lentiviral control or Cre and profiled gene expression on Day 14 (Supplementary Fig. 7f). Quantitative qPCR showed that compared to control cells, SNIP1-depleted cells upregulated neuronal and glial markers but not NPC markers (Supplementary Fig. 7g, h). The timing of SNIP1 depletion (Day 1 vs. Day 5) did not affect this gene expression pattern (Supplementary Fig. 7g, h). These results further support that SNIP1 suppresses neurogenesis in NPCs. As global knockout (KO) of Snip1 in zebrafish embryos causes reduction in GABAergic and glutamatergic neurons35, we asked whether SNIP1 depletion alters subneuronal lineage specification in mice. Because of drastic brain tissue loss in Snip1Nes–KO, we could not robustly analyze brain development beyond E13.5. At E13.5, transcript levels of GABAergic neuronal markers Gad1 and Slc6a1 were lower in Snip1Nes–KO, and glutamatergic neuronal markers did not differ between Snip1Nes–KO and control (Supplementary Fig. 7i, j). Quantification of immunofluorescence showed significantly lower GABA- (GABAergic neuronal marker) positive cells in Snip1Nes-KO (Supplementary Fig. 7k, l), suggesting that the involvement of SNIP1 in specifying subneuronal lineages may be conserved in higher-order species.
SNIP1 directly regulates genes with H3K27 modifications
To determine whether SNIP1 proteins directly bind gene loci to regulate their expression, we profiled the genome-wide distribution of SNIP1 by CUT&RUN51 in Snip1Nes-KO and control NPCs. Using SICER52 and MACS253 with FDR < 0.05 to compare 2 datasets each from control and Snip1Nes–KO, we identified 23,188 SNIP1-bound regions in control NPCs and only 4187 regions in Snip1Nes–KO NPCs (Supplementary Fig. 8a–c). The 4187 regions are 18% of those in control and a consequence of remnant SNIP1 proteins in Snip1Nes–KO NPCs (Fig. 1a). Heatmaps showed drastic reduction of SNIP1 CUT&RUN signals in Snip1Nes-KO, suggesting the high specificity of SNIP1 CUT&RUN in NPCs (Fig. 3a). Approximately 50% of SNIP1-bound peaks were within promoters (within 2 kb of transcription start sites), 7.4% were located in exons, 23.3% in introns, 0.7% in transcription termination sites, 9.7% in 5′ distal (2–50 kb from a gene) regions, 3.4% in 3′ distal (2–50 kb from a gene) regions, and 5.5% in intergenic (beyond 50 kb from a gene) regions (Supplementary Fig. 8d). Only 18.6% of SNIP1-bound peaks were located distal to a gene (Supplementary Fig. 8d).
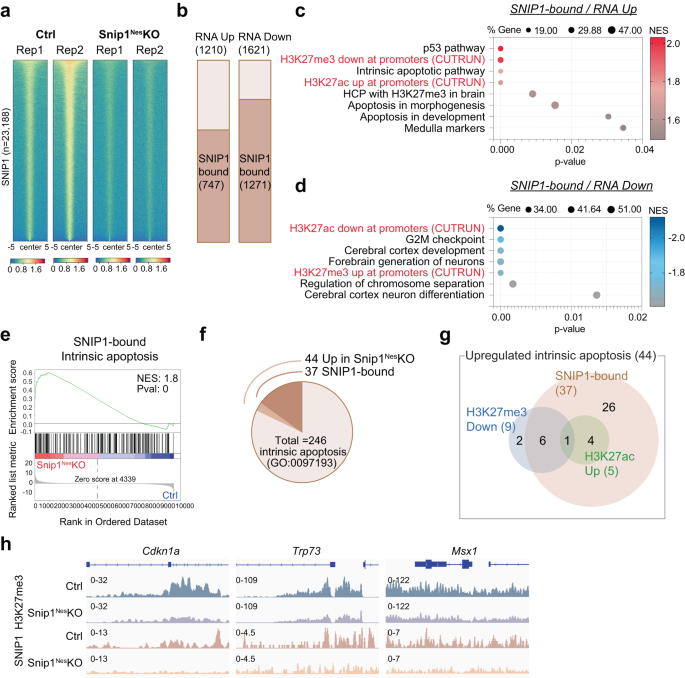
a Heatmaps representing the binding intensity of 2 biological replicates of SNIP1 CUT&RUN in control and Snip1Nes–KO NPCs. Binding intensity for 5 kb on either side of all 23,188 SNIP1 CUT&RUN peaks are shown. Blue indicates low intensity and red indicates high intensity. b Bar charts displaying the numbers of upregulated and downregulated genes (Snip1Nes–KO vs. control, FDR < 0.05) that are bound by SNIP1 at their gene body. c, d Bubble plots of the enriched gene sets in SNIP1-bound genes that became upregulated genes and downregulated genes in Snip1Nes-KO vs. control NPCs. When adding our H3K27me3/ac CUT&RUN data to the GSEA gene sets, H3K27me3 and H3K27ac levels showed anti-correlation and correlation with gene expression, respectively. Source data are provided in a Source Data file. e Representative GSEA of upregulated genes in Snip1Nes-KO NPCs vs. control NPCs that are bound by SNIP1 in control NPCs. Intrinsic apoptosis genes were mostly SNIP1-bound and were enriched in the upregulated genes in Snip1Nes-KO NPCs. Differentially expressed genes were first ranked by their fold-change and p-value before GSEA was performed. f Pie chart showing the proportions of intrinsic apoptosis genes that are upregulated in Snip1Nes-KO NPCs and/or bound by SNIP1. g Venn diagram displaying the numbers of upregulated intrinsic apoptosis genes in 3 categories. Using our SNIP1, H3K27me3, and H3K27ac CUT&RUN data, the 44 genes were categorized into 1) SNIP1-bound in control NPCs, 2) reduced H3K27me3 levels in Snip1Nes-KO vs. control NPCs (p < 0.05), and/or 3) increased H3K27ac levels in Snip1Nes-KO vs. control NPCs (p < 0.05). h H3K27me3 and SNIP1 CUT&RUN tracks visualized by Integrative Genomics Viewer (IGV) at upregulated intrinsic apoptosis genes. Cdkn1a, Chr17: 29,090,888 − 29,095,850. Trp73, Chr4: 154,132,565 − 154,143,373. Msx1, Chr5: 37,818,429 − 37,828,924.
Next, we examined whether SNIP1 occupancy correlates with gene expression. Of the 1210 upregulated genes and 1621 downregulated genes in Snip1Nes-KO, 747 (62%) and 1,271 (78%) were SNIP1 targets, respectively, in control NPCs (Fig. 3b). These overlaps are significant, with p = 5.55e-25 and 2.24e-155, respectively, by the hypergeometric test (given a total of 21,636 expressed genes), suggesting that SNIP1 occupies these genes to regulate their expression. GSEA showed that SNIP1 targets that became upregulated in Snip1Nes–KO were enriched in p53 pathway, medulla/midbrain, and apoptosis (Fig. 3c), whereas SNIP1 targets that became downregulated in Snip1Nes–KO were enriched in G2/M checkpoint, cortical development, and chromosome segregation (Fig. 3d). Of the 1,621 downregulated genes in Snip1Nes–KO, 1,093 were SNIP1-bound (not PRC2-bound) and enriched in genetic programs in G2-M checkpoint, mitotic spindle, key signaling pathways for neurodevelopment, and apoptosis (Supplementary Fig. 8e), suggesting that SNIP1 promotes their expression. Intrinsic apoptosis genes were enriched in SNIP1 targets that became upregulated in Snip1Nes-KO (Fig. 3e, f, Supplementary Fig. 8f, g). Of the 44 genes in the intrinsic apoptosis gene set, 37 promoters were bound by SNIP1 in control NPCs (p = 4.62e-5; Fig. 3g), suggesting that SNIP1 directly suppresses these genes. These data suggest that SNIP1 directly regulates genetic programs crucial to apoptosis and cell cycle.
Upregulated genes in Snip1Nes-KO were enriched in genes whose high-CpG-density promoters that are 1) H3K27me3-occupied in the embryonic murine brain50 or 2) bivalent in mouse NPCs54 (Supplementary Fig. 9a, b). This prompted us to scrutinize whether SNIP1 controls genetic programs through H3K27 modifications. We profiled H3K27me3 and H3K27ac by CUT&RUN in Snip1Nes-KO and control SOX2-positive NPCs (Supplementary Fig. 9c–g). We observed a strong correlation between upregulated genes, lower H3K27me3 occupancy, and higher H3K27ac occupancy, whereas downregulated genes had higher H3K27me3 occupancy and lower H3K27ac occupancy in Snip1Nes-KO (Fig. 3c, d, Supplementary Fig. 9h, i). Among the 44 upregulated intrinsic apoptosis genes, 9 genes showed reduced H3K27me3 occupancy, and 5 genes showed increased in H3K27ac occupancy (p < 0.05, Fig. 3g, h, Supplementary Fig. 9j, k). These data suggest that SNIP1 at chromatin controls H3K27 modifications and gene expression.
TGFβ and NFκB signaling pathways control SNIP1 localization to chromatin
As SNIP1 participates in TGFβ22,23,24,25 and NFκB26,27,28,29,30 signaling pathways, we aimed to test whether their inhibition affects apoptosis in SNIP1-depleted NPCs. We tested 3 inhibitors to TGFβ or NFκB signaling for toxicity to NPCs (Fig. 4a, b). At 0.1–0.5 μM concentrations, K02288 targeting TGFβ (but not Galunisertib or LDN-193189) consistently reduced apoptosis in SNIP1-depleted NPCs (Fig. 4c–e). In contrast, 2 inhibitors to TGFβ signaling and 3 inhibitors to NFκB signaling increased apoptosis in NPCs (Fig. 4f–h). Therefore, we decided to test whether any of the 6 inhibitors alters SNIP1 binding to chromatin. We treated NPCs with DMSO or inhibitors at 0.5 μM for 3 days and performed CUT&RUN to assay SNIP1 localization on chromatin (Fig. 4i). Analyzing 2 replicate SNIP1 CUT&RUN data per treatment condition, we used p < 0.05 to identify significant and consistent differences in SNIP1 CUT&RUN signals between inhibitor and control treatments. We identified SNIP1 CUT&RUN changes induced by K02288 treatment (Supplementary Data 1). We also identified significant changes in SNIP1 CUT&RUN at SNIP1-bound genes that overlap in any 2 inhibitor treatments (Supplementary Data 1). Average profiling of SNIP1 CUT&RUN signals at SNIP1-bound promoters in NPCs treated with different inhibitors confirmed that inhibition to TGFβ (Fig. 4j, k) and NFκB (Fig. 4l, m) signaling significantly altered SNIP1 binding to promoters. These data suggest that TGFβ and NFκB signaling pathways control SNIP1 binding to specific gene loci in NPCs.
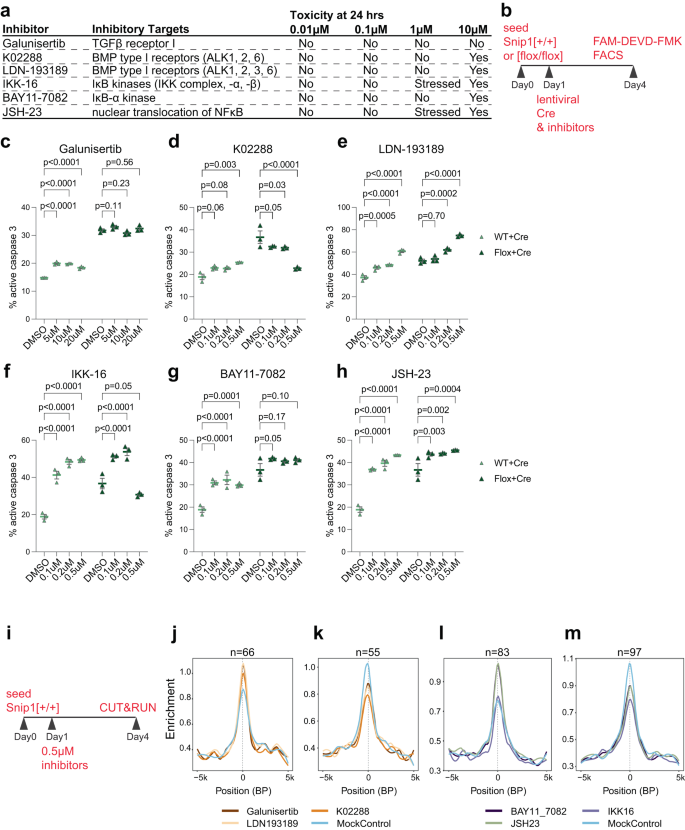
a Inhibitors targeting components in TGFβ and NFκB signaling pathways and their cytotoxicity at different concentrations. b Schematic of inhibitor assay. On Day 1, WT or Snip1[flox/flox] NPCs were treated with inhibitor or DMSO and transduced with lentiviral Cre for SNIP1 depletion. FAM-DEVD-FMK was used for assaying cl-caspase 3 by FACS on Day 4. c–h The percentage of cells with active caspase 3 quantified by FACS. Inhibitors were added at different concentrations along with mCherry-Cre lentivirus. The percentage of FAM-FLICA (active caspase 3)-/ mCherry-double positive population (out of mCherry-positive population) is shown. N = 3 for each treatment. Data are presented as mean ± SEM, and two-way ANOVA was used for statistical analysis. The representative FACS plots are shown in Supplementary Fig. 14c, d. Source data are provided in a Source Data file. i Schematic of SNIP1 CUT&RUN with inhibitor treatment. At day 1, NPCs were treated with DMSO control or different inhibitors. Replicate SNIP1 CUT&RUN was performed for each of the 7 treatments on day 4. j–m Profile plots comparing the median binding intensity of SNIP1 in NPCs at the SNIP1-bound targets that had significantly higher or lower SNIP1 binding in inhibitors versus DMSO control treatment. n indicates region numbers. Regions were considered true SNIP1 targets when SNIP1 levels reduced in Snip1Nes-KO vs. control NPCs with p < 0.05.
PRC2 requires SNIP1 for localization to chromatin and H3K27me3 deposition
We investigated the interactions between SNIP1, H3K27 methyltransferase PRC2, and histone acetyltransferases p300 and CBP. Anti-SNIP1 antibody co-immunoprecipitated with known PRC2 subunits Jumonji and AT-rich interaction domain containing 2 (JARID2), Suppressor of zeste 12 (SUZ12), and EZH2, but not the negative control RBBP5 in the NPC nuclear extract (Fig. 5a). Anti-SNIP1 antibody did not co-immunoprecipitate with PRC2 subunits in SNIP1-depleted NPCs (Supplementary Fig. 10a), supporting specificity of the antibody. Anti-JARID2, EZH2, or EED antibody co-immunoprecipitated SNIP1 and other PRC2 subunits but not the negative control RBBP5 in the NPC nuclear extract (Fig. 5b–d). Anti-p300 or CBP antibody failed to co-immunoprecipitate SNIP1, suggesting that in NPCs, their physical interaction is undetectable (Supplementary Fig. 10b, c). The PRC2–SNIP1 binding is supported by other proteomics studies that showed PRC2 co-immunoprecipitates SNIP119,20.
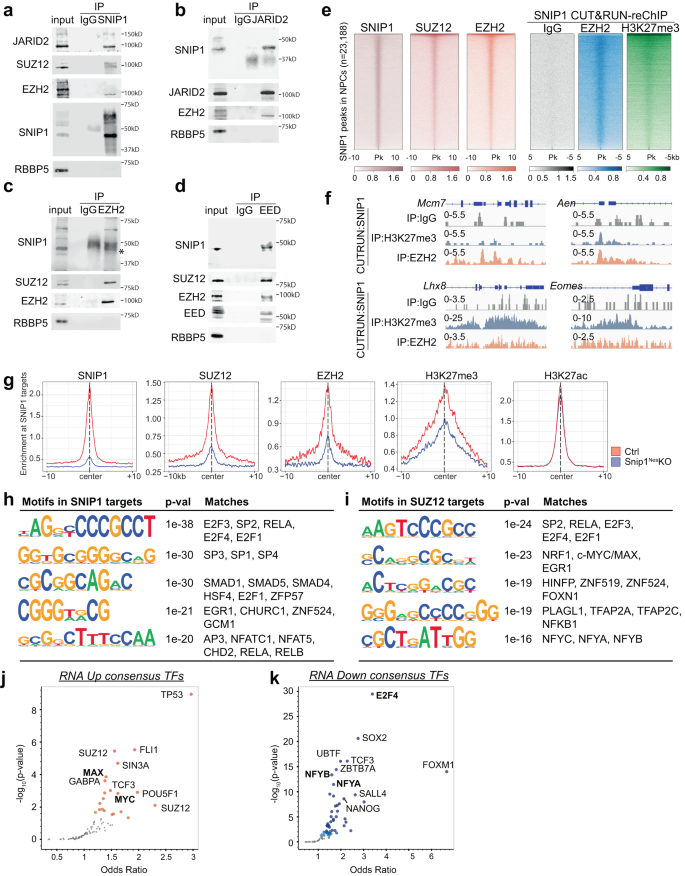
a–d Co-immunoprecipitation followed by WB to examine the interaction between SNIP1 and PRC2. (a) SNIP1, (b) JARID2, (c) EZH2, or (d) EED was immunoprecipitated in the NPC nuclear extract. RBBP5 was a negative control. Source data are provided as a Source Data file. e Heatmaps aligning chromatin peaks enriched with SNIP1, SUZ12, and EZH2 in NPCs. Peaks from SNIP1 CUT&RUN–reChIP with IgG, EZH2, and H3K27me3 were aligned to SNIP1-bound peaks. Intensity for 5 or 10 kb on either side of 23,188 SNIP1-bound peaks are shown. A dark color indicates high intensity and a light color indicates low intensity. f Tracks of SNIP1 CUT&RUN–reChIP with IgG, EZH2, and H3K27me3 are visualized by Integrative Genomics Viewer (IGV). Mcm7, Chr5: 138,169,717 − 138,173,621. Aen, Chr7: 78,894,526 − 78,898,271. Lhx8, Chr3: 154,325,066 − 154,334,835. Eomes, Chr9: 118,474,178 − 118,480,775. g Profile plots comparing the median binding intensity of SNIP1, PRC2, and H3K27me3/ac in Snip1Nes-KO vs. control NPCs at the SNIP1 targets. Regions were considered true SNIP1 targets when SNIP1 levels were reduced in Snip1Nes-KO vs. control NPCs with p < 0.05. h, i Motifs of SNIP1- and SUZ12-bound regions where their levels significantly reduced in Snip1Nes–KO NPCs with fold-change >2 and p < 0.05. HOMER de novo analysis was performed and the five motifs with lowest p-values and had vertebrate motif matches are listed here. j, k Volcano plots of transcription factors whose binding to our differentially expressed genes (FDR < 0.05) has been reported. Genes were searched against ENCODE and ChEA consensus TFs from ChIP-X database using Enrichr56. Darker colors show smaller p-values and large points passed p-value < 0.05. Transcription factors in bold were found in our CUT&RUN motif analyses in Fig. 5h, i.
We tested whether SNIP1 alters the expression of PRC2 subunits. Although SNIP1 depletion lowered Ezh2 transcript levels, it did not alter the protein levels of PRC2 subunits, H3K27me3, or H3K27ac (Supplementary Fig. 10d–g). Next, we performed CUT&RUN to profile SUZ12 and EZH2 in Snip1Nes-KO and control NPCs (Supplementary Fig. 10h–j). Consistent with the co-immunoprecipitation results, SUZ12, and EZH2 co-occupy SNIP1-bound target sites genome-wide (Fig. 5e). To analyze PRC2–SNIP1 interactions on chromatin, we performed CUT&RUN-reChIP. In this assay, chromatin released by SNIP1 CUT&RUN were immunoprecipitated by IgG, EZH2, or H3K27me3. The representative loci Mcm7, Aen, Lhx8, and Eomes had co-occupancy of SNIP1 with EZH2 and H3K27me3 but not negative control IgG (Fig. 5f). Genome wide, CUT&RUN-reChIP showed that EZH2 and H3K27me3 had high overlaps with SNIP1 and PRC2 at SNIP1-bound peaks (Fig. 5e).
In examining the role of SNIP1 in PRC2 chromatin occupancy, we found that the levels of SUZ12, EZH2, and H3K27me3 at chromatin were significantly reduced in Snip1Nes-KO (Fig. 5g, Supplementary Figs. 10k, 11a). In contrast, H3K27ac levels were less altered in Snip1Nes-KO NPCs (Fig. 5g, Supplementary Figs. 10k, 11a). Next, we used an in vitro assay to analyze the kinetic effect of SNIP1 depletion on PRC2. Compared with control lentivirus, lentiviral Cre transduction of Snip1[flox/flox] NPCs depleted SNIP1 transcripts by 70% and 99.9% on the second and third day, respectively. This did not alter the transcript level of PRC2 components (Supplementary Fig. 11b). Using EZH2 and SUZ12 CUT&RUN, we observed a strong reduction of PRC2 on chromatin by the third day of SNIP1 depletion (Supplementary Fig. 11c). Together, these data support that PRC2 requires SNIP1 for binding to chromatin.
To characterize the SNIP1-PRC2 targets, we performed de novo motif discovery by the HOMER software55. Using the criteria of fold-change >2 and p < 0.05 in control vs Snip1Nes-KO, SNIP1 targets were enriched in motifs of E2F proteins, SP1/3/4, and EGR1 (Fig. 5h). Motifs of previously reported SNIP1 interactors, SMAD proteins and RELA, were also found amongst SNIP1 targets21,26. In SUZ12-bound peaks that had reduced binding in Snip1Nes-KO, motifs were enriched with SP2, RELA, E2F proteins, EGR1, HINFP, PLAGL1, and NF-Y subunits (Fig. 5i). The similarities of SNIP1- and SUZ12-bound motifs point to potential interactions of SNIP1 and PRC2 with some of these transcription factors.
We next examined whether the SNIP1- or SUZ12-bound motifs were overrepresented in differentially expressed genes. Using Enrichr56, we found that upregulated genes in Snip1Nes-KO were targets of TP53, FLI1, SUZ12, MAX, and MYC, whereas downregulated genes were targets of E2F4, SOX2, NFYB and NFYA (Fig. 5j, k). E2F proteins were uncovered by motif and Enrichr analyses, and E2F4 targets Mcm7 and Anp32e were SNIP1 and PRC2 targets that had reduced binding in Snip1Nes-KO (Fig. 5k, Supplementary Fig. 11d). Among upregulated genes in Snip1Nes-KO, MYC and MAX targets were identified by both motif and Enrichr analyses (Fig. 5j, Supplementary Fig. 11e). These data suggest that E2F proteins, MYC, and MAX may influence SNIP1-PRC2 activities for gene regulation.
PRC2 promotes apoptosis in the absence of SNIP1
We tested the role of PRC2 in NPC survival in vivo. We used Nes::Cre to excise exons 3 to 6 of Eed (a PRC2 core subunit) to generate EedNes-KO and Snip1Nes-EedNes-dKO (Supplementary Fig. 12a, b). EED depletion in NPCs did not induce apoptosis in EedNes-KO E13.5 brain (Supplementary Fig. 12c–g). Others had studied EED in the control and EedEmx1-KO dorsal telencephalon and made conclusions57 that differed from our observations in EedNes-KO E13.5 brain. This difference could be explained by the expression of Emx1::Cre and Nes::Cre at different developmental stages and brain regions. Apoptosis was observed in other brain regions of control and EedNes-KO brains (Supplementary Fig. 12c, d). As EED has already been shown to affect neurogenesis at E14.5 but not E16.557, the exact effect of EED/PRC2 on NPC functions is developmental stage- and cell context-dependent. Our analysis showed that compared with Snip1Nes–KO, Snip1Nes-EedNes-dKO had significantly fewer cl-caspase 3-positive cells (Fig. 6a–c), more SOX2-positive NPCs (Fig. 6d, e), and more TBR2- or INSM1-positive intermediate progenitors (Fig. 6f–i). TUJ1-positive immature neurons were not markedly affected by the SNIP1–PRC2 functional interaction (Supplementary Fig. 12h, i). EED depletion in the Snip1Nes–KO embryonic brain reduced apoptosis and rescued NPCs and intermediate progenitors. Therefore, SNIP1 suppresses apoptosis in the developing brain by counteracting PRC2.
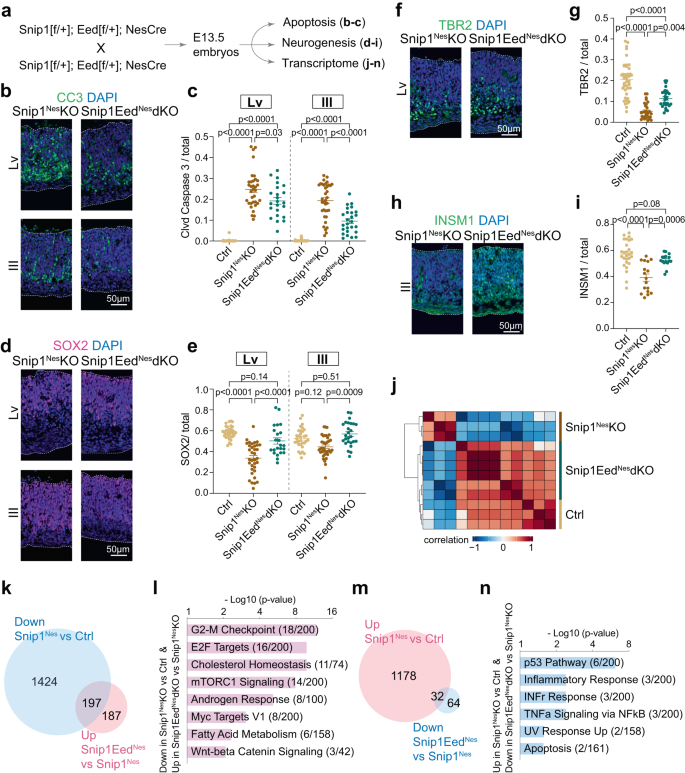
a Schematic of the genetic cross depleting both SNIP1 and EED for downstream assays. b, c IF analysis of CC3 overlayed with DAPI of the E13.5 brain. Bar, 50 μm. Each data point represents one image. Eight control embryos, 7 Snip1Nes-KO embryos, and 5 Snip1Nes-EedNes-dKO embryos were analyzed. For lateral ventricle, n = 38 images (control), n = 34 (Snip1Nes-KO), and n = 23 (Snip1Nes-EedNes-dKO). For third ventricle, n = 38 (control), n = 36 (Snip1Nes-KO), and n = 26 (Snip1Nes-EedNes-dKO). d–i IF of NPC marker SOX2, and intermediate progenitor markers TBR2 and INSM1 overlayed with DAPI of the E13.5 brain. Bar, 50 μm. The populations of (e) SOX2-positive, (g) TBR2-positive, or (i) INSM1-positive cells in the neuroepithelial lining of lateral and/or third ventricles were quantified. Each data point represents one image. In (g), n = 43 images (control), n = 30 (Snip1Nes-KO), and n = 29 (Snip1Nes-EedNes-dKO). In (i), n = 27 (control), n = 17 (Snip1Nes-KO), and n = 16 (Snip1Nes-EedNes-dKO). For Panels c, e, g, and i, data are presented as mean ± SEM, and two-way ANOVA was used for statistical analysis. j Unsupervised clustering of RNA-seq data from control (n = 3), Snip1Nes-KO (n = 3), and Snip1Nes-EedNes-dKO (n = 6) brains at E13.5. RNAs from forebrain and midbrain regions were sequenced and merged for downstream analyses. Blue indicates a negative correlation and red indicates a positive correlation. k, m Venn diagrams displaying the numbers of differentially expressed genes with FDR < 0.05. The lists of downregulated genes in Snip1Nes-KO vs. control and upregulated genes in Snip1Nes-EedNes-dKO vs. Snip1Nes-KO are compared in (k). The lists of upregulated genes in Snip1Nes-KO vs. control and downregulated genes in Snip1Nes-EedNes-dKO vs. Snip1Nes-KO are compared in (m). l, n Gene ontology of the rescued genes corresponding to Fig. 6k, m. Genes were searched against Molecular Signatures Database (MSigDB) Hallmark 2020 using Enrichr56. Source data are provided in a Source Data file (c, e, g, i, l, n).
We profiled the transcriptomes of control, Snip1Nes–KO, and Snip1Nes-EedNes-dKO brain tissues. Unsupervised clustering based on top 3,000 most differentially expressed genes (based on median variation values) suggests a higher similarity in the transcriptomes between control and Snip1Nes-EedNes-dKO compared with Snip1Nes–KO (Fig. 6j). Using fold-change >2 and p < 0.05 to compare datasets from Snip1Nes-KO and Snip1Nes-EedNes-dKO, we identified 184 upregulated genes and 994 downregulated genes in Snip1Nes-EedNes-dKO (Supplementary Fig. 13a).
To provide a potential molecular explanation of the rescue of NPCs and intermediate progenitors in Snip1Nes-EedNes-dKO, we analyzed differentially expressed genes among control, Snip1Nes-EedNes-dKO, and Snip1Nes-KO. We found that 197 downregulated genes in Snip1Nes–KO partially regained expression in Snip1Nes-EedNes-dKO (Fig. 6k). These rescued genes are involved in G2/M checkpoint, E2F targets, cholesterol homeostasis, mTORC1 signaling, and androgen response (Fig. 6l). In contrast, 32 upregulated genes in Snip1Nes-KO became downregulated in Snip1Nes-EedNes-KO (Fig. 6m) and are involved in p53 pathway, inflammatory and interferon gamma responses, NFκB signaling, and apoptosis (Fig. 6n). Of these 32 genes, Cdkn1a is the only intrinsic apoptosis gene with significantly lower H3K27me3 levels in Snip1Nes-KO versus control (FDR < 0.05; Supplementary Fig. 13b), suggesting that SNIP1 directly promotes PRC2 and H3K27me3 at the Cdkn1a locus. Our profiling of SNIP1-PRC2 genome occupancy suggests that SNIP1 inhibits H3K27me3 deposition at loci that include E2F targets (Supplementary Fig. 11d) but promotes H3K27me3 deposition at other loci that include apoptotic genes Cdkn1a, Nkx2-9, Etv4, Pxdc1, and Tap1 (Supplementary Fig. 13b, c). Taken together, SNIP1 exerts loci-dependent control of H3K27me3 deposition and gene expression to balance of NPC division, apoptosis, and differentiation in the developing brain.
- SEO Powered Content & PR Distribution. Get Amplified Today.
- PlatoData.Network Vertical Generative Ai. Empower Yourself. Access Here.
- PlatoAiStream. Web3 Intelligence. Knowledge Amplified. Access Here.
- PlatoESG. Automotive / EVs, Carbon, CleanTech, Energy, Environment, Solar, Waste Management. Access Here.
- BlockOffsets. Modernizing Environmental Offset Ownership. Access Here.
- Source: https://www.nature.com/articles/s41467-023-40487-4

