
Published 13 hours ago
MATIC Price Prediction: With the increasing FUD in the crypto market, the MATIC price downtrend has recently taken a slight detour and turned sideways. The price action moving with lower highs and higher lows within two converging trendlines has revealed an inverted pennant pattern formation. In theory, this technical setup indicates the prices are likely to continue their downward trend once it breaks below the lower trendline. Here’s how you can use this pattern to your advantage.
advertisement
Key Points
- The area between the two trendlines of the pennant pattern can be considered as a no-trading zone
- A potential breakout from either of the trendline will determine the future price movement.
- The intraday trading volume in the MATIC is $167.9 Million, indicating a 21% gain.
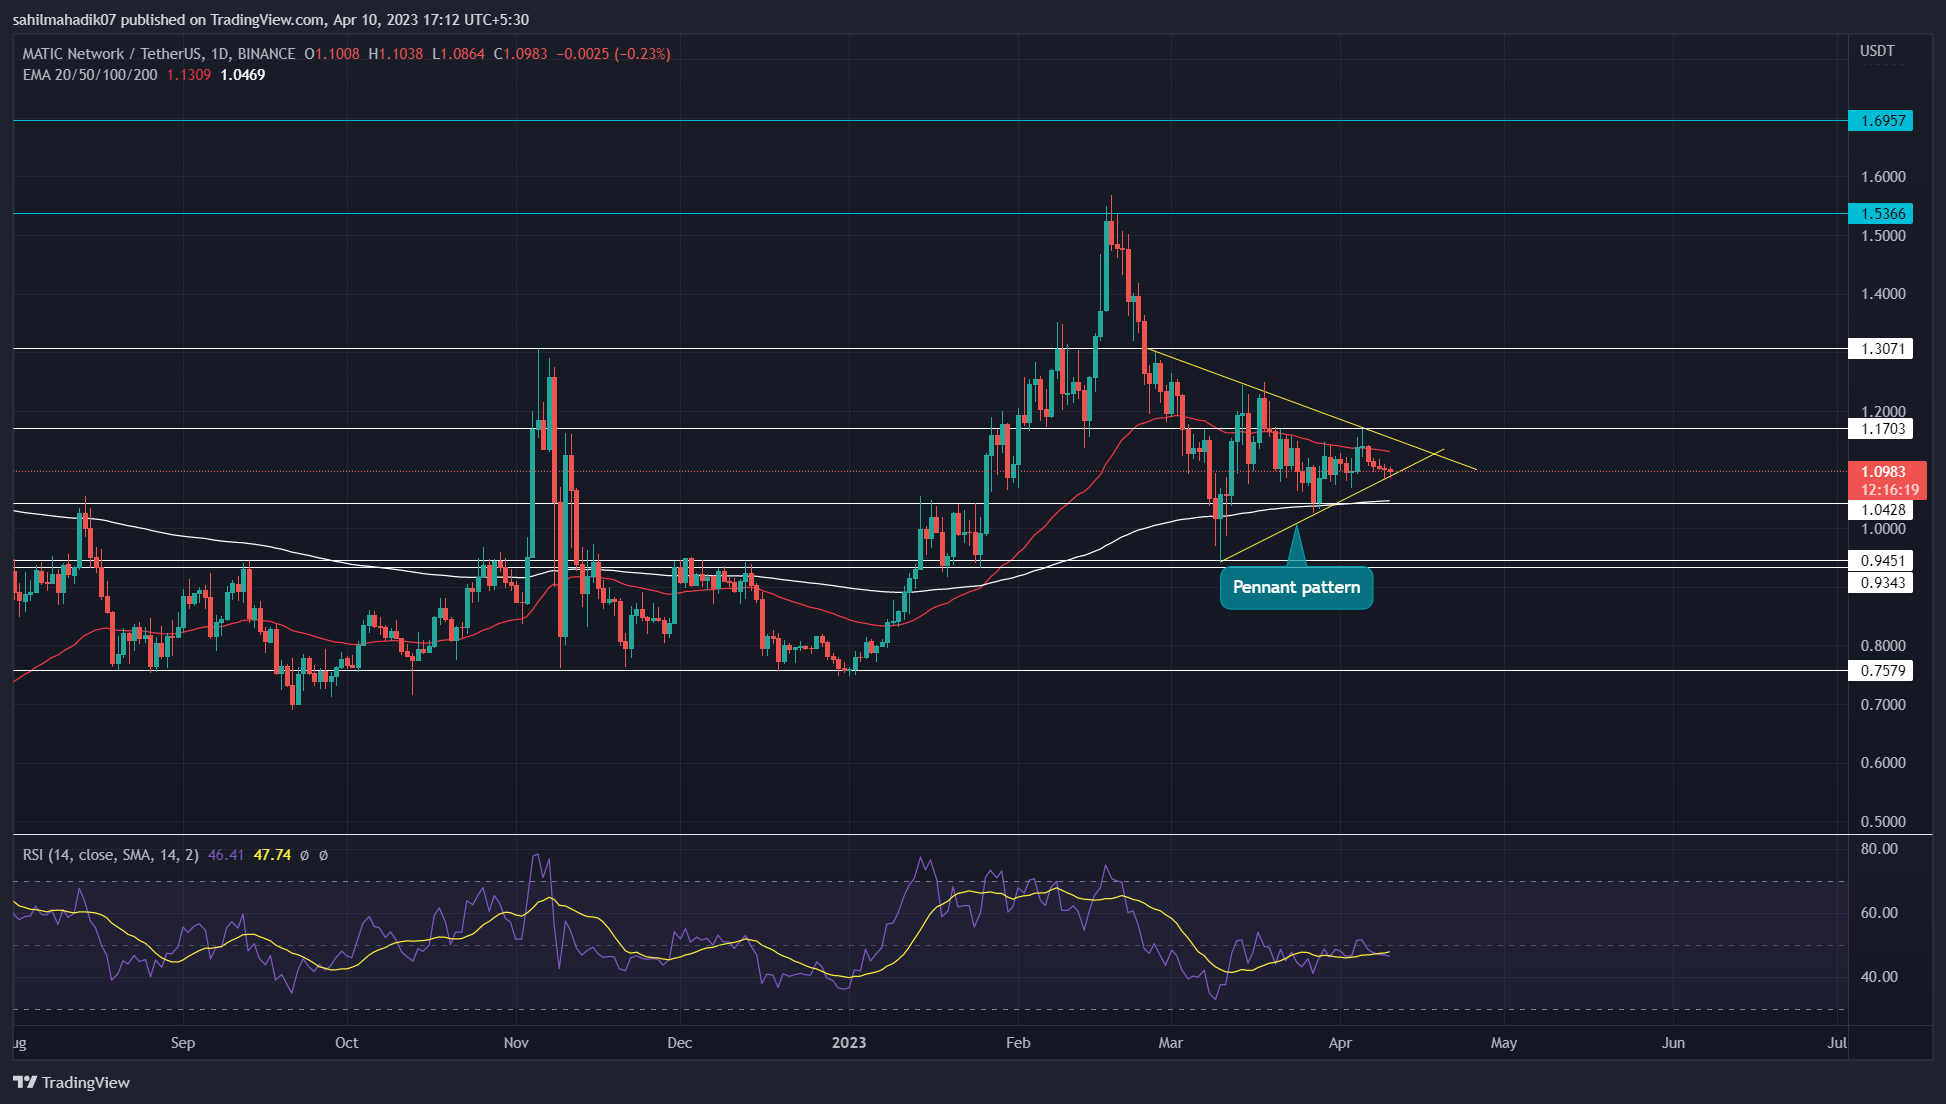
Source-Tradingview
Over the past six days, the MATIC price has been resonating within the two converging trendlines of the bearish pennant pattern. The prices have bounced back at least thrice from both the trendline indicating the traders are responding to this technical setup and would likely respect its potential target.
By the press time, the polygon coin price trades at $1.1 and is trying to sustain above the lower trendline. The daily chart showcasing candles with lower price rejections indicates the traders continue to witness buying pressure which may push the price higher.
Trending Stories
This bullish reversal will prolong the ongoing consolidation for a few more days before the price gives a breakout.
As the bearish pattern is a bearish continuation structure, the MATIC price is more likely to breach the lower support trendline. A daily candle closing below the mentioned trendline will offer a short-selling opportunity and may tumble the prices 15% down to hit $0.945 support.
On a contrary note, a bullish breakout from the overhead trendline will undermine the bearish thesis and signal an early sign for trend reversal.
Technical Indicators
Exponential Moving Average: the flattish daily EMAs(20, 50, 100, and 200) highlight an ongoing sideways trend.
Relative Strength Index: The daily RSI slope with the same high formation projects rising buying pressure within the consolidation phase and adds more confirmation upside trendline breakout.
MATIC Coin Price Intraday Levels
- Spot rate: $1.09
- Trend: Bearish
- Volatility: High
- Resistance levels- $1.17 and $1.3
- Support levels- $1.042 and $0.945
Share this article on:
advertisement
The presented content may include the personal opinion of the author and is subject to market condition. Do your market research before investing in cryptocurrencies. The author or the publication does not hold any responsibility for your personal financial loss.
<!– Close Story–>
- SEO Powered Content & PR Distribution. Get Amplified Today.
- Platoblockchain. Web3 Metaverse Intelligence. Knowledge Amplified. Access Here.
- Source: https://coingape.com/markets/matic-price-prediction-polygon-price-may-lose-1-if-this-bearish-pattern-set-off/

