Introduction
Ever wondered how the topography of your country influences economic and political development? Topographic maps – maps of the earth’s surface that use contour lines for visualization – can help answer these questions! We will use Python to create a topographic map for Nepal, a country with an interesting topographic environment. You will learn how to read geospatial data that describes the topography of a country, how to interpret this data, and how to visualize it. The resulting map can be combined with other data of interest at very disaggregated subnational levels to understand how the topography of a country influences its economic and/or political development. This blog post will teach you how to generate a really interesting tool that can inform policies and private sector development!
Learning Objectives
- Gain proficiency in data analysis techniques for digital elevation data.
- Learn how to use geospatial data and related analysis tools in Python.
- Acquire knowledge of mapping techniques.
- Develop skills in effective data visualization for communication.
- Understand the importance of elevation for inequality and poverty.
This article was published as a part of the Data Science Blogathon.
Table of contents
What are Topographic Maps?
Topographic maps are maps of the earth’s surface that use contour lines for visualization. Topographic maps are a valuable tool for navigating unfamiliar terrain and serve as urban planning and disaster management inputs. They are often used to understand the spatial context of policies or private sector projects around infrastructure development, to identify areas vulnerable to natural disasters or with limited access to essential services, such as education, healthcare, and infrastructure, or for natural resource management. Ultimately, these maps can serve as input for evidence-based decision-making. In this blog post, we will use Python to create a topographic map for Nepal, a country with a really interesting topographic environment.
Data Description
To generate our map, we will rely on data published by the United States Geological Survey (USGS). USGS is a scientific agency of the United States federal government that generates data and research around natural resources, geology, geography, water resources, and natural hazards. To get to their data page, type “USGS Data” in Google or click the link that directs you to their Earth Explorer. The Earth Explorer is an online tool and data portal that allows you to search, access, and download a wide range of Earth science data. You must set up an account and log in to fully use the data.
Data Download
This blog post will use Nepal as an example due to its unique topographic characteristics. Nepal has one of the most challenging and interesting topographies in the world. 8 out of the 14 mountains above 8,000 m are in Nepal (Trekking Trail Nepal), and the country is divided into three very different topographic regions: the Mountains, Hills, and Terai (or plains) (DHS). While these characteristics make the country unique and interesting, some research shows that the topography of Nepal makes it challenging to connect the country, deliver essential services to its population, and impose risks and barriers to a sustainable development path.
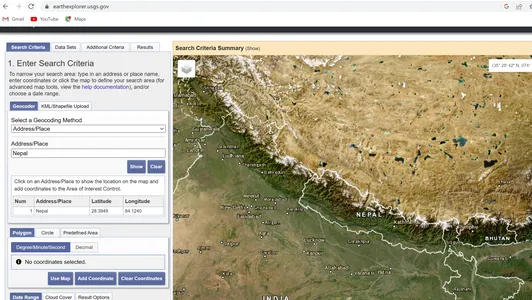
To this end, we will filter for Nepal in the Search Criteria, as indicated in the picture below. Once we selected Nepal, we selected our dataset of interest. To do so, click the Data Sets tab and choose Digital Elevation. There are several options for Digital Elevation Data, and while you could use several of these datasets, we will use the Global Multi-resolution Terrain Elevation Data 2010 GMTED2010 data. This data provides global coverage of the Earth’s terrain at multiple resolutions (ranging from 7.5 arc-seconds (approximately 250 meters) to 30 arc-seconds (approximately 1 kilometer)). It is generated from spaceborne and airborne remote sensing data, including satellite altimetry, stereo-imagery, and topographic maps.
Once you choose the data, click on the Results tab. You can now download the data by clicking the symbol with download options. You can also display the data via the footprint icon. We download the data in its highest resolution (7.5 arc seconds). Importantly, to cover all of Nepal, we need to download two different mosaics (parts) of the underlying data and combine them later. You will see that the resulting data set is in a tif format, which indicates raster data.

Python provides several tools for geospatial analysis. In this blog post, we rely on the Rasterio library that makes it possible to read and write geospatial raster data (gridded data). Let’s get started and read the first mosaic (part) of the data we previously downloaded into our Jupyter Notebook:
#import relevant libraries (after installing them)
import rasterio
import matplotlib.pyplot as plt
import numpy as np #Read the data and show the shape of the dataset
file = rasterio.open(r'path10n060e_20101117_gmted_mea075.tif')
dataset = file.read()
print(dataset.shape)
Let’s also upload the second mosaic and combine them by merging them. To this end, we follow standard raster data reading and manipulation techniques in Python as follows:
#Upload second dataset and show the shape of the dataset
file2 = rasterio.open(r'path30n060e_20101117_gmted_mea075.tif')
dataset2 = file2.read()
print(dataset2.shape) #Combine both datasets
from rasterio.merge import merge
from rasterio.plot import show #Create empty list
src_files_to_mosaic = [] #Append the list with both files
src_files_to_mosaic.append(file)
src_files_to_mosaic.append(file2)
src_files_to_mosaic #Merge both files
mosaic, out_trans = merge(src_files_to_mosaic) # Copy Metadata
output_meta = file.meta.copy() #Update Metadata
output_meta.update( {"driver": "GTiff", "height": mosaic.shape[1], "width": mosaic.shape[2], "transform": out_trans, }
) #Write to destination
# Write the mosaic raster to disk
out_fp = r"pathNepal_Mosaic.tif" with rasterio.open(out_fp, "w", **output_meta) as dest: dest.write(mosaic) #Open the combined raster data
file_mosaic = rasterio.open(out_fp) #Read the data
dataset_mosaic = file_mosaic.read()
print(file_mosaic.shape) #Show the data
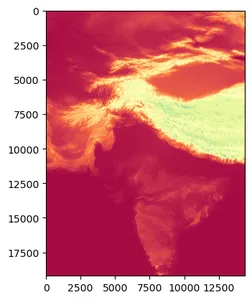
plt.imshow(dataset_mosaic[0], cmap='Spectral')
plt.show()
Global Multi-resolution Terrain Elevation Data
We now have a combined Global Multi-resolution Terrain Elevation Data 2010 GMTED2010 data for all of Nepal, but the file also covers large parts of the surrounding area that are not part of Nepal. Let’s restrict the area to Nepal by using a shapefile of Nepal. We will use a shapefile with country borders for the world. You can download this dataset here. Let’s then clip the raster data and shapefile using the mask function. We will only use the first row of the shapefile and the geometry column. The result of this operation is stored in clipped_array, which is the clipped raster data, and clipped_transform, which represents the transformation information of the clipped raster.
import geopandas as gpd
from shapely.geometry import mapping
from rasterio import mask as msk#import csv #Upload shapefile with country boarders of the world
df = gpd.read_file(r'path/world-administrative-boundaries.shp') #Restrict to Nepal
nepal = df.loc[df.name=="Nepal"]
nepal.head() #Clip data
clipped_array, clipped_transform = msk.mask(file_mosaic, [mapping(nepal.iloc[0].geometry)], crop=True) #
There is one remaining problem. The no data values in raster data are highly damaging. Therefore, would distort the visualization of our map, as these form part of the value range.
Understand the Problem
Let’s take care of this problem as follows, as described in this blog post:
- Let’s build a function that takes care of no data values. We construct a no-data parameter to specify the value considered “no data” in the clipped array. In this case, it’s set to (np.amax(clipped_array[0]) + 1), which means that it is equal to the maximum value in the clipped array plus one. This value will be considered as the “no data” value.
- Adjust the clipped array by adding the absolute value of the minimum value in the clipped array to the first band (index 0) of the clipped array. This step ensures that all values in the clipped array become non-negative.
- We also calculate the value range of the clipped array. It adds the maximum and absolute value of the minimum value in the clipped array. The value_range variable will hold the calculated value range.
- Use a manually constructed color-value dictionary based on an existing one (the seismic one) and define our background color for the “no data” values.
- In the last step, we plot the map with the new color range called new_seismic.
#Let's investigate no data values nodata_value = file_mosaic.nodata print("Nodata value:", nodata_value)
#Nodata value: -32768.0 #Change value of nodata to one more than the maximum elevation def clip_raster(gdf, img): clipped_array, clipped_transform = msk.mask(img, [mapping(gdf.iloc[0].geometry)], crop=True) clipped_array, clipped_transform = msk.mask(img, [mapping(gdf.iloc[0].geometry)], crop=True, nodata=(np.amax(clipped_array[0]) + 1)) clipped_array[0] = clipped_array[0] + abs(np.amin(clipped_array)) value_range = np.amax(clipped_array) + abs(np.amin(clipped_array)) return clipped_array, value_range nepal_topography, value_range = clip_raster(nepal, file_mosaic) #Check that this worked
print(value_range) #Let's give the nodata value a new background color
from matplotlib import cm
from matplotlib.colors import ListedColormap,LinearSegmentedColormap #Sesmic
new_seismic = cm.get_cmap('seismic', 8828) #Define background color
background_color = np.array([0.9882352941176471, 0.9647058823529412, 0.9607843137254902, 1.0]) #Use color map
newcolors = new_seismic(np.linspace(0, 1, 8828)) # Add the background color as the last row to the newcolors array.
newcolors = np.vstack((newcolors, background_color)) #Use new Italy Color Map
new_seismic = ListedColormap(newcolors) #Create final map and save
plt.figure(figsize=(10,10))
c = plt.imshow(nepal_topography[0], cmap = new_seismic)
clb = plt.colorbar(c, shrink=0.4)
clb.ax.set_title('Elevation (meters)',fontsize=10) plt.savefig(r'pathTopographic_Map_Nepal.png', bbox_inches='tight')
plt.show()
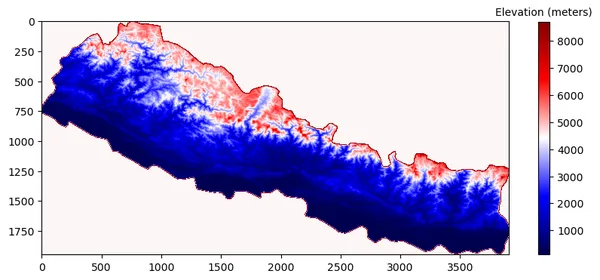
Voilá! We have a topographic map of Nepal that clearly indicates the different elevations in the country and the three topographic zones.
Conclusion
You learned to generate a topographic map in Python using geospatial data from the United States Geological Survey (USGS). You also learned the importance of taking care of missing values in the final dataset for visualization.
Policymakers or practitioners can now use this map for further analysis, such as combining it with other maps, such as maps of poverty, or natural disasters, to analyze if there is some connection. We have generated a valuable tool that can inform evidence-based decision-making in politics!
Key Takeaways
- Topographic Maps are useful tools for evidence-based decision-making.
- Topography and elevation play a crucial role in urban planning, service delivery, and inequality.
- Python has useful tools for analyzing geospatial data.
- Taking care of no data values in this type of data is crucial for visualization.
- Visualizing geospatial data can generate valuable information at disaggregated levels.
Hope you found this article informative. Feel free to reach out to me on LinkedIn. Let’s connect and work towards leveraging data for positive change.
Frequently Asked Questions
A. Topographic maps comprehensively represent a specific geographical region, providing precise information about natural and human elements. They depict the terrain’s characteristics, including mountains, valleys, and plains, using contour lines, which indicate points of equal elevation above sea level. Topographic maps offer a detailed record of the land’s features, enabling users to understand its shape and elevation accurately.
A. Topography aims to precisely locate various features and points on the Earth’s surface using a horizontal coordinate system like latitude, longitude, and altitude. It involves determining positions, naming identified features, and identifying common patterns of landforms. Topography seeks to understand and represent the spatial arrangement and characteristics of the Earth’s surface features.
A. Geospatial analysis in Python involves using Python programming language and specialized libraries to work with and analyze geospatial data. Geospatial data encompasses information about the Earth’s features and events, including geographical positions, spatial connections, and characteristics associated with these locations.
A. The GMTED2010 dataset benefits from the availability of higher-quality elevation data obtained from various sources, such as the Shuttle Radar Topography Mission (SRTM), Canadian elevation data, Spot 5 Reference3D data, and the Ice, Cloud, and land Elevation Satellite (ICESat). These new sources contribute to enhanced accuracy and coverage of global topographic data. GMTED2010 represents a significant advancement in global topographic data, facilitating various geospatial analyses and supporting many important applications.
The media shown in this article is not owned by Analytics Vidhya and is used at the Author’s discretion.
Related
- SEO Powered Content & PR Distribution. Get Amplified Today.
- PlatoData.Network Vertical Generative Ai. Empower Yourself. Access Here.
- PlatoAiStream. Web3 Intelligence. Knowledge Amplified. Access Here.
- PlatoESG. Automotive / EVs, Carbon, CleanTech, Energy, Environment, Solar, Waste Management. Access Here.
- BlockOffsets. Modernizing Environmental Offset Ownership. Access Here.
- Source: https://www.analyticsvidhya.com/blog/2023/08/building-a-topographic-map-of-nepal-using-python/


