Executive Summary
- Long-Term Holders have spend approximately 300k BTC since their supply peaked in Nov 2023. Just over half of these reflect GBTC outflow volumes.
- With the market trading at multi-year highs above $50k, the volume of supply held in loss is thinning out, reaching just 13% of the global total.
- The ETF sell-the-news correction in Jan-Feb has many characteristics of a classic ‘bull market correction’ through the lens of Short-Term Holders.
Thinning Supply
Bitcoin investors continue to enjoy a positive and strong year, with BTC market trading to new multi-year highs of $50.2k, and putting the YTD return at +18.5%. Only 141-days during 2021 have seen a daily closing price higher than $50.2k, representing just 2.84% of Bitcoin trading history.
Bitcoin is also up +130% over the last 12-months, and over +207% since the Nov 2022 lows, and is now trading just -28.6% below its ATH. With the market getting ever closer to the 2021 highs, the BTC supply which has a cost above this level is getting thinner and thinner.
This puts a super-majority of investors, and their held supply into profit, edging the market closer to yet another transitional phase, where Long-Term Holders start to take chips off the table.

The market saw a meaningful uptick in speculation in the lead up to the spot ETF approvals in January. In response, many Long-Term Holders (LTH) transacted their coins, whether to take profits, or perhaps to re-balanced their holdings into one of the new ETF products.
In total, LTH Supply balance has decreased by approximately 299.5k BTC since the metric peaked in November last year (at 14.996M BTC).
However, we must also consider the GBTC product, which saw over 661k BTC flow in during 2021, classifying its held supply as ‘Long-Term Holder’ status. Given GBTC has experienced around 151.5k BTC worth of outflows, this indicates that the remaining 148k BTC worth of LTH Supply can be attributed to LTH investors spending their coins. This aligns with our prior research showing that LTHs tend to commence distribution as the market approaches the ATH price.

Supply Discovery
As the market marches higher, a super majority of BTC has now moved into a profitable state. In fact, only 13% of the total supply were acquired above $48k and are therefore held in a state of loss.
The chart below presents a breakdown of the BTC supply by the cost basis at which it was acquired. We can see that the vast majority of coins (87%) were acquired below $48k, with a very large cluster of Short-Term Holder supply located between $40k and $45k. Long-Term Holders dominate this 13% of supply held in loss, reflecting ‘top buyers’ from the aformentioned 141 trading days in 2021.

We can see that the total volume of LTH Supply held in loss is currently 777.8k BTC, and is trending towards the zero bound as prices rise. Just 6.5% of the aggregate LTH supply is therefore held in loss.
Previous instances where the LTH cohort held a similar coin volume in loss corresponds with early bull market conditions (with 2019 as an arguable outlier).

Another way to visualise this is via the proportion of all supply held by LTHs in loss. At the bottom of bear markets, LTHs tend to carry the majority of unrealized losses, as speculators are flushed from the market, and the final capitulation results in a major transfer of coin ownership to high conviction holders.
By contrast, during the early phases of a bull market, this metric tends to reach consistently lower lows as the rising market rises and puts all LTH supply into profit. This metric appears to be following a similar pattern thus far, briefly falling below 60% during the recent correction to $38k.

Short-Term Reset
For the Short-Term Holder (STH) cohort, the ‘sell-the-news’ correction after the ETFs launched has resulted in a healthy reset of several metrics.
First, we can see that the percent of STH supply in profit fell from its peak at ~100%, to retest its all-time-average of 57.5%. This means that almost half of all STH supply experienced prices falling below their acquisition price, making for a healthy correction. Historically, this tends to correlate with local lows being established when the market is within a macro scale uptrend.
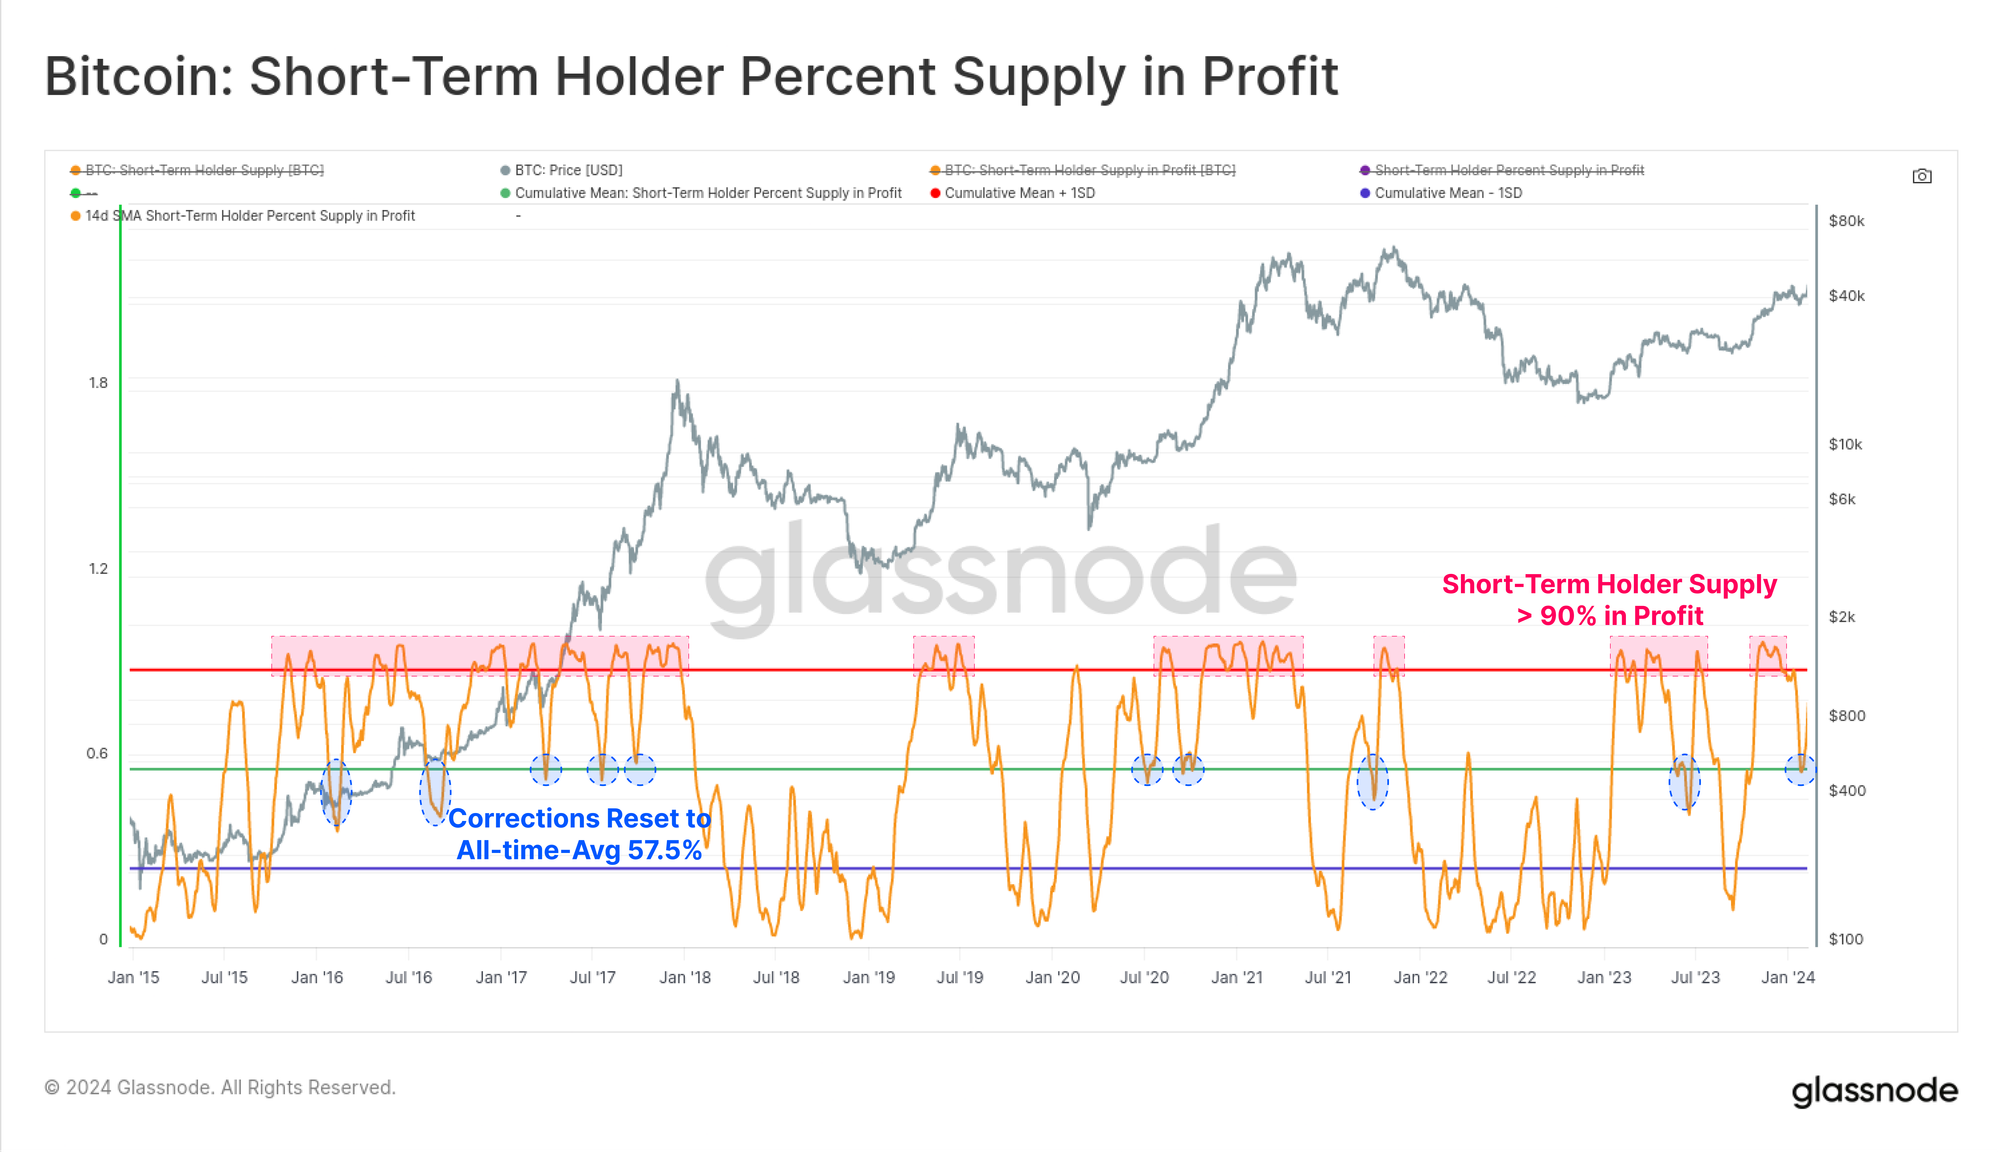
We can also see this within the next chart, which presents STH Supply broken into the volume held in profit (orange) vs loss (red). This helps us visualise and distinguish periods of heightened risk, from the more ‘garden variety’ corrections and pull-backs.
- Typical Correction Conditions – When STH Supply in Loss increases, but does not exceed ~60% of their holdings. This suggests some portion of new investors are trapped with an unfavourable cost basis, but they are balanced by many who acquired and still hold coins from lower prices.
- High Risk Conditions – When STH Supply in Loss increases dramatically, often to a super-majority of their total, it suggests a ‘top-heavy’ market. Many investors are now trapped with an unfavourable acquisition price.
By this metric, the ETF ‘sell-the-news’ correction appears to have more characteristics aligned with a ‘garden variety’ correction.

Finally, if we take a ratio between STH Supply in Profit/Loss, we can again identify a near text-book retest of the break-even level of 1 (50:50 Profit/Loss split). During robust and resilient uptrends, these points of balanced STH supply profitability tend to form support.
Analysts can keep an eye on any deep breaks below this level, and in particular points where it flips to resistance, suggesting higher risk conditions are in play.

Summary and Conclusions
Long-Term Bitcoin investors have been rewarded for their patience and conviction, with both 2023, and the year to date thus far being remarkably positive. Whilst BTC prices are still 28% below their ATH, the amount of supply held at a loss is thinning quickly, with just 13% falling into this category.
If we account for GBTC behaviour, Long-Term Holders have transacted around 148k BTC since November last year. This potentially alludes to a transition in investor behaviour, as some coins are spent and profit taking starts to ramp up.
Disclaimer: This report does not provide any investment advice. All data is provided for information and educational purposes only. No investment decision shall be based on the information provided here and you are solely responsible for your own investment decisions.
Exchange balances presented are derived from Glassnode’s comprehensive database of address labels, which are amassed through both officially published exchange information and proprietary clustering algorithms. While we strive to ensure the utmost accuracy in representing exchange balances, it is important to note that these figures might not always encapsulate the entirety of an exchange’s reserves, particularly when exchanges refrain from disclosing their official addresses. We urge users to exercise caution and discretion when utilizing these metrics. Glassnode shall not be held responsible for any discrepancies or potential inaccuracies. Please read our Transparency Notice when using exchange data.

- SEO Powered Content & PR Distribution. Get Amplified Today.
- PlatoData.Network Vertical Generative Ai. Empower Yourself. Access Here.
- PlatoAiStream. Web3 Intelligence. Knowledge Amplified. Access Here.
- PlatoESG. Carbon, CleanTech, Energy, Environment, Solar, Waste Management. Access Here.
- PlatoHealth. Biotech and Clinical Trials Intelligence. Access Here.
- Source: https://insights.glassnode.com/the-week-onchain-week-07-2024/

