Generation and characterisation of patient-specific hiPSCs and hiPSC-CMs
hiPSC lines were established from two TOF-DG patients, two TOF-ND patients, and two healthy controls with pluripotency markers and germ layer markers verified (Supplementary Figs. 1 and 2). Whole genome sequencing confirmed, respectively, the presence and the absence of 22q11.2 deletion in the hiPSC lines from TOF-DG and TOF-ND patients (Supplementary Fig. 3). No missense or nonsense mutations of previously reported CHD-related genes were found from any of the hiPSC lines. Cardiac differentiation was accomplished through the APLNR+ sorting protocol developed by our laboratory32. All hiPSC lines showed satisfactory differentiation efficiency with over 70% TNNT2+ cells. On day 12 post-differentiation, hiPSC-CMs were fabricated into hCAS and allowed to mature for another 10 days before transcriptomic and functional assessments.
TOF-DG patient-specific hiPSC-CMs exhibit defective ventricular specification
We first determined the transcriptomic profile of differentiated hiPSC-CMs from patients and controls by scRNA-seq using the 10X Genomics platform. Clustering of 21,965 cells using Uniform Manifold Approximation and Projection (UMAP) identified 7 distinct Seurat clusters (Fig. 1A). Seurat clusters A0, A1, A2, A5 expressed relatively higher levels of cardiac genes including NKX2-5, myosin light/heavy chain, and troponin (Fig. 1B), which identified these clusters as cardiomyocytes. Cluster A5 expressed also higher levels of mitotic genes, suggesting the proliferative nature of the cardiomyocytes. Clusters A3 and A4 expressed relatively lower levels of cardiac genes (NKX2-5, TNNT2) but enriched in the expression of genes related to extracellular matrix (ECM) remodelling (Fig. 1B), the profile of which is compatible with cardiac fibroblasts. Clusters A6 and A7 were defined by endodermal lineage (AFP, APOA1, APOA2) and endothelial (FLT1, ESAM, PLVAP) markers, respectively (Fig. 1B). Hence, among the sequenced cells, the majority were cardiomyocytes (86%), some were cardiac fibroblasts (10%), and very few were endodermal (<1%) and endothelial derivatives (<1%).
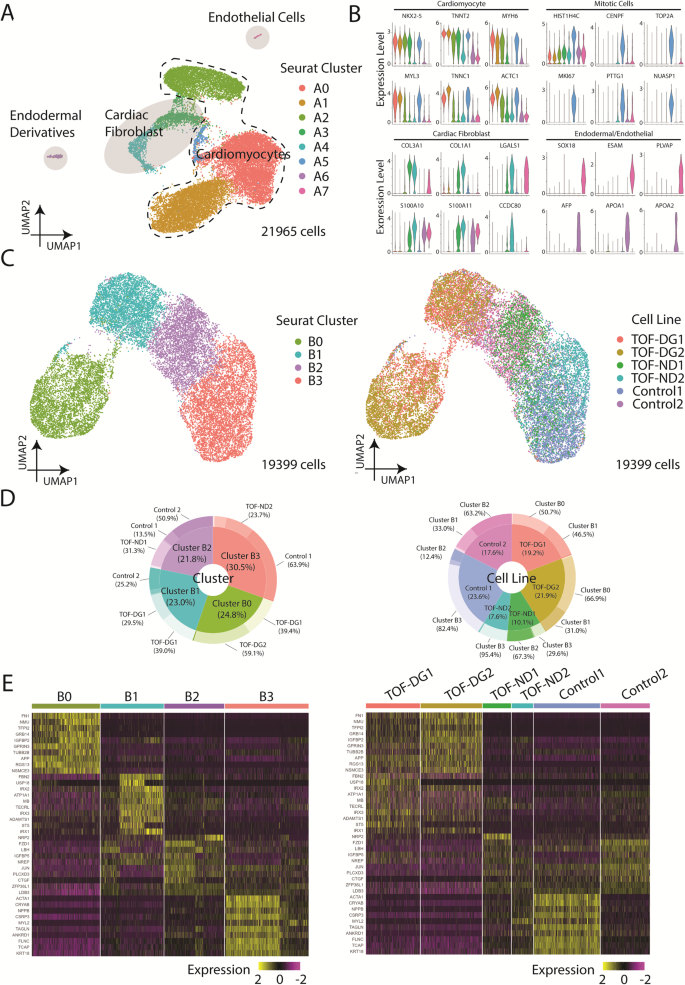
A UMAP presentation of all the cell types identified in hCAS (TOF-DG, TOF-ND and control). Colouring: Seurat clusters; dashed line: cardiomyocytes; light grey: non-myocytes. B Violin plots of gene expressions of cardiomyocytes, mitotic cells and non-myocytes: cardiac fibroblast, endodermal derivatives and endothelial cells. Colouring: Seurat cell clusters as in (A). C UMAP presentations of all the hiPSC-CMs identified in hCAS (TOF-DG, TOF-ND and control). Data were coloured by Seurat clusters (left panel) and cell line (right panel), respectively. D Donut plots of the compositions in each Seurat cluster (left panel) and cell line (right panel), respectively. Data were calculated from hiPSC-CMs only. E Heatmap presentations of the top 10 upregulated genes expressed in each hiPSC-CMs-Seurat cluster. Data were grouped by Seurat cluster (left panel) and cell line (right panel), respectively.
With a focus on examining the cardiac transcriptome, we isolated hiPSC-CMs (clusters A0, A1, A2, A5) and performed clustering using UMAP (Fig. 1C). New Seurat clusters (B0, B1, B2, B3) were identified (Fig. 1C). hiPSC-CMs derived from patients and controls were unevenly distributed among clusters (Fig. 1D). Cluster B0 consisted of hiPSC-CMs almost exclusively (98%) derived from TOF-DG patients, cluster B1 consisted of cells mainly from a control subject and the remaining cells from TOF-DG patients, while clusters B2 and B3 consisted of hiPSC-CMs derived from TOF-ND patients and controls.
Cluster B0 was found to have upregulated expression of non-myocyte genes, with 4 out of 10 top upregulated genes being rarely (<1%) found in other clusters (Fig. 1E). These non-myocyte genes were non-endodermal or endothelial-related. The absence of enrichment in genes related to extracellular matrix remodelling also distinguished cluster B0 cells from cardiac fibroblast. Cluster B1 was enriched in the IRX gene family (IRX1, IRX2, IRX3), while cluster B2 was marked by LBH expression (Fig. 1E). The orthologs of IRX genes and LBH have been reported to be expressed in early in vivo differentiated murine cardiomyocytes33,34. Cluster B2, when compared with cluster B1, had upregulated expression of ventricular cardiomyocyte markers (MYH7, NPPB). Cluster B3 showed the highest expression of ventricular cardiomyocyte marker (MYL2) (Fig. 1E). The existence of clusters B1, B2 and B3 suggested progressive specification of hiPSC-CMs towards a ventricular transcriptomic profile.
To further investigate the transcriptomic changes during ventricular specification, we performed pseudotime analysis on clusters B1, B2 and B3. Based on the enrichment in the IRX genes family, cluster B1 was manually selected as the root node for the pseudotime analysis (Fig. 2A). Along the trajectory, TOF-DG-hiPSC-CMs were mainly distributed in the beginning, whereas TOF-ND-hiPSC-CMs were mainly distributed in the middle to the end. Control-hiPSC-CMs could be found throughout the trajectory (Fig. 2A).
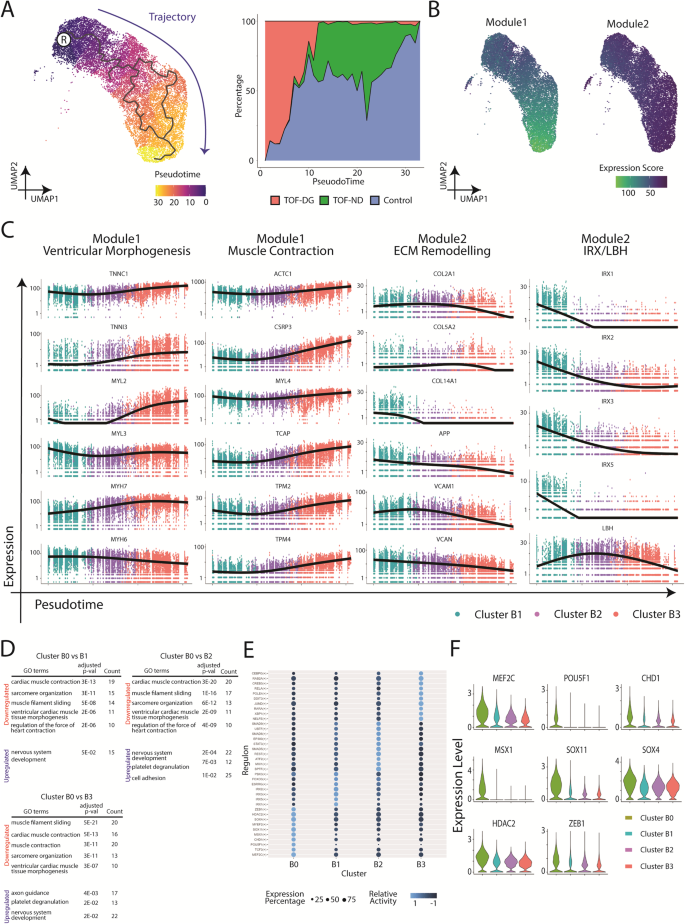
A Pseudotime analysis of hCAS-hiPSC-CMs. UMAP coordination and gene expressions of cluster B1, B2 and B3 (Fig. 1C) were extrapolated for Monocle3 calculation. Root node was denoted with ®. Trajectory was coloured in blue. B Gene modules serve as the function of the pseudotime analysis and trajectory inference of hCAS-hiPSC-CMs. C Gene expression dynamics along the trajectory. Ventricular morphogenesis, muscle contraction and ECM remodelling were the GO terms enriched in the gene modules. X-axis: Pseudotime ; Y-axis: Expression Level. ECM extracellular matrix. D GO enrichment analysis of cluster B0 from hCAS-hiPSC-CMs. GO terms found to be enriched in the downregulated/upregulated genes from cluster B0 (compared against cluster B1/B2/B3) were shown. P-values were adjusted for Bonferroni multiple comparisons. E Regulon analysis of hCAS-hiPSC-CMs. The top regulons (at most 10) with higher relative activity in each Seurat cluster were shown in the dot-heatmap plot. F Gene expression of the top regulons (identified as DEGs) from cluster B0. Gene expressions were shown in the violin plot.
Genes with similar expression patterns were grouped into modules (Fig. 2B) and subjected to Gene Ontology (GO) enrichment analysis. Significant GO terms were found in both Module 1 and 2 (Fig. 2C). Module 1, showing high expression scores along the trajectory, was enriched in genes related to ventricular morphogenesis (TNNI3, MYL2, MYH7) and muscle contraction (ACTC1, CSRP3, TCAP). Module 2, showing decreasing expression scores along the trajectory, was enriched in genes related to extracellular matrix remodelling (COL2A1, COL5A2, COL14A1). The IRX genes family and LBH were also assigned to module 2, showing decreasing expression scores along the trajectory.
In sum, pseudotime analysis on hiPSC-CMs derived from the hCAS platform identified progressive ventricular specification with increased cardiac gene expression. Control- and TOF-ND-hiPSC-CMs were comparable in such progressive specifications. However, most of the TOF-DG-hiPSC-CMs retained the more primitive expression profile.
A subset of TOF-DG patient-specific hiPSC-CMs showed downregulation of cardiac gene expression but upregulation of neural gene expression
To further analyse the non-myocyte gene expression in cluster B0, differentially expressed genes (DEGs) were identified by comparing cluster B0 to each of the other clusters. More than 200 DEGs, upregulated or downregulated, were identified from cluster B0 (Supplementary Data 1). GO enrichment analysis consistently identified significant GO terms related to cardiac muscle contraction among downregulated genes and those related to neural development among upregulated genes in cluster B0 (Fig. 2D). Therefore, cluster B0 differed from the rest of the clusters by downregulated cardiac gene expression as well as upregulated neural gene expression. Yet, none of the above DEGs, including downregulated cardiac genes and upregulated neural genes, could be mapped to the haploinsufficient region in both TOF-DG hiPSC lines.
We further attempted to identify the corresponding transcription factors (TFs) and gene-regulatory networks from each of the clusters through Python implementation of the Single-Cell rEgulatory Network Inference and Clustering (pySCENIC). Among the top 10 TFs with higher activity in cluster B0, 4 were involved in neural development (TCF3, SOX11, SOX4 and ZEB1) and 2 in cardiac and neural development (MEF2C and MYEF2) (Fig. 2E). The expression levels of five neural TFs (SOX11, SOX4, ZEB1, MEF2C and MYEF2) were upregulated in cluster B0 compared with those in other clusters (Fig. 2F). The finding of upregulated expression of these neural TFs was consistent with increased expression of neural genes in cluster B0. Similar to the DEGs, the above neural TFs were not mapped to the haploinsufficient region in both TOF-DG cell lines.
Therefore, a significant portion of hiPSC-CMs from TOF-DG (cluster B0) showed downregulation of cardiac genes and upregulation of ectopic neural genes. Failure to map the DEGs and TFs in cluster B0 to the 22q11.2 region suggested that this transcriptomic signature is probably an indirect consequence of the haploinsufficiency. Unlike the hiPSC-CMs from the control and the TOF-ND groups, which showed a continuum in the ventricular specification, cluster B0 formed a distinct cluster from the rest of the hiPSC-CMs from TOF-DG (cluster B1). The origin of cluster B0 was further explored as described below.
Bifurcated cardiac differentiation of TOF-DG cardiac progenitors
To understand the emergence of TOF-DG-cluster B0, we examined the transcriptomic profile of in vitro cardiac progenitors. Based on our previous study32, second heart field (SHF) gene expression peaked on post-differentiation Day (D) 7 and 8. We therefore performed scRNA-seq on hiPSC-cardiac progenitors (hiPSC-CPs) on D7 and D8 and immature hiPSC-CMs on D11 from 2 controls (Control 1 and 2) and 2 TOF- DG (TOF-DG1 and 2) and 1 TOF-ND (TOF-ND1) patients (Fig. 3A, B). In total, 87834 cells were retained after excluding less than 1% of endodermal derivatives and endothelial cells. Pseudotime and GO enrichment analysis identified upregulation in cardiac gene expression and downregulation in transcription and translation and cell cycle activity along the trajectory (Supplementary Fig. 4A–D). Similar to our previous study32, SHF gene expressions, including ISL1, MEF2C, HAND2 and FGF10, were found in the sequenced time points (Fig. 3C). TBX1, one of the genes within the 22q11.2 microdeletion region, is also a marker of SHF. Among the sequenced time points, TBX1 expression was found on Day7, with a variable proportion of TBX1+ hiPSC-CPs (10–30%) found from different lines (Fig. 3D). However, the TBX1 expression level was comparable between the D7-TBX1+ hiPSC-CPs from different lines (Fig. 3D).
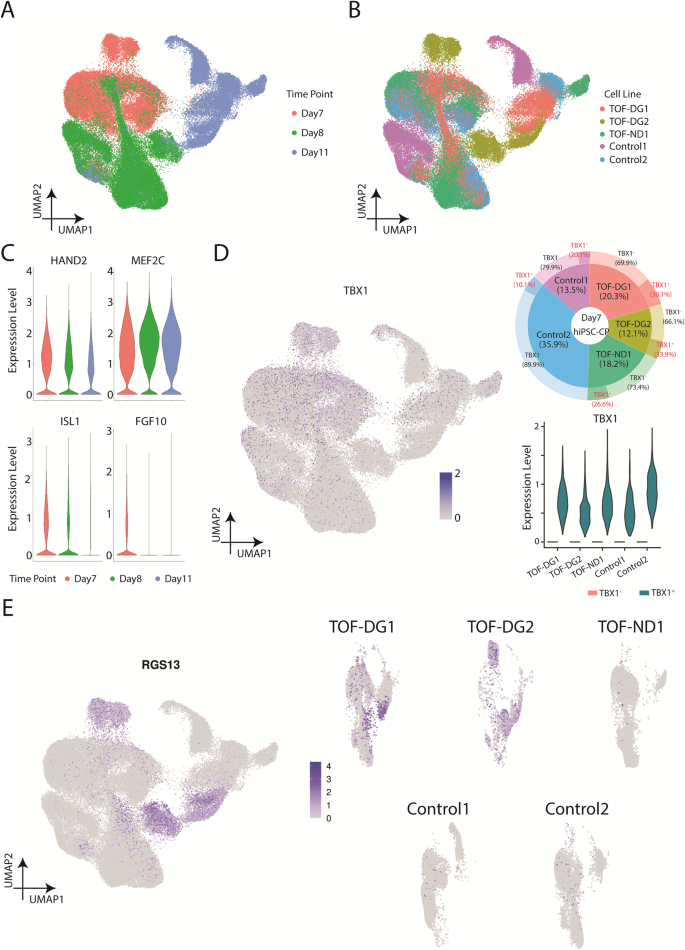
A UMAP presentations of all the hiPSC-CPs and hiPSC-CMs (TOF-DG, TOF-ND and control). Data were coloured by sequenced time point. B UMAP presentations of all the hiPSC-CPs and hiPSC-CMs (TOF-DG, TOF-ND and control). Data were coloured by cell line. C Violin plots of SHF gene expression, including ISL1, MEF2C, HAND2 and FGF10. D TBX1 expression in hiPSC-CPs. TBX1 expression on Day7/8/11 in vitro cardiac differentiation was shown in the UMAP plot. Highest TBX1 expression was found in D7-hiPSC-CPs, and the proportion of the TBX1+ was shown in donut plot and marked with a red label. TBX1 expression in TBX1+ D7-hiPSC-CPs was shown in violin plot. E UMAP plots of RGS13 expression on Day7/8/11 in vitro cardiac differentiation. RGS13 expression were presented with all the cell lines together (left panel) and split into every individual cell line (right panel).
Time-matched comparison with controls only identified 20, 10 and 22 DEGs from D7-, D8- and D11-TOF-DG-hiPSC-CP/CMs with no significant GO terms found. None of these DEGs were mapped to the 22q11.2 microdeletion regions in the two TOF-DG-hiPSC lines. Ectopic gene expressions from TOF-DG-cluster B0 were then examined in the hiPSC-CPs and immature hiPSC-CMs. Unlike TOF-DG-cluster B0 (differentiated hiPSC-CMs), neural-related genes were not found in TOF-DG-hiPSC- CPs (D7 and D8) and D11-immature hiPSC-CMs. On the other hand, a subset of cells marked by RGS13 expression, 1 of the top 10 upregulated genes in TOF-DG-cluster B0 (Fig. 1E), was consistently found in TOF-DG derived cells in all the sequenced time points (D7, D8 and D11) (Fig. 3E), but not in TOF-ND1 and the control groups.
Ectopic gene expression has been recently reported in the progenitors from Tbx1 conditional null (Tbx1-cKO) mouse35. To compare our hiPSC-CP and immature hiPSC-CM data with the Tbx1-cKO mouse, we made a cross-species comparison with R package SingleCellNet36. Fourteen clusters were identified from the Tbx1-cKO mouse dataset (Supplementary Fig. 5A) with gene expression reported in the publication35 (Supplementary Fig. 5B), including four different cardiac progenitors (multilineage progenitor, MLP; anterior SHF, aSHF; posterior SHF, pSHF and proepicardium; PEO) and cardiomyocytes. Our D7-hiPSC-CPs were mostly similar to aSHF whereas D11-hiPSC-immature cardiomyocytes were mostly similar to cardiomyocytes (Supplementary Fig. 5C). In the Tbx1-cKO mouse dataset, Pax8, the major ectopic gene reported by Nomaru et al.35, was exclusively found in MLP and lung progenitors but not in aSHF and cardiomyocytes (Supplementary Fig. 5D). We did not identify PAX8 expression in our D7-D11 dataset. Also, RGS13, the ectopic gene found in our D7-D11 dataset, was not identified in the Tbx1-cKO mouse. In other words, while ectopic gene expression was found in both Tbx1-cKO mouse and our DG-hiPSC-CPs/CMs, the identity of and the population expressing the ectopic gene are different.
Altered electrophysiological parameters and increased arrhythmogenicity in TOF-DG-hiPSC-CMs
In addition to transcriptomic profiling, we explored the electrophysiology and arrhythmogenicity of the differentiated hiPSC-CMs using our hCAS platform to provide a more comprehensive assessment of the hiPSC-CMs. Electrophysiological parameters, including action potential (AP), calcium handling and effective refractory period (ERP), were measured under electrical pacing at 1 Hz.
Compared with both controls, TOF-DG2-hCAS showed significant shortening of AP duration (50 and 90% to repolarization, APD50 and APD90) (Fig. 4A). Similarly, when compared with both controls, TOF-DG2-hCAS showed significant shortening of AP upstroke time and time to decay (50 and 90% from peaks) (Fig. 4A). Hence, the AP characteristics differed significantly between TOF-DG2 and controls.

A Dotplots of action potential (AP) characteristic. APD action potential duration. B Dotplots of calcium transient (CaT) characteristic. C Dotplot of the effective refractory period. Data were presented in mean ± SD for Fig. 1A–C. Statistical test: Ordinary one-way ANOVA followed by Tukey’s multiple comparisons test (APD50, AP90%Decay, CaT 50%Decay, CaT Upstroke and effective refractory period); Kruskal–Wallis test followed by Dunn’s multiple comparison test (APD90, AP upstroke, AP50%Decay and CaT 90%Decay). Significant findings between TOF(DG/ND) and control were marked by asterisks. * P < 0.05; ** P < 0.01; *** P < 0.001; **** P < 0.0001. D Percentage of arrhythmic re-entry event of TOF (DG/ND) and control hCAS during steady-state pacing (SteadyState) and programmed electrical stimulation (PES). Statistical test: Fisher’s exact test. *** P < 0.001. E Representative action potential (AP) tracing and isochrone map of re-entry event during PES from TOF-DG2. The upper panel showed the representative AP tracing during PES (S1S2) followed by the incidence of arrhythmic re-entry event. The lower panel showed two isochrone maps which correspond to a normal AP (left) and an arrhythmic AP (right). F Cardiac gene downregulation in cluster B0-TOF-DG2. GO enrichment analysis was performed on the comparison between cluster B0-TOF-DG2 and cluster B0-TOF-DG1. GO terms enriched in the downregulated genes are shown in the table (left), and the corresponding genes are shown in the violin plot (right).
Calcium handling was assessed with calcium transient (CaT) upstroke time and time to decay (50 and 90% from the peak). Significant shortening of CaT upstroke time was found in TOF-DG2-hCAS, whereas significant shortening of time to decay (50% from the peak) was found in both TOF-DG2-hCAS and TOF-ND1-hCAS when compared with both controls (Fig. 4B).
We further assessed the ERP of the hiPSC-CMs, the shortening of which predisposes to the development of cardiac arrhythmias. Significant shortening of EPR was found in TOF-DG2-hCAS, while prolongation of ERP was found in TOF-ND2-hCAS (Fig. 4C). Importantly, TOF-DG2-hCAS showed a significantly higher incidence of re-entry arrhythmia during programmed electrical pacing (PES) (Fig. 4D). A representative AP tracing with the isochrone map of re-entry arrhythmia from TOF-DG2-hCAS is shown in Fig. 4E.
Whereas TOF-DG2-hCAS showed significant shortening of AP duration, CaT upstroke time and time to decay, and ERP, TOF-DG1-hCAS was similar to controls in terms of these electrophysiological parameters assessed (Fig. 4A–D). We therefore further explored the transcriptomic differences between TOF-DG1 and TOF-DG2 in cluster B0. Compared with cluster B0-TOF-DG1, cluster B0-TOF-DG2 showed downregulation of cardiac genes related to muscle contraction (Fig. 4F). While these cardiac genes were downregulated in both cluster B0-TOF-DG1 and cluster B0-TOF- DG2 when compared with other clusters (B1, B2 and B3) (Fig. 4F), their extent of downregulation was more prominent in cluster B0-TOF-DG2 (Fig. 4F). Furthermore, PKP2, its mutation being reported to be associated with arrhythmogenic RV dysplasia37, was found to be among the downregulated cardiac genes in cluster B0-TOF-DG2 (Fig. 4F). The varying extent of downregulation of cardiac genes may hence account for the functional discrepancy observed among cell lines from different patients in the hCAS platform.
- SEO Powered Content & PR Distribution. Get Amplified Today.
- PlatoData.Network Vertical Generative Ai. Empower Yourself. Access Here.
- PlatoAiStream. Web3 Intelligence. Knowledge Amplified. Access Here.
- PlatoESG. Carbon, CleanTech, Energy, Environment, Solar, Waste Management. Access Here.
- PlatoHealth. Biotech and Clinical Trials Intelligence. Access Here.
- Source: https://www.nature.com/articles/s42003-023-05344-6

