In this series of blog posts, we have been talking about Jane who is in the role of inventory planner at her company. Kate, who is a consultant, has been helping Jane with the concepts of safety stocks.
Catch up on the first 9parts of the series: part 1, part 2, part 3, part 4, part 5, part 6, part 7, part 8 and part 9.
Kate said, “Now that you have seen the example of using the variability in demand and lead time to calculate the safety stocks, let us look at another kind of variability, the one related to the supply quantity.
“How do you mean?”, asked Jane.
Kate: Well, when you order product from your supplier, do you always get the amount that you ordered?
Jane: Well, sometimes they are short a few. Once in a blue moon, some suppliers will ship more than what was ordered but that is rare.
Kate: That is understandable. How about quality? Do you perform quality checks upon arrival of the shipment from the supplier and do you find any quality issues?
Jane: Yes, we plan for at least 98% good quality product supply. Sometimes the supply exceeds that quality goal, and sometimes we are short of that goal.
Kate: And how about production: Are you able to get exactly what you need from the plant?
Jane: Well, we assume that our factories will have a certain yield, typically in the 95% range. But sometimes, they run higher or lower than that.
Kate: So, in all these situations, what you expect to receive as a supply quantity may be different from what you actually receive, correct? Or would you agree with that?
Jane: No, what we receive can be sometimes higher and sometimes lower than what we ordered. I agree with that.
Kate: So, similar to the lead time, this creates a variability in your supply. Depending on how bad this is, one would account for this variability in the safety stock calculation.
Kate continued: Do you remember that variances of independent quantities can be added. Well, this variability in supply quantity is independent of the variability in demand and lead time. Therefore, it can be added to the variances of those two quantities.
Jane said: True, but the units must also match, right?
“Very good memory, Jane”, Kate said with a smile. “Alright, so let us look at this. What is the amount you ordered for the product we have been looking at?”
Jane responded, “We always ordered 100,000 units of that product.”
Kate nodded and said, “Suppose you always order 100,000 units of a product but receive different amounts against each order from the supplier. Let us make up some numbers to reflect this.
Kate opened a spreadsheet on her machine and typed up some numbers:
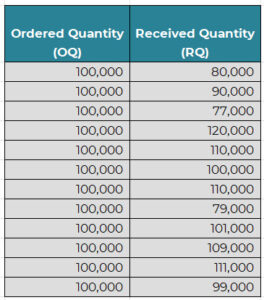
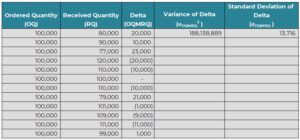
“Now, with this data, we can calculate the delta between the two quantities and calculate the variance of this delta, can’t we?”, asked Kate.
Then she proceeded with the calculations as Jane nodded.
“So, this variance is for each order and applies to each order independently. Now, how many orders will we have during the lead time? That will be equal to the Demand During Lead Time (DDLT) divided by the average order quantity, which in our example is 100,000”, said Kate.
“And DDLT is equal to the Average Daily Demand * Average Lead Time?”, asked Jane.
Kate said, “Very good. Do you remember the value we calculated earlier?”
Jane said, “Yes. The average daily demand was 17,767 and the average lead time was about 12. Well, 11.73 to be precise. So, that gives us DDLT = 17,767*11.73 = 208,415. And the number of orders during lead time = 208,415/100,000 = 2.08.”
Kate asked: Is this a reasonable number? Do you order roughly twice every 12 days?
Jane responded: I would have guessed once a week, so that is close.
Kate said, “Great. So, this variance applies independently to all orders during the lead time. Since there are 2.08 orders on average during the lead time, the total variance would be 2.08*188,138,889 = 392,109,429.
Jane said, “Interesting. So, now this should be added to the earlier calculated variances?”.
Kate said, “Indeed. Would you do the honors?”
Jane wrote on the whiteboard:
- Demand Variance = 4,074,243,350
- Variance in demand because of variance in lead time = 499,155,026
- Variance in demand because of variance in supply quantity = 392,109,429
- Total Variance, σDDLT2 = 4,965,507,806.
Kate nodded in agreement and said, “Why don’t you go ahead and calculate the standard deviation from this and the resulting safety stock for a 95% service level. Do you remember the z-multiplier for 95%?”
“I do not remember it, but I sure can look it up from my notes”, said Jane as she flipped through her notebook. Then she wrote on the whiteboard.
Standard Deviation = Square root of Variance = Square root of 4,965,507,806 = 70,466 = σDDLT.
And Safety stock = z * σDDLT = 1.96 * 70,466 = 138,114.
Bravo! Kate exclaimed. “Looks like you have mastered this formula and are ready to calculate safety stocks for your business.”
We will continue the conversation in the next blog.

- SEO Powered Content & PR Distribution. Get Amplified Today.
- PlatoData.Network Vertical Generative Ai. Empower Yourself. Access Here.
- PlatoAiStream. Web3 Intelligence. Knowledge Amplified. Access Here.
- PlatoESG. Carbon, CleanTech, Energy, Environment, Solar, Waste Management. Access Here.
- PlatoHealth. Biotech and Clinical Trials Intelligence. Access Here.
- Source: https://blog.arkieva.com/a-journey-through-safety-stocks-part-10/?utm_source=rss&utm_medium=rss&utm_campaign=a-journey-through-safety-stocks-part-10

