Sign up for daily news updates from CleanTechnica on email. Or follow us on Google News!
We recently produced several exclusive reports on US electric vehicle sales and overall US auto industry sales trends. Via those reports, you can explore the top automakers or auto brands in terms of their own internal EV share or in terms of their share of the overall EV market, or you can explore growth of the US EV market as a whole, or you can explore trends in auto brand sales broadly, or you can look at trends in EV market share, or you can look at model-by-model EV sales growth. There are a lot of fun ways to cut the pie and see what’s been going on. One thing that stands out in these reports compared to any others you might find on the internet on any of these topics is that I go back to 2019 to tease out the comparisons and trends over time.
However, one thing I’ve never really done is narrow down and highlight changes in the EV market compared to changes in the ICEV market. (To be specific, I’m referring to the fully electric, or BEV, market here.) Since I’d already collected all of the core data from automakers over the years, plus a little bit of estimating for brands that lag behind the rest in the data they report (Tesla included), this wasn’t a huge challenge — it just required creating a few more rows in my Google Sheet and generating a few more charts. However, I had not thought to do it until requested to by “Cypress” under a recent article. What a great suggestion! Why didn’t I think of that?
Well, let’s just get to the charts and numbers.
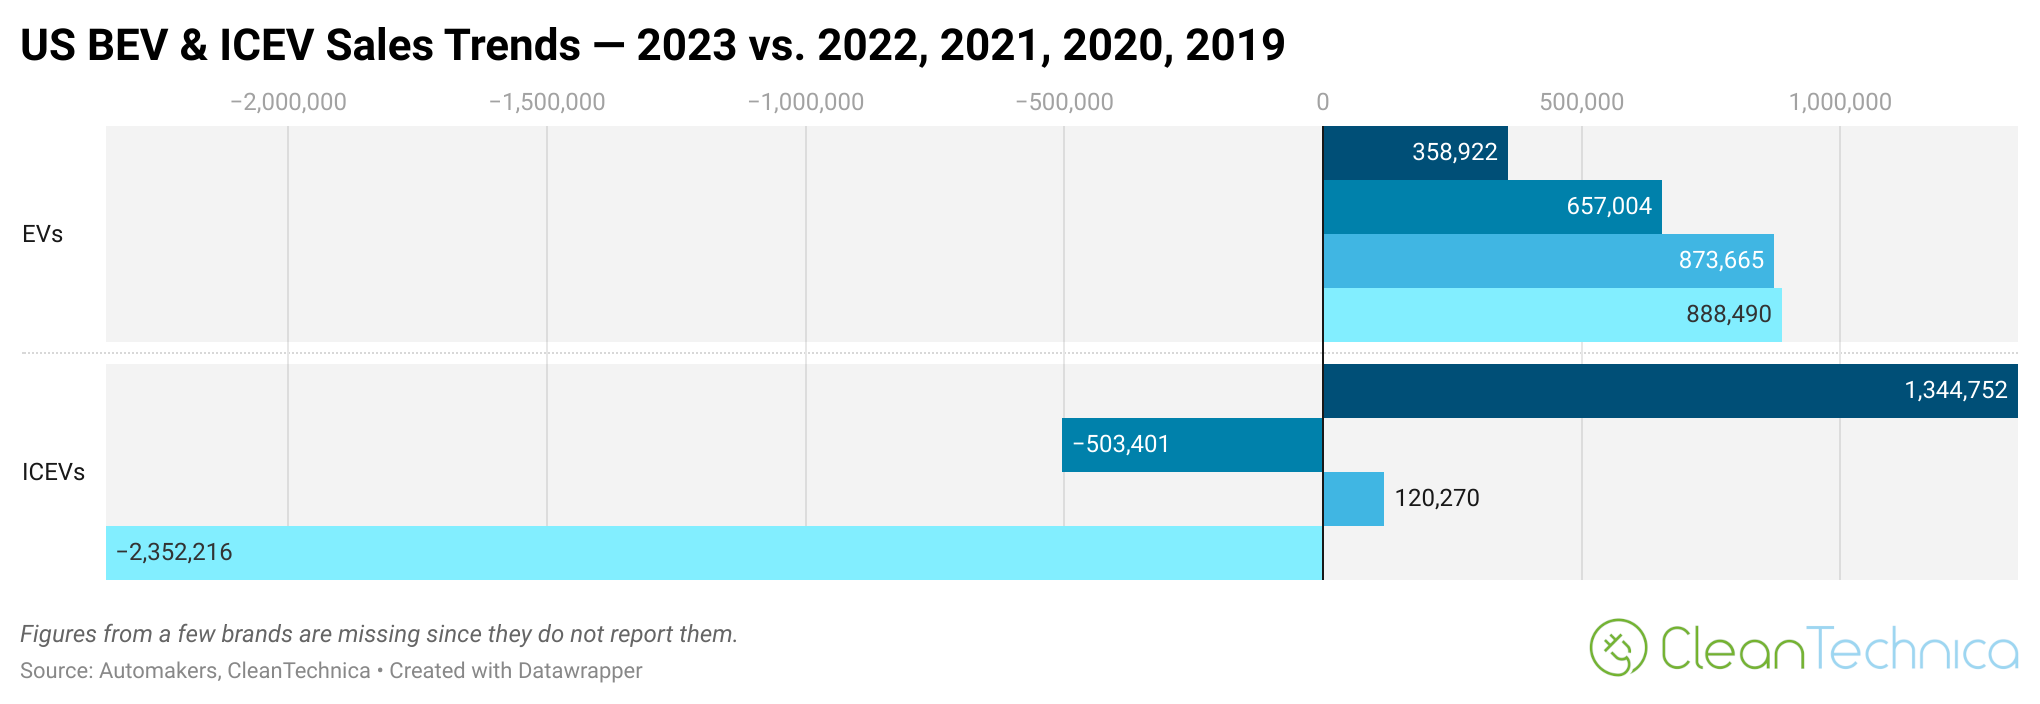
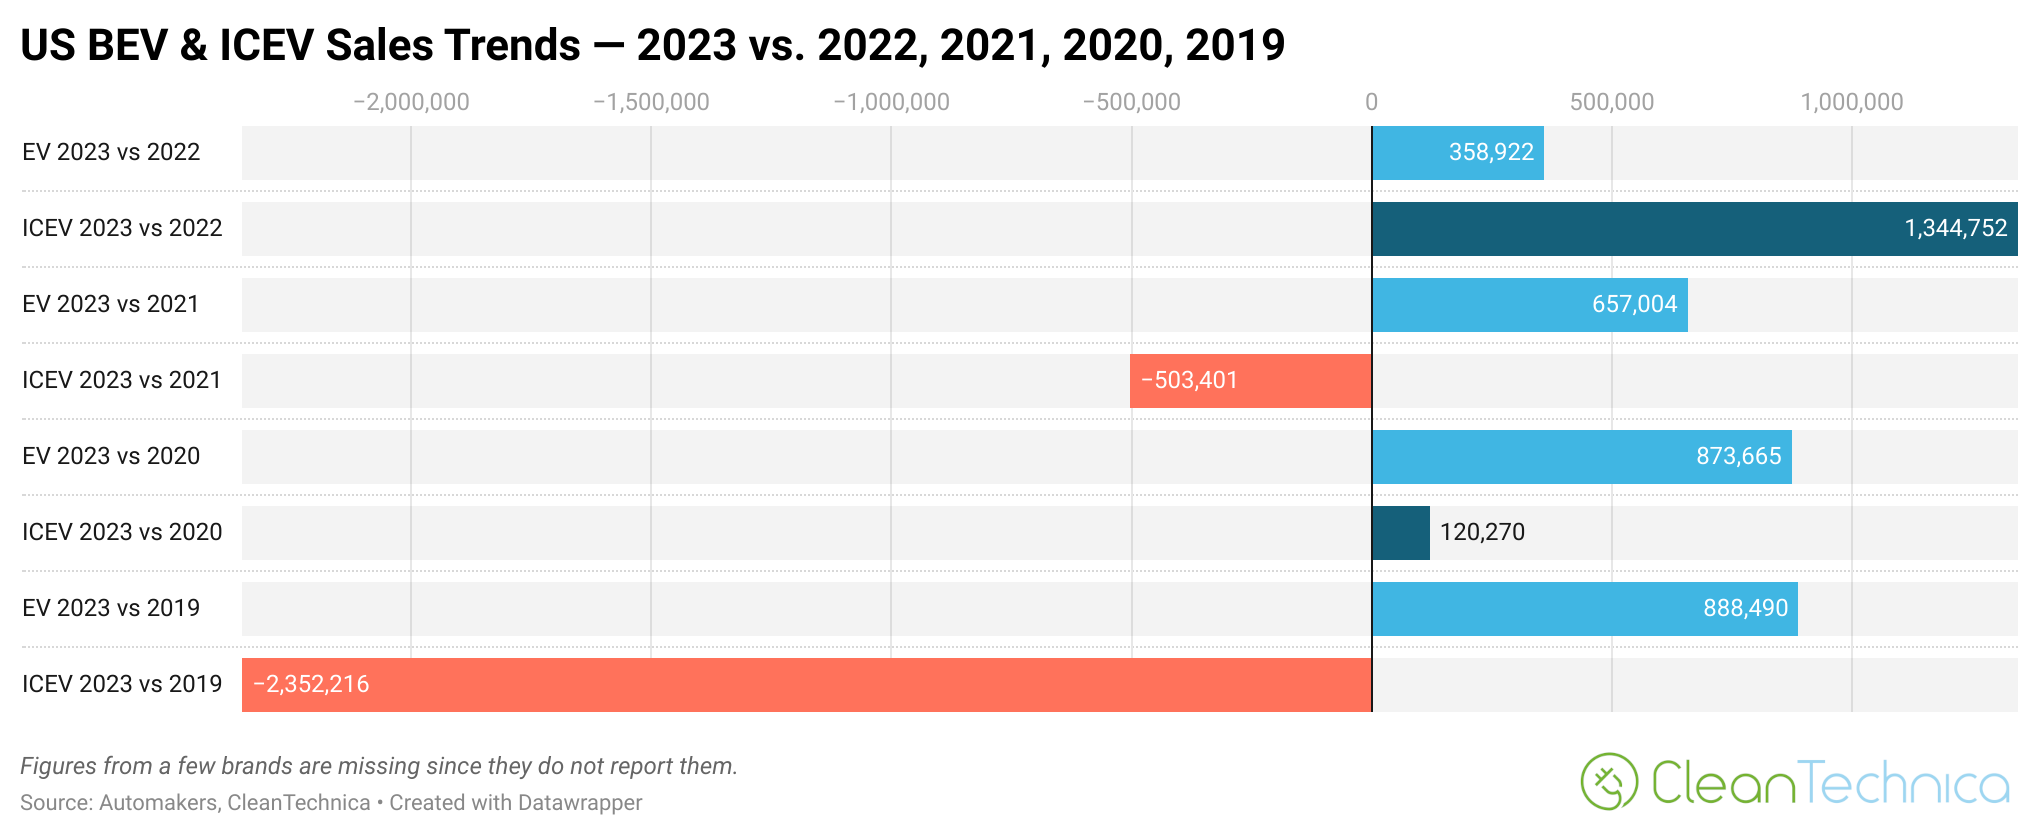
Here’s another way to look at the numbers before I jump into some commentary:
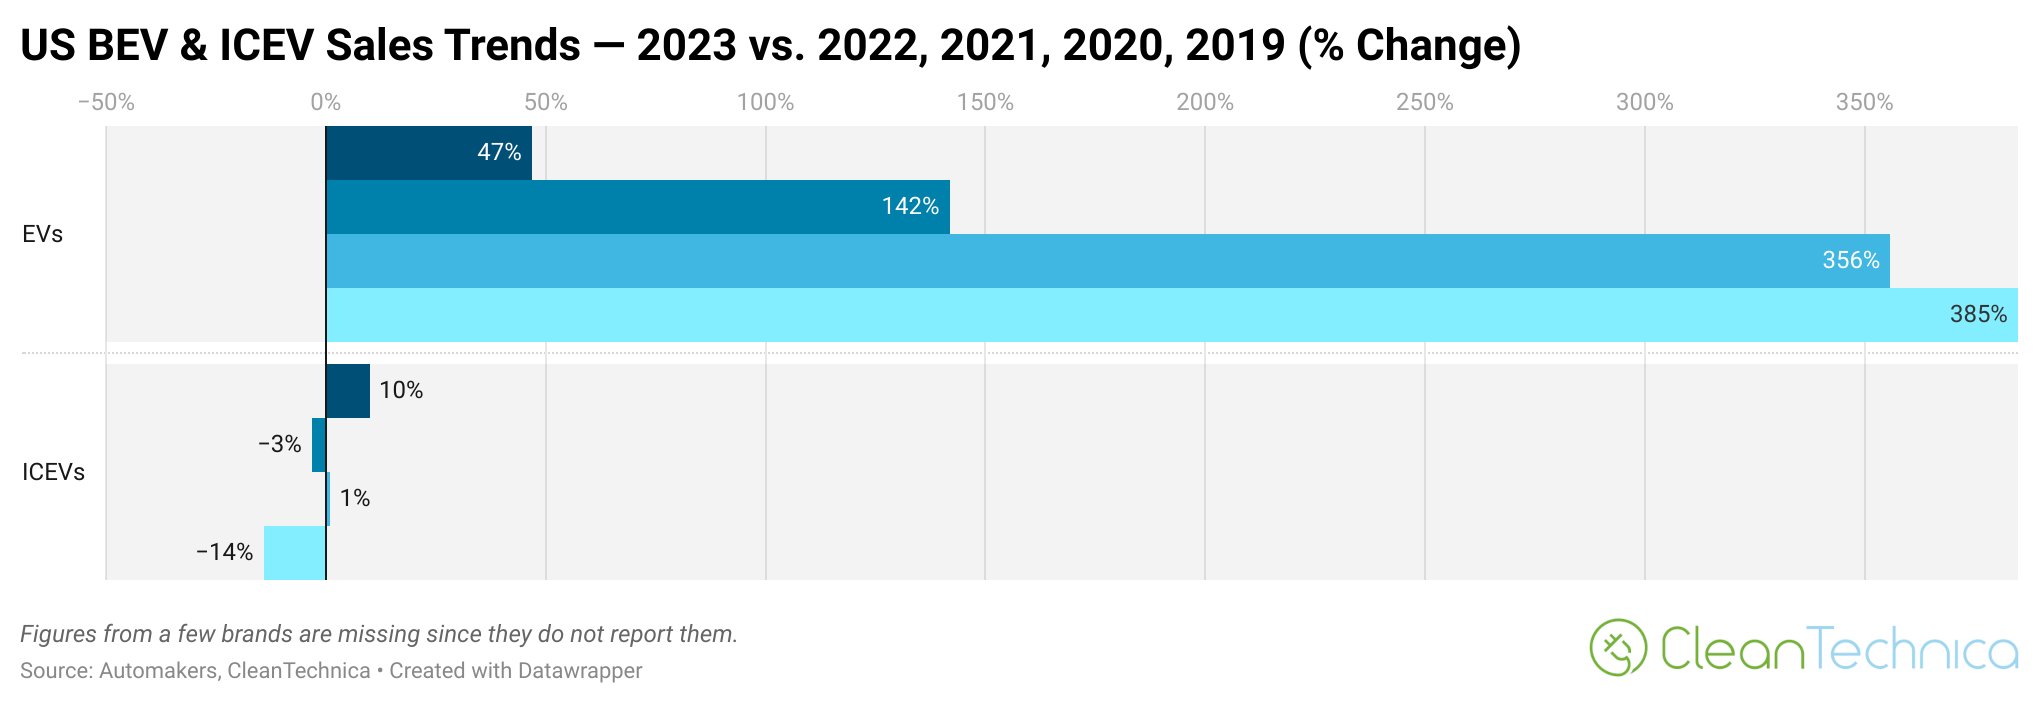
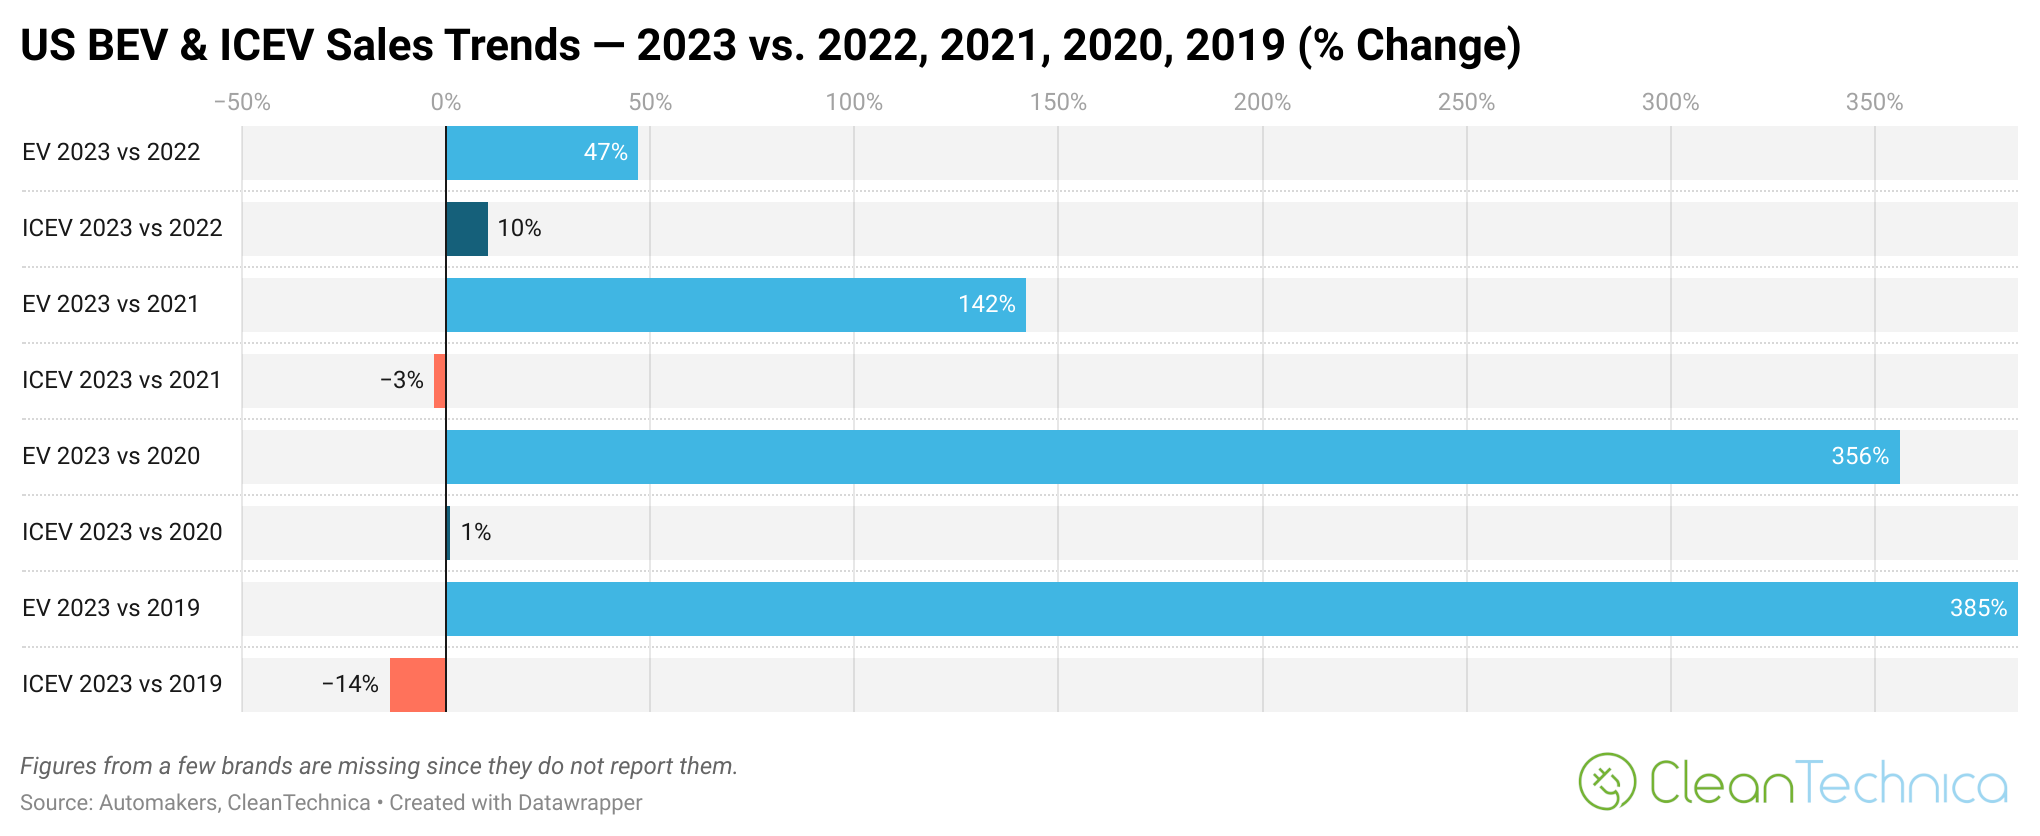
First of all, as we can see, no matter which time period you look at from the past 4 years, EV sales growth crushes internal combustion engine vehicle (ICEV) sales trends. Comparing 2023 and 2022 totals, EVs saw 47% growth while ICEVs (gas cars) saw 10% growth. Comparing 2023 and 2021 totals, EVs saw 142% growth while ICEVs (gas cars) saw a 3% drop in sales. Wait, which powertrain is struggling with its sales trends?
Dipping back into the big, horrible year of COVID, EV sales were up 356% in 2023 compared to 2020, while ICEV sales were up just slightly, 1%.
Going even further back, looking at the pre-COVID numbers of 2019, we can see that EV sales were up 385% in 2023 compared to 2019, while ICEV sales were down 14%.
So, of all the ways we’ve looked at changes in the EV market and changes in the auto market as a whole, I think these comparisons most clearly highlight that EV sales have been growing strongly year after year, whereas the non-EV market needs to worry about what’s happening and plan accordingly.
Thanks to Cypress again for the request/idea for this report.
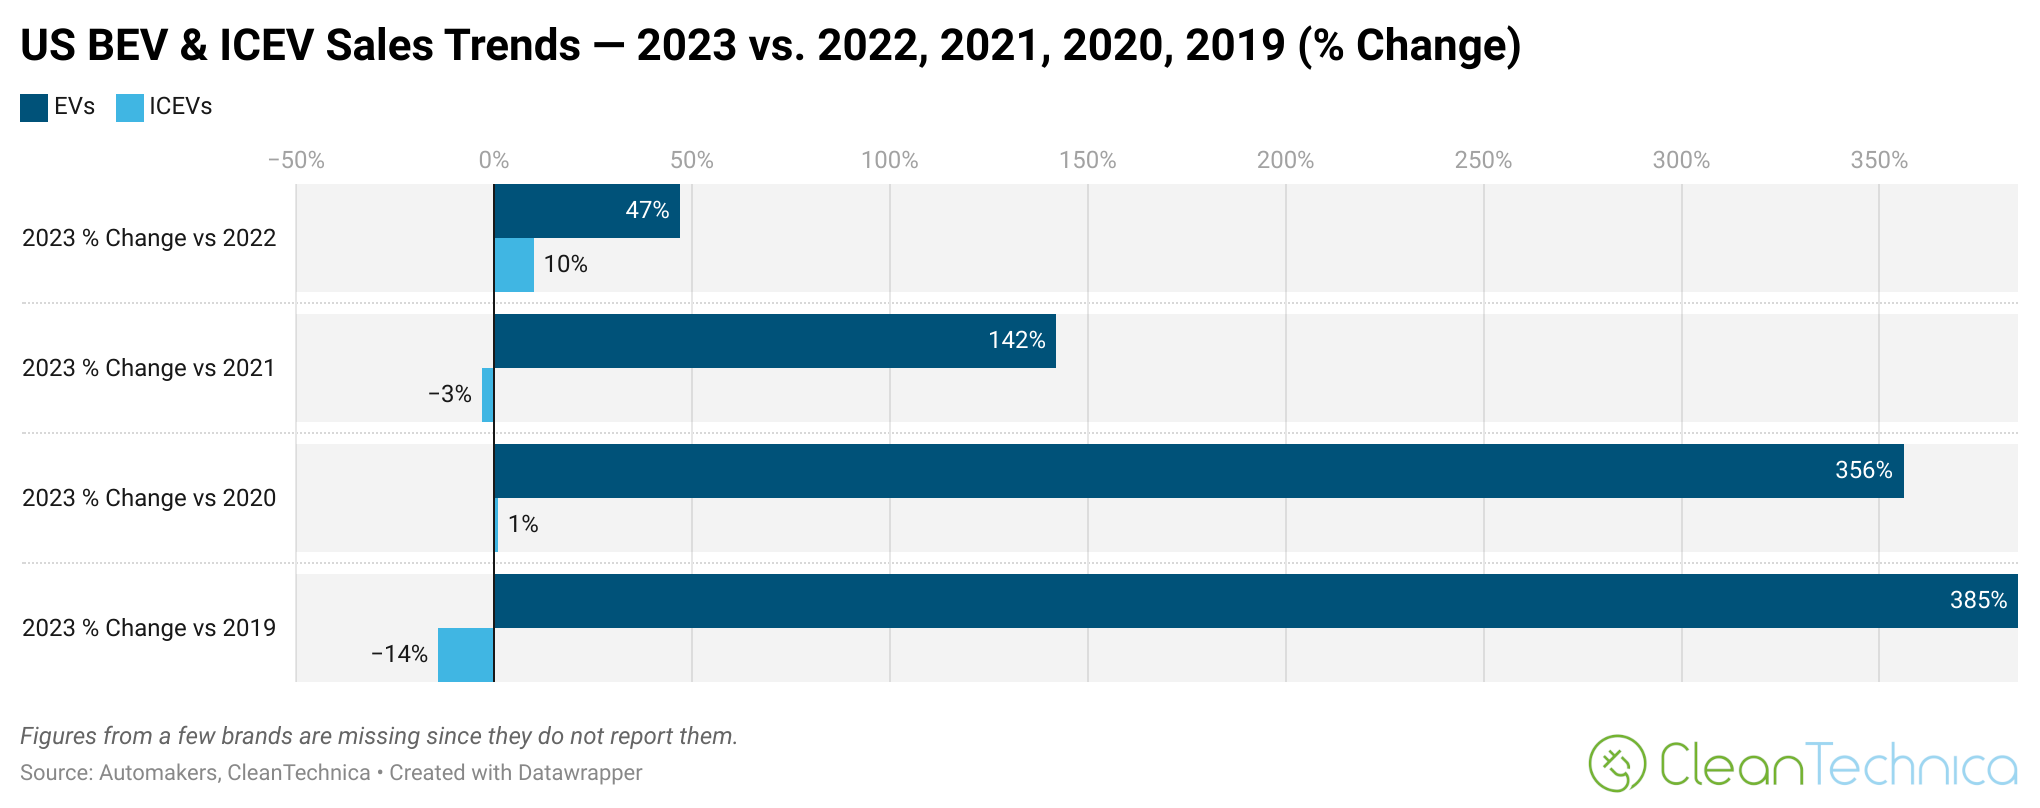
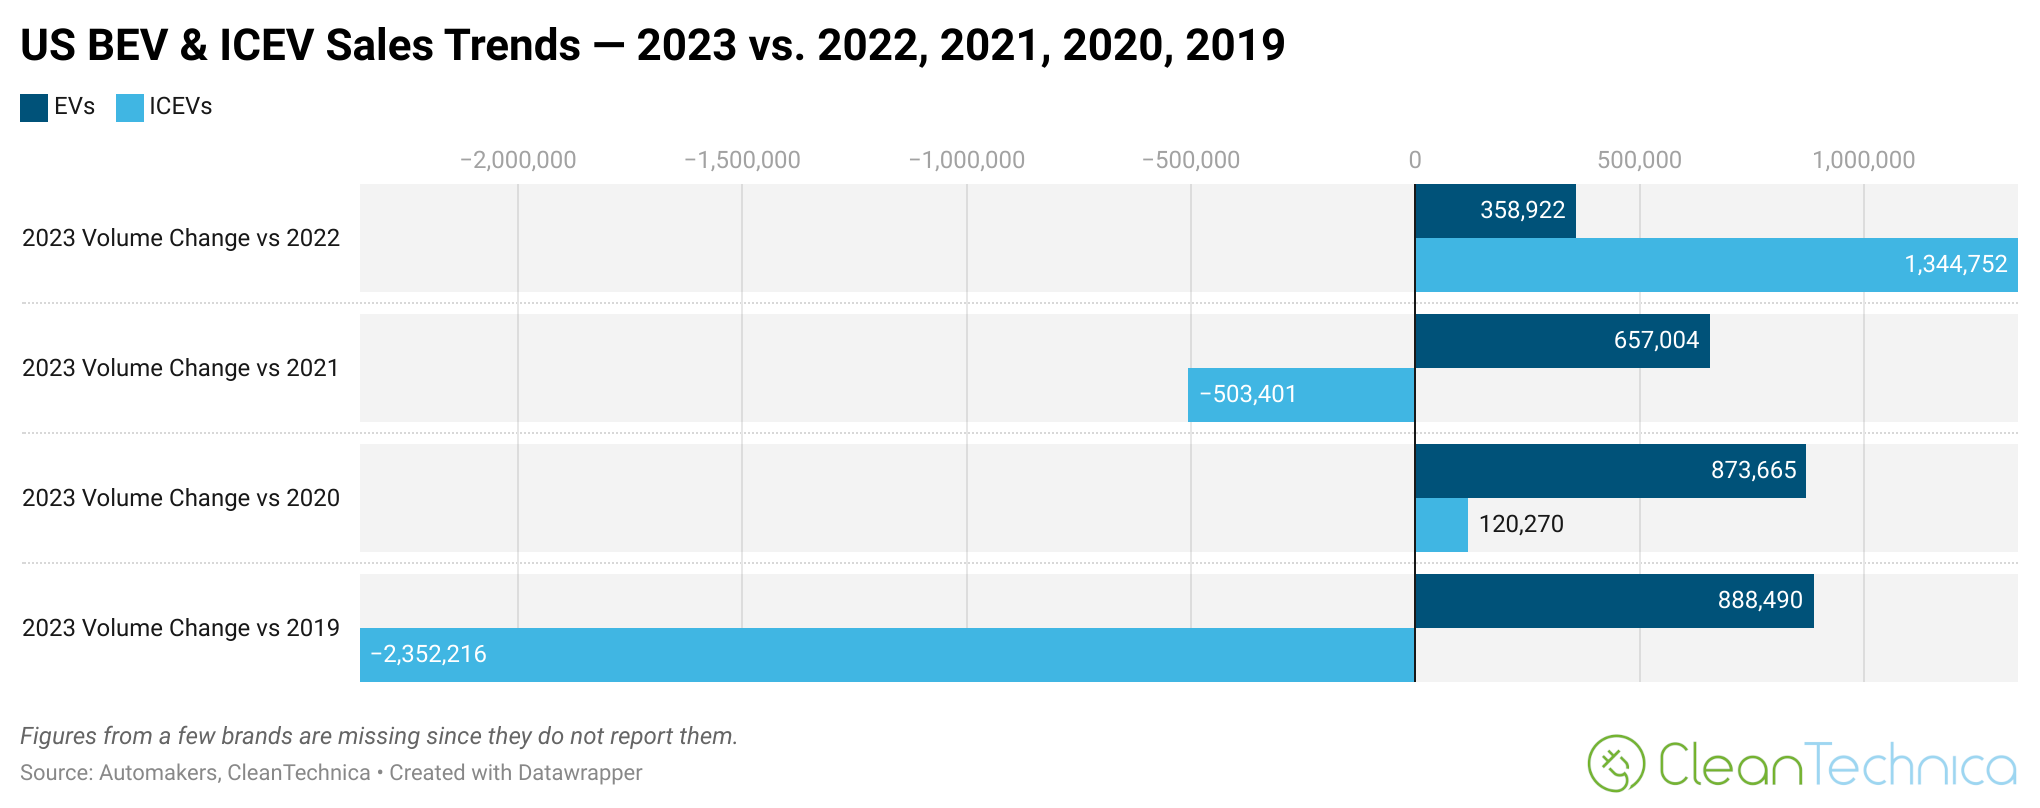
You can also look at these numbers in a slightly different way via the two charts below.
What are your thoughts on these results? Is the EV industry struggling, as so many headlines, writers, talking heads, and commenters are eager to say? Or is the fossil-fueled vehicle industry the portion of the industry that’s struggling?
Have a tip for CleanTechnica? Want to advertise? Want to suggest a guest for our CleanTech Talk podcast? Contact us here.
Latest CleanTechnica TV Video
[embedded content]
I don’t like paywalls. You don’t like paywalls. Who likes paywalls? Here at CleanTechnica, we implemented a limited paywall for a while, but it always felt wrong — and it was always tough to decide what we should put behind there. In theory, your most exclusive and best content goes behind a paywall. But then fewer people read it!! So, we’ve decided to completely nix paywalls here at CleanTechnica. But…
Thank you!
Advertisement
CleanTechnica uses affiliate links. See our policy here.
- SEO Powered Content & PR Distribution. Get Amplified Today.
- PlatoData.Network Vertical Generative Ai. Empower Yourself. Access Here.
- PlatoAiStream. Web3 Intelligence. Knowledge Amplified. Access Here.
- PlatoESG. Carbon, CleanTech, Energy, Environment, Solar, Waste Management. Access Here.
- PlatoHealth. Biotech and Clinical Trials Intelligence. Access Here.
- Source: https://cleantechnica.com/2024/02/14/us-ev-sales-up-385-since-2019-normal-ice-vehicle-sales-down-14/

