Introduction
Target, a leading retail company, has expanded its e-commerce operations in Brazil to cater to the growing online shopping trend. To ensure success in this competitive market, it is crucial for Target to understand the dynamics of e-commerce in Brazil and leverage data-driven insights to enhance its operations. In this article, we will analyze Target’s e-commerce dataset using structured query language (SQL) power queries to provide actionable recommendations for improving their operations in Brazil.
Learning Objectives
- Gain proficiency in SQL by analyzing Target’s e-commerce dataset.
- Learn how to perform initial exploration of a dataset, including data cleaning and preparation using SQL queries.
- Understand how to analyze and interpret e-commerce trends in Brazil using SQL queries.
- Develop skills in identifying and analyzing seasonality patterns in e-commerce data using SQL queries.
- Learn to extract valuable insights about customer buying patterns and preferences through SQL analysis.
- Develop the ability to make data-driven recommendations and actionable insights for improving e-commerce operations based on SQL analysis of the dataset.
Read More: SQL for Data Science Beginners!
This article was published as a part of the Data Science Blogathon.
Table of contents
Initial Exploration of Dataset
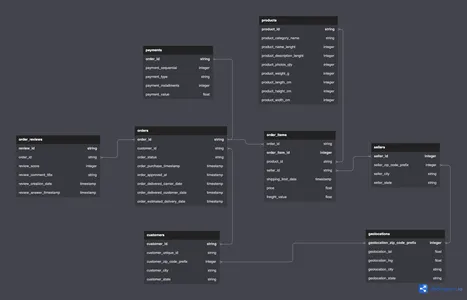
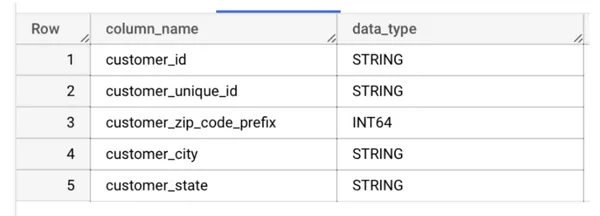
Before diving into the analysis, we performed an initial exploration of Target’s e-commerce dataset. This involved examining the data, cleaning it, and preparing it for analysis. We verified the column data types in the “customers” table using the following SQL query in BigQuery:
SELECT column_name, data_type
FROM `target-analysis-sql.target.INFORMATION_SCHEMA.COLUMNS`
WHERE table_name = 'customers';
By understanding the data types of each table, we ensure accurate analysis and interpretation of the dataset.
To understand the time period covered by the dataset, we executed the following SQL query:
SELECT DISTINCT MIN(order_purchase_timestamp) start_date, MAX(order_purchase_timestamp) end_date
FROM `target.orders`;
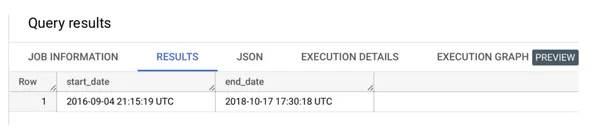
This allowed us to determine the start and end dates of the data i.e. from 4th September 2016 to 17th October 2018.
, providing a context for our analysis.
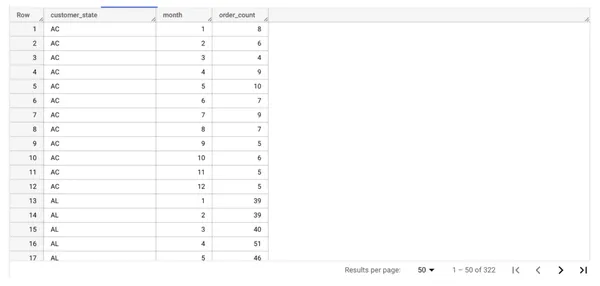
Furthermore, we examined the cities and states of customers who placed orders during the specified time period. The following SQL query helped us identify the customer distribution:
SELECT DISTINCT c.customer_city, c.customer_state, COUNT(o.customer_id) order_count
FROM target.orders o
JOIN target.customers c
ON o.customer_id = c.customer_id
GROUP BY 1, 2
ORDER BY 3 DESC;
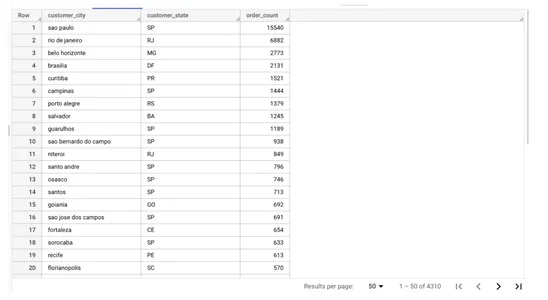
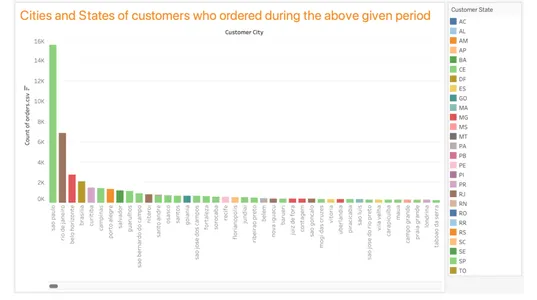
Here, we can see that sao paulo city from SP state alone has more orders than
the following 5 cities combined. This is because sao paulo is the most populous and richest
state in Brazil.
Learn More: From Basics to Advance of SQL
Exploring the Growing Trend of E-commerce in Brazil
The e-commerce landscape in Brazil has witnessed significant growth in recent years. To gain a comprehensive understanding of the scenario, it is essential to analyze various aspects, such as order count, revenue, and seasonality. In this section, we delve into the dataset to uncover insights regarding the e-commerce trend in Brazil.
Is there a growing trend on e-commerce in Brazil?
To determine the growing trend of e-commerce in Brazil, we examined the order count over time. Using SQL queries, we extracted the year and month from the order purchase timestamp and counted the distinct order IDs. The following query was executed:
SELECT EXTRACT(YEAR FROM o.order_purchase_timestamp) AS year, EXTRACT(MONTH FROM o.order_purchase_timestamp) AS month, COUNT(DISTINCT o.order_id) AS order_count
FROM `target.orders` o
JOIN `target.customers` c
ON o.customer_id = c.customer_id
GROUP BY year, month
ORDER BY year, month;
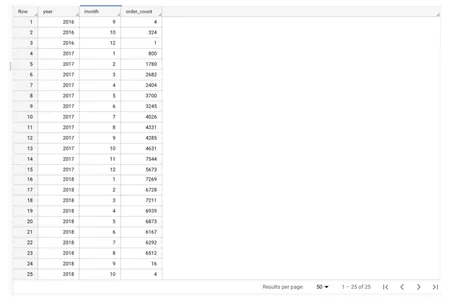
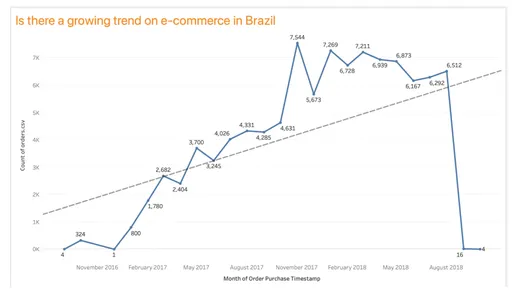
Based on the analysis of order count, it can be observed that there is a growing trend in e-commerce in Brazil. The count of purchases has shown an overall upward trend, with some fluctuations. However, it’s important to note that the order count alone does not indicate the pace of business growth. To gain a more accurate understanding, we should also consider revenue growth.
SELECT EXTRACT(YEAR FROM o.order_purchase_timestamp) AS year, EXTRACT(MONTH FROM o.order_purchase_timestamp) AS month, ROUND(SUM(p.payment_value), 2) as revenue
FROM `target.orders` o
JOIN `target.payments` p ON o.order_id = p.order_id
GROUP BY year, month
ORDER BY year, month; 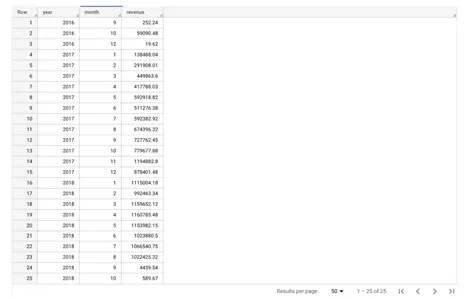
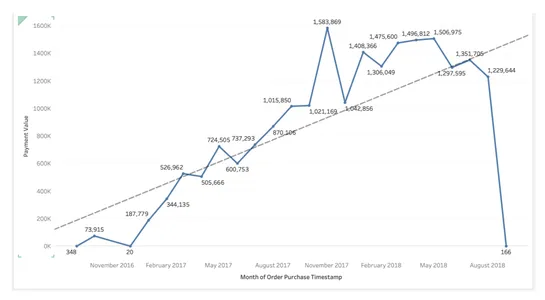
Here again, we can see a similar trend as above.
How can we describe a complete scenario?
To paint a complete picture of the e-commerce scenario in Brazil, it is crucial to consider multiple factors that impact sales. These factors include customer demographics, the increase in the customer base, technological advancements, the number of sellers, ease of ordering, customer satisfaction, trust over time, return and exchange policies, payment options, delivery time, order cancellations, and overall economic conditions. A holistic analysis of these aspects would provide a more comprehensive understanding of the e-commerce landscape in Brazil.
Can we see some seasonality with peaks at specific months?
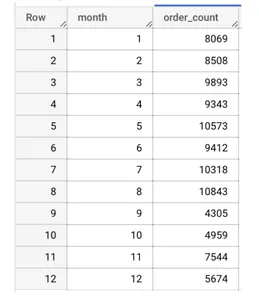
Analyzing the dataset, we explored the presence of seasonality within specific months. By extracting the month from the order purchase timestamp, we calculated the count of distinct order IDs for each month. The following query was executed:
SELECT EXTRACT(MONTH FROM order_purchase_timestamp) AS month, COUNT(DISTINCT order_id) AS order_count
FROM `target.orders`
GROUP BY month
ORDER BY month;
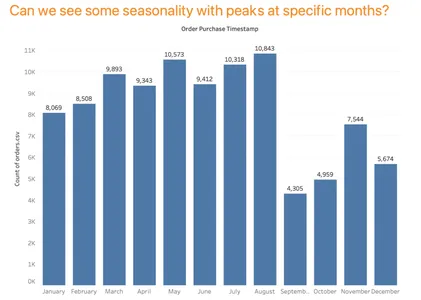
Considering the limited dataset provided, it is challenging to draw definitive conclusions regarding seasonality trends. However, from the analysis and visualization in Tableau, we can observe some seasonality in the e-commerce orders. The count of orders generally increases from March to August with fluctuations in between. Notably, there is an increase in orders during February and March, coinciding with the Carnival season in Brazil. Additionally, the month of August shows a peak in order count, potentially related to the Festival de Cachaça dedicated to the national liquor, cachaça. It is important to note that further analysis with a larger dataset would be required to validate these seasonality trends.
Understanding Buying Patterns of Brazilian Customers
To gain insights into the buying patterns of Brazilian customers, we analyzed the time of day when most orders were placed. The following SQL query was executed to categorize the order purchase timestamps into four periods: dawn, morning, afternoon, and night.
SELECT CASE WHEN EXTRACT(HOUR FROM o.order_purchase_timestamp) BETWEEN 0 AND 5 THEN 'Dawn' WHEN EXTRACT(HOUR FROM o.order_purchase_timestamp) BETWEEN 6 AND 11 THEN 'Morning' WHEN EXTRACT(HOUR FROM o.order_purchase_timestamp) BETWEEN 12 AND 17 THEN 'Afternoon' WHEN EXTRACT(HOUR FROM o.order_purchase_timestamp) BETWEEN 18 AND 23 THEN 'Night' END AS hour, COUNT(o.order_id) AS order_count
FROM target.orders o
JOIN target.customers c
ON o.customer_id = c.customer_id
GROUP BY hour
ORDER BY order_count DESC;
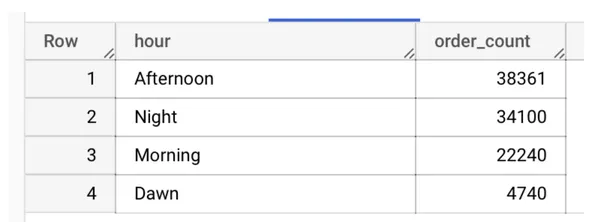
Based on the analysis, we found that Brazilian customers tend to place most orders during the daytime, specifically in the afternoon and night. This indicates that customers prefer to shop online when they have leisure time or after completing their daily activities. It’s important to note that the assumption here is that the recorded timestamps reflect the correct time zone at the time of purchase.
Understanding the buying patterns of customers helps e-commerce businesses optimize their operations. By identifying peak buying times, companies can allocate resources, such as customer service representatives and inventory, more effectively to meet customer demands and provide a seamless shopping experience.
Analyzing the data in this manner provides valuable insights into the behavior and preferences of Brazilian customers. With this information, e-commerce companies like Target can tailor their marketing strategies and promotional campaigns to specific time periods, maximizing their reach and potential sales.
In conclusion, analyzing the buying patterns of Brazilian customers reveals the growing trend of e-commerce in the country, highlights the importance of considering various factors for a complete understanding of the e-commerce scenario, and sheds light on the preferred time periods for online shopping. Armed with these insights, Target and other e-commerce businesses can make data-driven decisions to enhance their operations and improve customer satisfaction.
Evolution of E-commerce Orders in the Brazil Region: Unveiling State-wise Trends and Customer Distribution
Analyzing Month-on-Month Orders by States
To understand the evolution of e-commerce orders in the Brazil region, we analyzed the month-on-month order counts for each state. The following is the SQL query execution:
SELECT c.customer_state, EXTRACT(month FROM o.order_purchase_timestamp) AS month, COUNT(o.order_purchase_timestamp) AS order_count
FROM target.orders o
JOIN target.customers c
ON o.customer_id = c.customer_id
GROUP BY c.customer_state, month
ORDER BY c.customer_state, month;
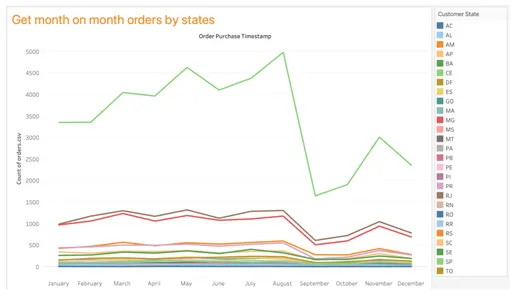
The above graph illustrates the month-on-month order counts in each state of Brazil, providing valuable insights into the customer purchase trends on a state-by-state basis. It is evident that São Paulo (SP) consistently has the highest number of orders in any given month, followed by Rio de Janeiro (RJ) and Minas Gerais (MG).
Distribution of Customers Across Brazilian States
To further explore the e-commerce landscape in Brazil, we examined the distribution of customers across the states. The following SQL query was executed:
SELECT c.customer_state, COUNT(c.customer_id) AS no_of_customers
FROM `target.customers` c
GROUP BY c.customer_state
ORDER BY no_of_customers DESC;
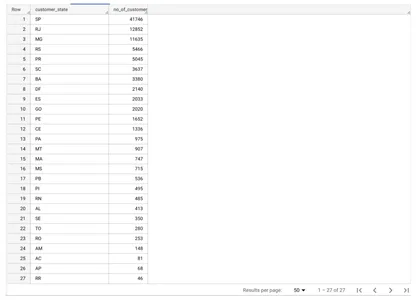
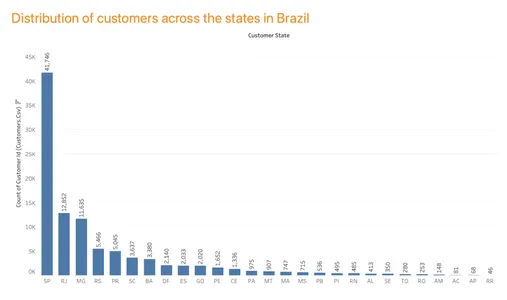
The data reveals that the state of São Paulo (SP) has the highest number of customers, which can be attributed to its status as the most populous state in Brazil. This finding also aligns with the previous analysis, indicating a positive correlation between the population of a state and its order count.
Understanding the evolution of e-commerce orders and the distribution of customers across Brazilian states is crucial for businesses like Target to tailor their marketing strategies, optimize logistics, and enhance customer experiences. By leveraging this SQL-driven analysis, e-commerce companies can effectively target specific regions, allocate resources strategically, and deliver personalized experiences that cater to the unique preferences and demands of customers in different states.
In conclusion, analyzing the evolution of e-commerce orders and customer distribution across states in Brazil provides valuable insights into the dynamics of the market. By leveraging SQL and data-driven approaches, businesses can gain a competitive edge, drive growth, and maximize their impact in the rapidly evolving e-commerce landscape of the Brazil region.
The Impact on Economy: Analyzing Cost Trends and State-wise Price and Freight Values
Examining the Percentage Increase in the Cost of Orders from 2017 to 2018 (January to August)
To understand the impact on the economy, we calculated the percentage increase in the cost of orders from 2017 to 2018, considering only the months from January to August. The following SQL query was executed:
SELECT EXTRACT(MONTH FROM o.order_purchase_timestamp) AS month, ( ( SUM(CASE WHEN EXTRACT(YEAR FROM o.order_purchase_timestamp) = 2018 AND EXTRACT(MONTH FROM o.order_purchase_timestamp) BETWEEN 1 AND 8 THEN p.payment_value END) - SUM(CASE WHEN EXTRACT(YEAR FROM o.order_purchase_timestamp) = 2017 AND EXTRACT(MONTH FROM o.order_purchase_timestamp) BETWEEN 1 AND 8 THEN p.payment_value END) ) / SUM(CASE WHEN EXTRACT(YEAR FROM o.order_purchase_timestamp) = 2017 AND EXTRACT(MONTH FROM o.order_purchase_timestamp) BETWEEN 1 AND 8 THEN p.payment_value END) )*100 AS percent_increase
FROM `target.orders` o
JOIN `target.payments` p ON o.order_id = p.order_id
WHERE EXTRACT(YEAR FROM o.order_purchase_timestamp) IN (2017, 2018) AND EXTRACT(MONTH FROM o.order_purchase_timestamp) BETWEEN 1 AND 8
GROUP BY 1
ORDER BY 1;
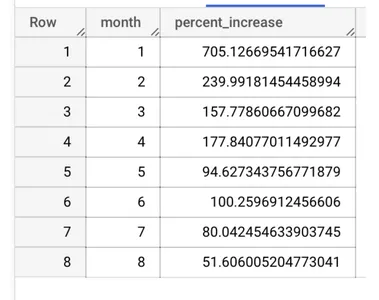
The overall percentage increase in the cost of orders from 2017 to 2018, including only the months from January to August, is 138.53%. Upon examining the month-wise increase, January shows the highest percentage increase, followed by February and April.
Analyzing Mean and Sum of Price and Freight Value by Customer State
To gain insights into the price and freight values on a state level, we calculated the mean and sum of these values by a customer state. The following is the SQL query execution:
SELECT c.customer_state, ROUND(AVG(i.price), 2) AS mean_price, ROUND(SUM(i.price), 2) AS total_price, ROUND(AVG(i.freight_value), 2) AS mean_freight_value, ROUND(SUM(i.freight_value), 2) AS total_freight_value
FROM `target.orders` o
JOIN `target.order_items` i ON o.order_id = i.order_id
JOIN `target.customers` c ON o.customer_id = c.customer_id
GROUP BY c.customer_state;
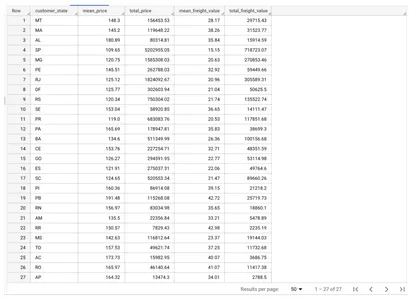
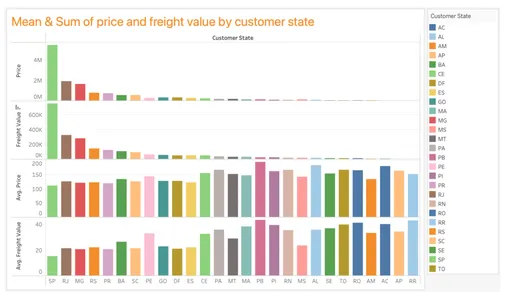
The analysis reveals interesting findings. While São Paulo (SP) has the highest total price value and total freight value, it surprisingly has the lowest average price value and average freight value among all states. On the other hand, the state of Paraíba (PB) has the highest average price value and average freight value.
Understanding the impact on the economy requires a comprehensive analysis of cost trends and price and freight values. By leveraging SQL queries and examining state-wise patterns, businesses can gain valuable insights into the economic landscape, identify potential opportunities for growth, and make data-driven decisions to optimize pricing strategies, enhance logistics, and drive overall economic impact.
Analyzing Sales, Freight, and Delivery Time: Insights from Brazil
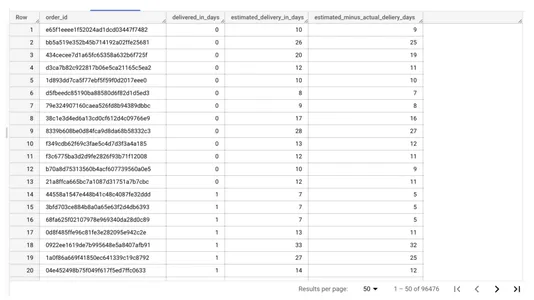
Calculating Days between Purchasing, Delivery, and Estimated Delivery
To understand the time duration between purchasing an order, its delivery, and the estimated delivery, we calculated the number of days using the following SQL query:
SELECT order_id, DATE_DIFF(order_delivered_customer_date, order_purchase_timestamp, DAY) AS delivered_in_days, DATE_DIFF(order_estimated_delivery_date, order_purchase_timestamp, DAY) AS estimated_delivery_in_days, DATE_DIFF(order_estimated_delivery_date, order_delivered_customer_date, DAY) AS estimated_minus_actual_delivery_days
FROM `target.orders`
WHERE DATE_DIFF(order_delivered_customer_date, order_purchase_timestamp, DAY) IS NOT NULL
ORDER BY delivered_in_days;
Finding Average Time to Delivery and Average Difference in Estimated Delivery State-wise
To gain insights into the average time taken for delivery and the average difference between estimated and actual delivery, we calculated the averages on a state level using the following SQL query:
SELECT c.customer_state, ROUND(AVG(DATE_DIFF(order_delivered_customer_date, order_purchase_timestamp, DAY)), 2) AS avg_time_to_delivery, ROUND(AVG(DATE_DIFF(order_estimated_delivery_date, order_delivered_customer_date, DAY)), 2) AS avg_diff_estimated_delivery
FROM `target.orders` o
JOIN `target.customers` c ON o.customer_id = c.customer_id
WHERE DATE_DIFF(order_purchase_timestamp, order_delivered_customer_date, DAY) IS NOT NULL AND DATE_DIFF(order_estimated_delivery_date, order_delivered_customer_date, DAY) IS NOT NULL
GROUP BY c.customer_state
ORDER BY avg_time_to_delivery;
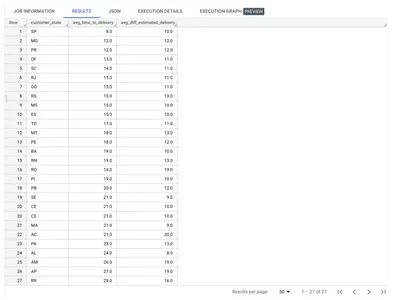
From the results, we can observe that São Paulo (SP) has the lowest average time to delivery, while Roraima (RR) has the highest average time to delivery.
Grouping Data by State and Calculating Mean Freight Value, Time to Delivery, and Difference in Estimated Delivery
To analyze the relationship between freight value, time to delivery, and the difference between estimated and actual delivery on a state level, we calculated the means using the following SQL query:
SELECT c.customer_state, ROUND(AVG(i.freight_value), 2) AS mean_freight_value, ROUND(AVG(DATE_DIFF(o.order_delivered_customer_date, o.order_purchase_timestamp, DAY)), 2) AS time_to_delivery, ROUND(AVG(DATE_DIFF(o.order_estimated_delivery_date, o.order_delivered_customer_date, DAY)), 2) AS diff_estimated_delivery
FROM `target.orders` o
JOIN `target.order_items` i ON o.order_id = i.order_id
JOIN `target.customers` c ON o.customer_id = c.customer_id
GROUP BY c.customer_state
ORDER BY mean_freight_value;
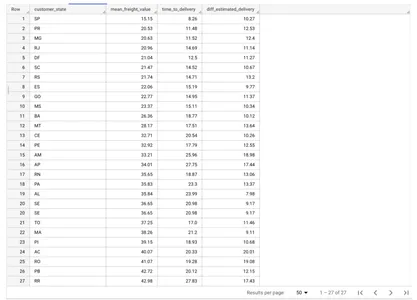
The analysis reveals a weak positive correlation between mean freight value and time to delivery. São Paulo (SP) has the lowest mean freight value, while Roraima (RR) has the highest mean freight value.
Understanding the sales, freight, and delivery time dynamics is crucial for businesses to optimize their operations and improve customer satisfaction. By leveraging SQL queries and analyzing state-wise patterns, companies can gain valuable insights into sales trends, optimize their logistics, and make data-driven decisions to enhance their overall efficiency and customer experience.
Analyzing Payment Types: Insights on Orders and Payment Installments
Month over Month Count of Orders for Different Payment Types
To understand the trends in payment types, we analyzed the month-over-month count of orders for different payment types. The following is the SQL query execution:
SELECT p.payment_type, EXTRACT(MONTH FROM o.order_purchase_timestamp) AS month, COUNT(DISTINCT o.order_id) AS order_count
FROM `target.orders` o
JOIN `target.payments` p
ON o.order_id = p.order_id
GROUP BY 1, 2
ORDER BY 1, 2;
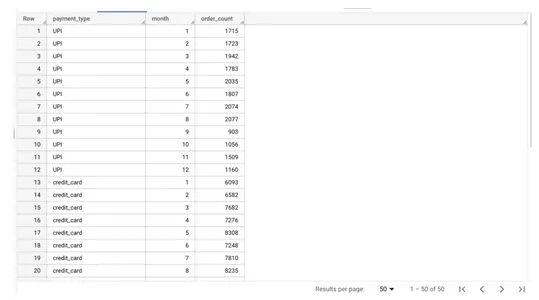
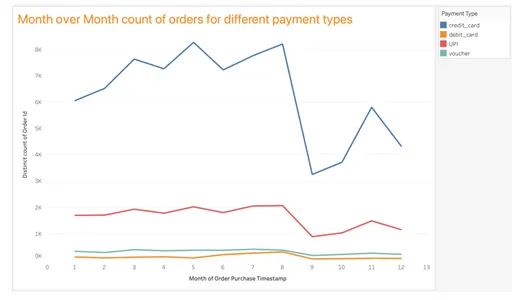
The analysis shows an overall uptrend from January to August and another uptrend from September to November. Credit card transactions are the most popular payment method, followed by UPI. Debit card transactions are the least preferred option. Notably, credit card transactions are rapidly increasing compared to other payment methods, possibly due to benefits like “buy now, pay later” options or cashback received using credit cards.
Count of Orders Based on the Number of Payment Installments
To gain insights into the distribution of payment installments, we analyzed the count of orders based on the number of payment installments. The following is the SQL query execution:
SELECT p.payment_installments, COUNT(o.order_id) AS order_count
FROM `target.orders` o
JOIN `target.payments` p
ON o.order_id = p.order_id
WHERE o.order_status != 'canceled'
GROUP BY 1
ORDER BY 2 DESC;
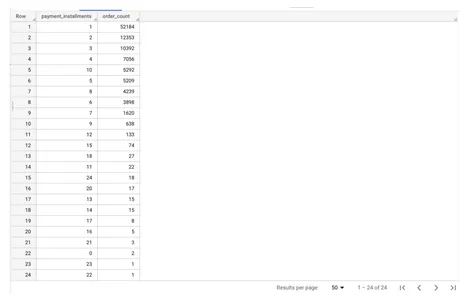
The analysis reveals that the majority of orders (maximum count) have only one payment installment. The highest number of installments is 24, which is associated with 18 orders.
Understanding payment types and installment preferences is essential for businesses to optimize their payment processes and cater to customer preferences. By leveraging SQL queries and analyzing payment trends, companies can make informed decisions to improve payment options, streamline processes, and enhance the overall customer experience.
In conclusion, the analysis provides valuable insights into payment types and installment preferences. It highlights the popularity of credit card transactions, the increasing trend of credit card usage, and the prevalence of single-payment installment orders. These insights can help businesses align their payment strategies and improve customer satisfaction.
Actionable Insights and Recommendations Based on the Analysis
Actionable Insights
- The data reveals that the state of SP has significantly more orders than the next five states combined. This indicates an opportunity for improvement in the other states. Focusing on these states can help increase the number of orders and expand the customer base.
- Seasonal variations in sales are observed, with increased sales during festive periods. Businesses should plan their marketing and sales strategies accordingly to capitalize on these peak periods and enhance customer satisfaction, resulting in overall sales growth.
- Improving delivery times in areas with longer delivery durations can have a positive impact on customer satisfaction and encourage repeat purchases. Streamlining logistics and implementing efficient shipping processes are key to achieving this.
- States like SP and RJ already have high order counts. To further boost sales and foster brand loyalty, it is recommended to focus on customer retention strategies, such as personalized marketing campaigns, loyalty programs, and exceptional customer service experiences.
- Analyzing customer demographics can provide valuable insights for tailoring products and marketing strategies to specific target audiences. This customization can lead to increased sales and customer satisfaction.
- The data indicates a decline in orders during September and October. Offering discounts or promotions during off-peak seasons can incentivize customers to make purchases during these periods, thus boosting sales.
- While the data does not include information on economic conditions, analyzing their impact on sales can help identify areas for improvement and investment, ensuring resilience during economic fluctuations.
Recommendations
- Improve logistics and shipping processes to reduce delivery times and enhance customer satisfaction. This includes optimizing warehouse operations, refining shipping routes, and partnering with reliable courier services.
- Implement customer retention strategies to encourage repeat purchases and foster loyalty. This can be achieved through loyalty programs, referral rewards, and personalized offers.
- Evaluate pricing and freight fees to ensure competitiveness in the market while maximizing revenue and profitability. Consider increasing prices or adjusting freight fees as appropriate.
- Invest in technology and infrastructure to enhance the e-commerce experience. This includes implementing chatbots for customer support, improving website performance, and offering personalized product recommendations based on customer behavior.
- Collaborate with sellers to expand product offerings and improve product quality, catering to diverse customer needs and preferences.
- Leverage social media platforms and influencers to promote products and increase brand awareness, as they have a strong influence on purchasing decisions in Brazil.
- Enhance the customer service experience by offering chat support services and ensuring prompt and effective responses to customer inquiries.
- Monitor competitor activity and adjust the business strategy accordingly, such as matching or offering better pricing, expanding product offerings, or improving customer service to stay competitive in the market.
By implementing these actionable insights and recommendations, businesses can optimize their operations, enhance customer satisfaction, and drive overall sales growth in the Brazilian e-commerce market.
Conclusion
In conclusion, the analysis of e-commerce data in the Brazilian market provides valuable insights into customer buying patterns, sales trends, payment preferences, and delivery experiences. By understanding these patterns and trends, businesses can make informed decisions and implement strategies to optimize their operations and drive growth. Here are the key takeaways from the analysis:
Key Takeaways
- The state of SP dominates the e-commerce market in Brazil, indicating the need to focus on other states for potential growth opportunities.
- Analyzing customer demographics can help tailor products and marketing strategies to specific target audiences, leading to increased sales.
- Offering discounts during off-peak seasons can incentivize customers and boost sales during slower periods.
The media shown in this article is not owned by Analytics Vidhya and is used at the Author’s discretion.
Related
- SEO Powered Content & PR Distribution. Get Amplified Today.
- EVM Finance. Unified Interface for Decentralized Finance. Access Here.
- Quantum Media Group. IR/PR Amplified. Access Here.
- PlatoAiStream. Web3 Data Intelligence. Knowledge Amplified. Access Here.
- Source: https://www.analyticsvidhya.com/blog/2023/06/sql-powers-to-reveal-insights-into-brazilian-online-shopping/

