Introduction
Matplotlib.pyplot.subplots() is a powerful function in Python that allows users to create a grid of subplots within a single figure. This function is a part of the Matplotlib library, which is widely used for data visualization in Python. With subplots(), users can easily create multiple plots in a single figure, making comparing and analyzing different datasets or variables easier.

Table of contents
Benefits of Using Matplotlib.pyplot.subplots()
Using Matplotlib.pyplot.subplots() offer several benefits for data visualization tasks. Firstly, it provides a convenient way to organize and display multiple plots in a single figure. This can be particularly useful when comparing different aspects of a dataset or when presenting various visualizations.
Additionally, subplots() allow users to customize the layout and arrangement of the subplots. Users can specify the number of rows and columns in the subplot grid and the size and spacing between each subplot. This flexibility enables users to create visually appealing and informative plots.
Also Read: Introduction to Matplotlib using Python for Beginners
Understanding the Subplots Grid
The subplot grid is the arrangement of subplots within a figure created using Matplotlib.pyplot.subplots(). It consists of rows and columns, each cell representing a subplot. The user can specify user can select the number of rows and columns depending on the desired layout.
The subplots are accessed using indexing, similar to accessing elements in a matrix. For example, to access the subplot in the first row and second columns, the indexing would be [0, 1]. This allows users to modify and customize individual subplots within the grid quickly.
The subplot grid can be created using the subplots() function, which returns a Figure object and an array of Axes objects. The Figure object represents the entire figure, while the Axes objects represent each subplot. These Axes objects can be used to modify the properties of each subplot, such as the title, labels, and data.
Creating a Basic Subplot Grid
This section will explore how to create a basic subplot grid using the `matplotlib.pyplot.subplots()` function in Python. This function allows us to create a grid of subplots within a single figure, making it easier to visualize multiple plots simultaneously.
Syntax and Parameters
The syntax for creating a subplot grid is as follows:
Code:
fig, axes = plt.subplots(nrows, ncols)Here, `nrows` and `ncols` represent the number of rows and columns in the subplot grid. The function returns two objects: fig, which means the entire figure and axes, which is an array of axes objects representing each subplot.
Example: Creating a 2×2 Subplot Grid
Let’s consider an example to understand how to create a 2×2 subplot grid. First, we need to import the necessary libraries:
Code:
import matplotlib.pyplot as plt

import numpy as np

x = np.linspace(0, 2*np.pi, 100)

y1 = np.sin(x)

y2 = np.cos(x)

y3 = np.tan(x)

y4 = np.exp(x)

fig, axes = plt.subplots(2, 2)

axes[0, 0].plot(x, y1)

axes[0, 0].set_title('Sin(x)')

axes[0, 1].plot(x, y2)

axes[0, 1].set_title('Cos(x)')

axes[1, 0].plot(x, y3)

axes[1, 0].set_title('Tan(x)')

axes[1, 1].plot(x, y4)

axes[1, 1].set_title('Exp(x)')

plt.tight_layout()

plt.show()
Output:
In this example, we create a 2×2 subplot grid using the `subplots()` function. We then access each subplot using indexing on the `axes` array and plot our data accordingly. Finally, we use `tight_layout()` to adjust the spacing between subplots and `show()` to display the figure.
By using the `matplotlib.pyplot.subplots()` function, we can easily create and customize subplot grids in Python. This allows us to visualize multiple plots in a single figure, making data analysis and presentation convenient.
Adjusting Subplot Spacing
You can adjust the spacing between them when creating subplots using the `subplots()` function in Matplotlib. This can be useful when you want to customize the layout of your plots or when you have multiple subplots and want to optimize the spacing between them.
Using the `wspace` and `hspace` Parameters:
To adjust the spacing between subplots, use the `wspace` and `hspace` parameters of the `subplots()` function. These parameters control the width and height spacing between subplots, respectively.
The `wspace` parameter controls the horizontal spacing between subplots, while the `hspace` parameter controls the vertical spacing. Adjusting these parameters allows you to create more or less space between your subplots.
For example, you can set the `wspace` and `hspace` parameters to a higher value to increase the spacing between subplots. On the other hand, if you want to decrease the spacing, you can set these parameters to a lower value.
Example: Adjusting Subplot Spacing
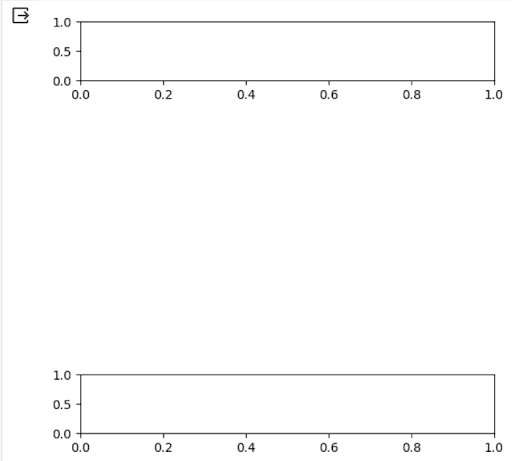
Let’s consider an example to demonstrate how to adjust subplot spacing. Suppose we have a figure with two subplots arranged vertically. We want to increase the spacing between these subplots.
We can set the `wspace` parameter to 0.2 and the `hspace` parameter to 0.5 to achieve this. This will create more space between the subplots, both horizontally and vertically.
Code:
import matplotlib.pyplot as plt

fig, axs = plt.subplots(2, 1, figsize=(6, 6))

fig.subplots_adjust(wspace=1, hspace=5)

# Plotting code for the subplots

plt.show()
Output:

In the above example, we first create a figure with two subplots using the `subplots()` function. Then, we use the `subplots_adjust()` function to adjust the spacing between the subplots by setting the `wspace` and `hspace` parameters.
You can create visually appealing plots with the desired layout and spacing between subplots by customizing the subplot spacing.
Setting Subplot Titles and Axis Labels
In this section, we will explore how to add titles to subplots and axis labels to enhance the visual representation of our plots.
Adding Titles to Subplots
We can use the `set_title()` function to add titles to subplots. This function allows us to specify the title for each subplot. We can provide context and clarity to our plots by giving a descriptive title.
For example, let’s say we have a figure with two subplots representing the distribution of two variables. We can add titles to these subplots using the following code:
Code:
fig, (ax1, ax2) = plt.subplots(1, 2)

ax1.set_title("Distribution of Variable A")

ax2.set_title("Distribution of Variable B")
Using the `set_title()` function, we can easily customize the titles of our subplots to convey the information we want to present.
Adding Axis Labels to Subplots
Axis labels are essential for providing information about the variables represented on a plot’s x and y axes. To add axis labels to subplots, we can use the `set_xlabel()` and `set_ylabel()` functions.
For instance, consider a figure with two subplots representing the relationship between two variables. We can add axis labels to these subplots using the following code:
Code:
fig, (ax1, ax2) = plt.subplots(1, 2)

ax1.set_xlabel("Variable A")

ax1.set_ylabel("Variable B")

ax2.set_xlabel("Variable C")

ax2.set_ylabel("Variable D")
By using the `set_xlabel()` and `set_ylabel()` functions, we can provide clear labels for each subplot’s x and y axes, making it easier for viewers to interpret the data.
Example: Setting Subplot Titles and Axis Labels
To illustrate the process of setting subplot titles and axis labels, let’s consider an example where we have a figure with three subplots representing different aspects of a dataset.
Code:
import matplotlib.pyplot as plt

import numpy as np

# Generating sample data

x = np.arange(1, 6)

y1 = np.random.randint(1, 10, size=5)

y2 = np.random.randint(1, 10, size=5)

y3 = np.random.randint(1, 10, size=5)

fig, (ax1, ax2, ax3) = plt.subplots(1, 3)

ax1.plot(x, y1)

ax1.set_title("Plot 1")

ax1.set_xlabel("X-axis")

ax1.set_ylabel("Y-axis")

ax2.scatter(x, y2)

ax2.set_title("Plot 2")

ax2.set_xlabel("X-axis")

ax2.set_ylabel("Y-axis")

ax3.bar(x, y3)

ax3.set_title("Plot 3")

ax3.set_xlabel("X-axis")

ax3.set_ylabel("Y-axis")

# Plotting code for the subplots

plt.show()
Output:
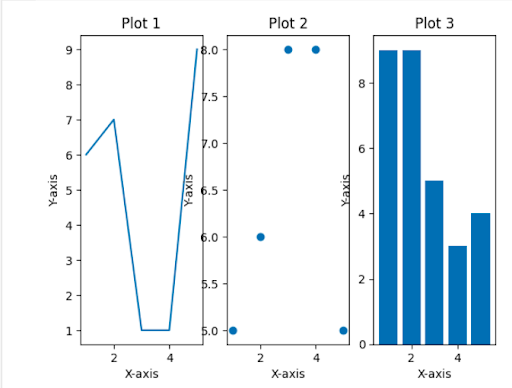
In this example, we create a figure with three subplots, each representing a different type of plot. We set titles for each subplot using set_title () and provide axis labels using set_xlabel () and set_ylabel (). This allows us to clearly label and describe each subplot, making it easier for viewers to understand the presented data.
By following these steps, we can effectively set subplot titles and axis labels to enhance the visual representation of our plots.
Controlling Subplot Sizes and Aspect Ratios
When creating subplots using Matplotlib’s `subplots()` function, you can see the aspect ratios of the subplots. This allows you to customize the layout of your plots to fit your needs best.
suitng the figsize Parameter
One way to control the size of the subplots is by using the `figsize` parameter. This parameter takes in a tuple of two values, representing the figure’s width and height in inches. By adjusting these values, you can change the overall size of the subplots.
For example, if you want to create a figure with subplots that are 8 inches wide and 6 inches tall, you can set the `figsize` parameter to `(8, 6)`:
import matplotlib.pyplot as plt
fig, axs = plt.subplots(2, 2, figsize=(8, 6))
This will create a figure with a grid of 2 rows and two columns, where each subplot has a size of 8 inches by 6 inches.
Example: Controlling Subplot Sizes and Aspect Ratios
Let’s consider an example to further illustrate how to control subplot sizes and aspect ratios. Suppose we want to create a figure with two subplots, where the first subplot is twice as wide as the second subplot.
Code:
import matplotlib.pyplot as plt

fig, axs = plt.subplots(1, 2, figsize=(10, 5))

axs[0].plot([1, 2, 3, 4], [1, 4, 9, 16])

axs[0].set_title('Subplot 1')

axs[1].plot([1, 2, 3, 4], [1, 8, 27, 64])

axs[1].set_title('Subplot 2')

plt.show()
Output:

In this example, we create a figure with a grid of 1 row and 2 columns. We set the `figsize` parameter to `(10, 5)`, which means the figure will be 10 inches wide and 5 inches tall.
The first subplot is plotted using the data `[1, 2, 3, 4]` for the x-axis and `[1, 4, 9, 16]` for the y-axis. The second subplot is plotted using the data `[1, 2, 3, 4]` for the x-axis and `[1, 8, 27, 64]` for the y-axis.
Adjusting the `figsize` parameter allows you to control the overall size of the subplots, enabling you to create custom layouts that best suit your needs.
Conclusion
In this article about Matplotlib.pyplot.subplots() in Python, we learned how to control the sizes and aspect ratios of subplots in Matplotlib. Using the `figsize` parameter, we can adjust the overall size of the subplots. This allows us to create custom layouts that best fit our requirements. Experiment with different values for the `figsize` parameter to achieve your plots’ desired subplot sizes and aspect ratios.
- SEO Powered Content & PR Distribution. Get Amplified Today.
- PlatoData.Network Vertical Generative Ai. Empower Yourself. Access Here.
- PlatoAiStream. Web3 Intelligence. Knowledge Amplified. Access Here.
- PlatoESG. Carbon, CleanTech, Energy, Environment, Solar, Waste Management. Access Here.
- PlatoHealth. Biotech and Clinical Trials Intelligence. Access Here.
- Source: https://www.analyticsvidhya.com/blog/2024/02/matplotlib-pyplot-subplots-in-python/

