Introduction
The Coefficient of Variation (CV) is a valuable tool for comparing the variability of different datasets. It is most useful in instances where the units of the data are different. This article will explain what the CV is and how it’s applied in various industries. Moreover, it will give you step-by-step instructions on how to calculate a CV in Microsoft Excel and Google Sheets.

Table of Contents
What is a Coefficient of Variation?
A coefficient of variation (CV) measures the data point dispersion around a mean. It allows us to compare the variability of two or more datasets that may have different units or different means, providing a standardized measure of dispersion.
The coefficient of variation shows how much the data in a sample varies in comparison to the mean of the data. A lower CV means that the data points are clustered closer to the mean, which indicates lower variability. Whereas, a higher CV shows a wider spread of data points around the mean, indicating higher variability.
For example, let’s consider data analysis in the financial and investment sector. Here, the volatility of prices can influence potential returns, and knowing the CV helps in making better market predictions. A lower CV means a lower risk-to-return ratio. This indicates a better trade-off between the potential risks and expected returns of a particular investment.
How to Calculate the Coefficient of Variation in Excel and Sheets
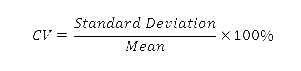
CV is calculated by dividing the dataset’s standard deviation by the mean and then multiplying the result by 100 to express it as a percentage.
Mathematically, the formula for CV is:
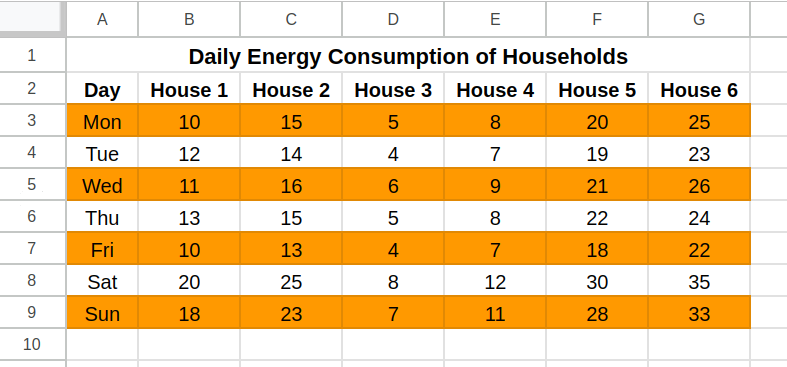
When we come to Excel, however, we don’t have a single built-in function to calculate the CV. The same applies to Google Sheets. Therefore, we need to follow a 3-step process to calculate it. For this tutorial, we have used a sample table of the average electricity consumption (in kWh) of houses in a block, on different days of the week.
Here’s the step-by-step process to find the coefficient of variation in Microsoft Excel and Google Sheets:
- Calculate the Standard Deviation
In an empty cell, we enter the formula
=STDEV.P(B3:B9)to calculate the standard deviation of the energy consumption of House 1. We then calculate the same for all the houses. You can replace B3:B9 with the actual range of your data.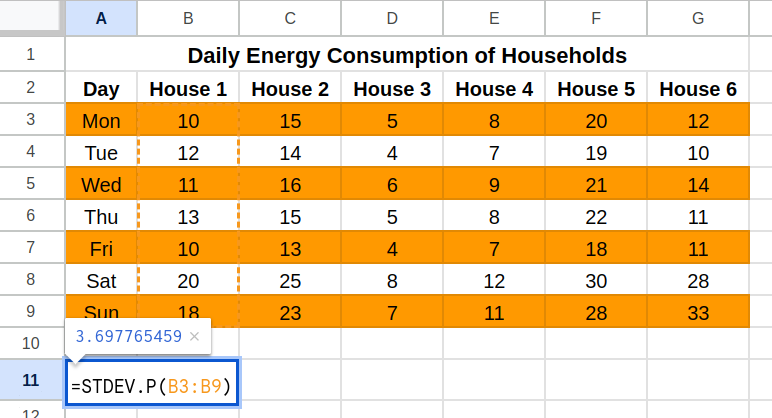
- Calculate the Mean
In another empty cell, we enter the formula
=AVERAGE(B3:B9)to calculate the mean energy consumption of House 1. We will then do the same for the other columns. You can again use the same data range used in the previous step.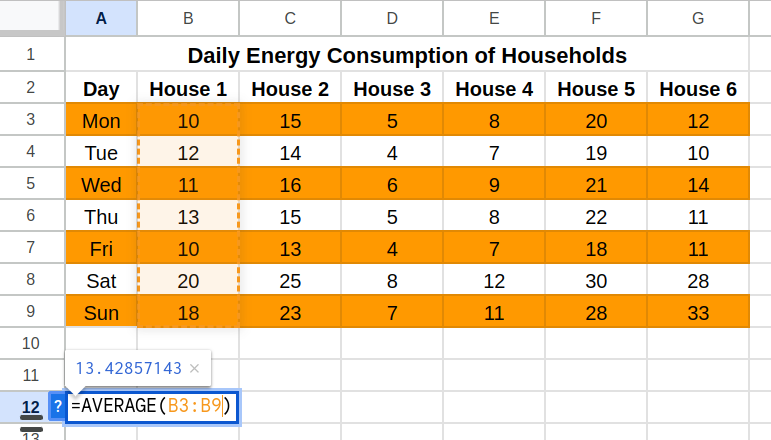
- Calculate the Coefficient of Variation
In a final cell, we enter the formula
=STDEV.P(B3:B9)/AVERAGE(B3:B9)*100. Alternatively, you can simply enter the formula=DIVIDE(A13,A12)*100or the two respective cells from the previous steps. This divides the standard deviation by the mean and multiplies it by 100, resulting in the coefficient of variation.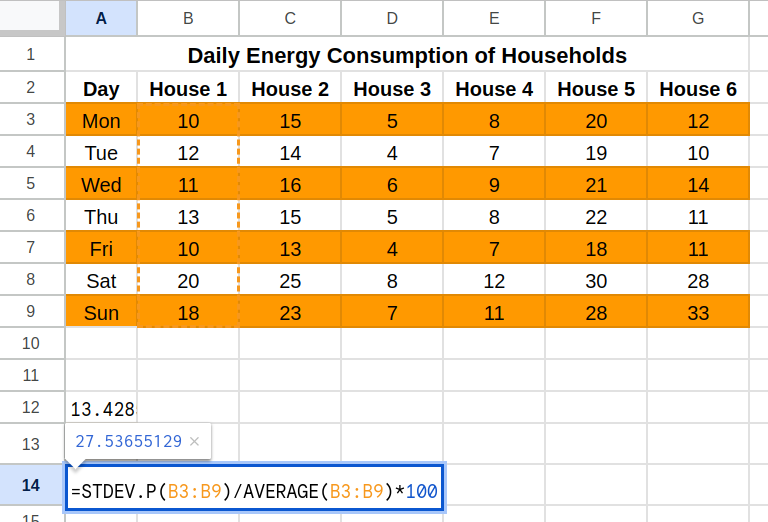
Practical Considerations in Calculating CV
- Zero or Near-Zero Means: Be cautious when the mean is zero or close to zero, as CV can become misleading. In such cases, you can consider alternative measures like standard deviation or interquartile range.
- Distribution Assumptions: CV is most effective with normally distributed data. Skewed distributions or outliers can distort the CV, so always examine the data distribution before relying solely on the CV.
- Data Scales: Ensure your data aligns with CV assumptions. CV works best with ratio-scale data (e.g., prices, weights). Applying it to interval-scale data (e.g., temperatures) may lead to incorrect interpretations.
Real-Life Applications of the Coefficient of Variation
Data analysts in fields ranging from finance and risk management to manufacturing and medicine, calculate CVs to better understand the data. Let’s explore some of these real-life applications:
Finance and Risk Assessment
In the financial world, investors use CV values to identify assets that offer higher returns in relation to their inherent risk. This helps to build diversified portfolios and manage risks better. For instance, an investor can compare the standard deviation of returns from different stocks to their mean returns, to get an insight into their risk-return profiles.
Quality Control in Manufacturing
The CV is crucial in ensuring consistent product quality across different production batches. A lower CV indicates less variation in product characteristics, which is essential for maintaining brand standards and customer satisfaction. Industries where product reliability is critical, like pharmaceuticals and automotive manufacturing, heavily rely on CV analysis.
Weather Analysis
Meteorologists use the CV to analyze the consistency of weather patterns, such as rainfall variations across regions and time periods. This helps improve the accuracy of weather forecasts and plan weather-dependent activities such as agriculture.
Biology and Medicine
CV is employed to assess the repeatability and reliability of experimental results, ensuring consistency in scientific research. It is an essential part of understanding the effectiveness of new drugs that are in clinical trials.
Conclusion
The coefficient of variation is a powerful tool for comparing the relative variability of datasets. Calculating CV in Excel or Sheets can give you insights into the consistency of various data points. It is mostly used in analyzing financial returns, product quality, and the results of scientific research. With this step-by-step guide, you can easily apply this measure in your data analyses to make informed decisions based on data variability.
For more advanced data analysis techniques in Excel, you can explore our courses on Excel fundamentals and data visualization. Happy analyzing!
- SEO Powered Content & PR Distribution. Get Amplified Today.
- PlatoData.Network Vertical Generative Ai. Empower Yourself. Access Here.
- PlatoAiStream. Web3 Intelligence. Knowledge Amplified. Access Here.
- PlatoESG. Carbon, CleanTech, Energy, Environment, Solar, Waste Management. Access Here.
- PlatoHealth. Biotech and Clinical Trials Intelligence. Access Here.
- Source: https://www.analyticsvidhya.com/blog/2024/06/how-to-calculate-the-coefficient-of-variation-in-excel-google-sheets/

