
Published 2 hours ago
Ethereum Price Analysis: During March’s third-week recovery in the crypto market, the Ethereum price breached a resistance trendline of a nine-month-long bullish pattern called a symmetrical triangle pattern. Completing this pattern on a bullish note, the Ethereum price is likely to witness a massive rally in April 2023. Here’s how you may capture the upcoming bull run in ETH price.
Key Points:
- A bullish breakout from $1855 resistance will signal the resumption of the prior recovery rally.
- In the weekly time frame chart, the 20 EMA slope offers pullback support to the rising Ethereum price
- The intraday trading volume in Ether is $5.3 billion, indicating a 27% loss.
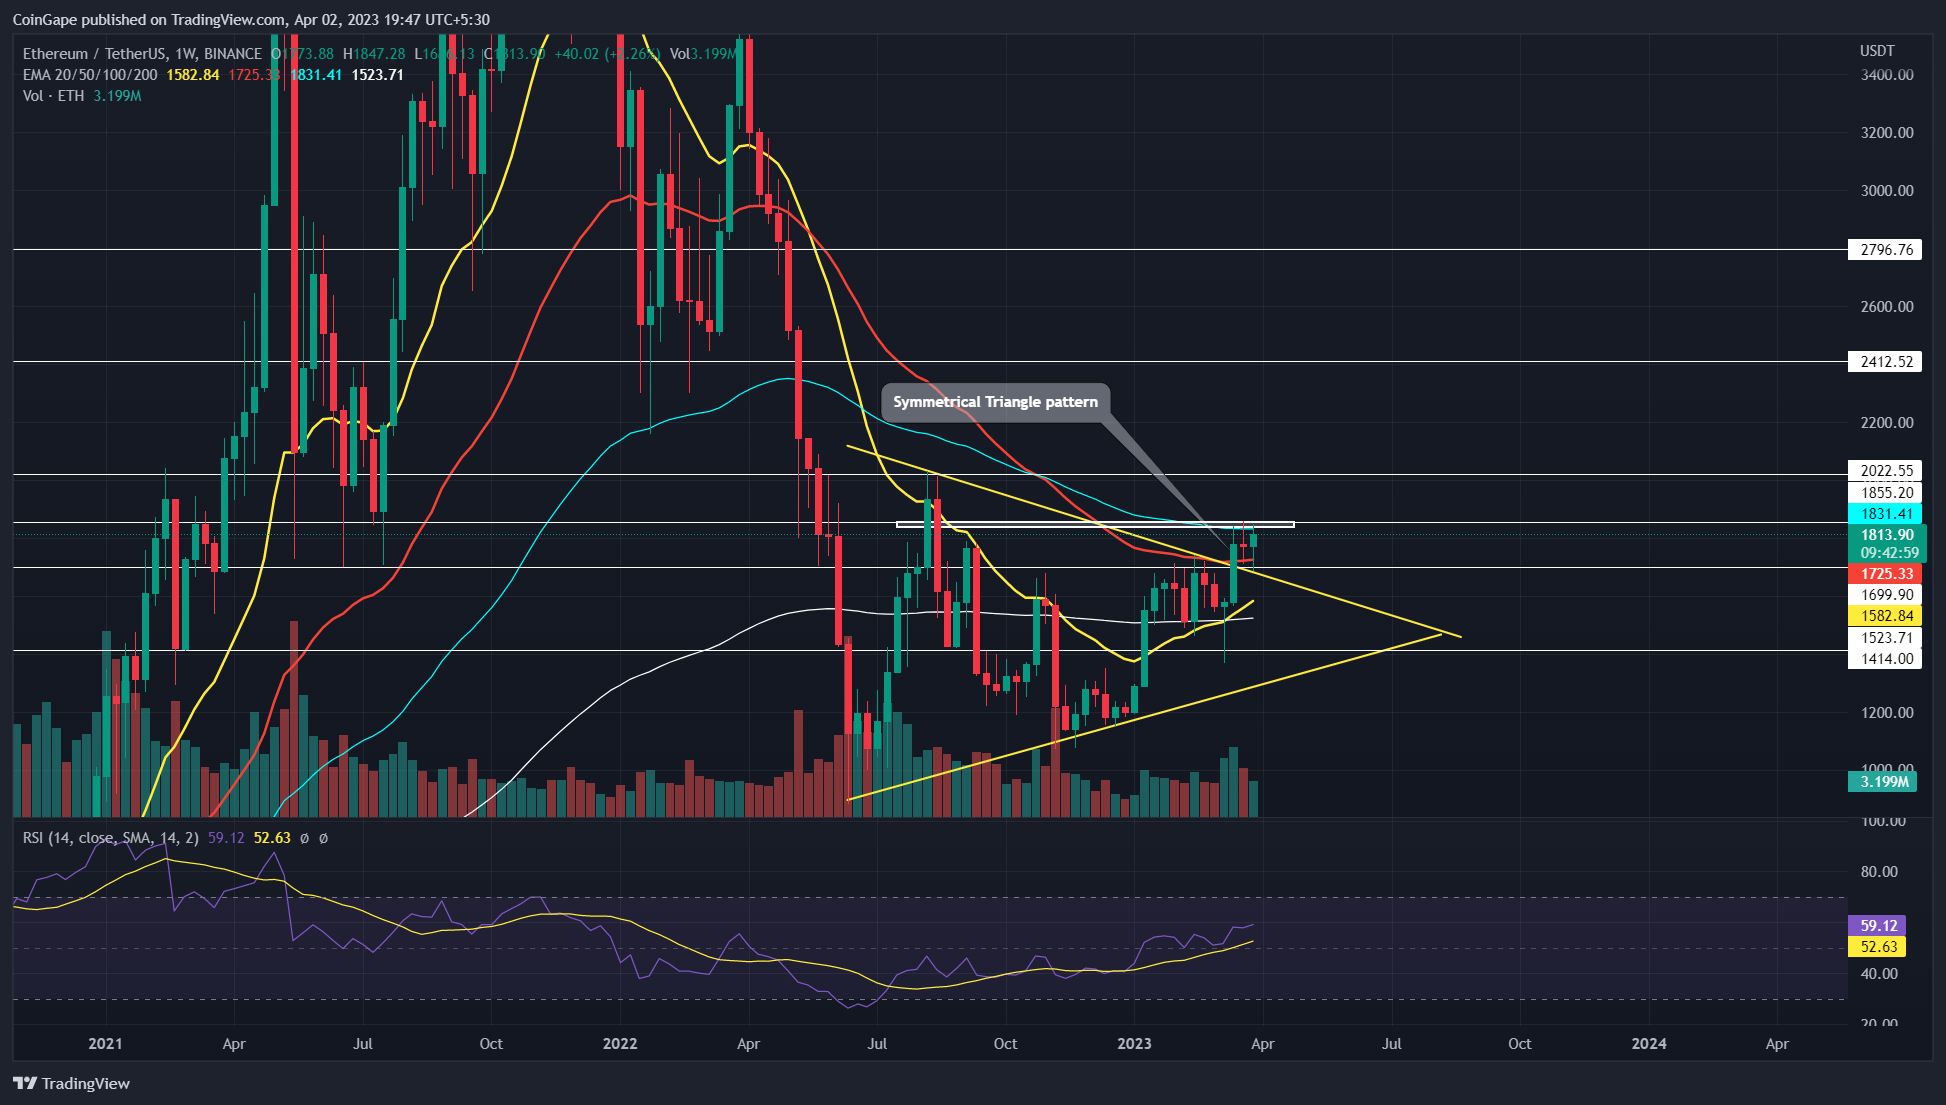
Source- Tradingview
With the completion of a symmetrical triangle pattern, Ethereum price is currently witnessing a post-breakout consolidation usually meant to check price sustainability at higher levels and recuperate bullish momentum.
Trending Stories
This sideway trend has been restricted between the buying climax of $1855 and the selling climax of $1700 creating a narrow range. Despite the increasing uncertainty in the crypto market, the ETH price managed to sustain above the $1700 support indicating the buyers are defending the newly reclaimed levels.
The lower price rejection candles in the weekly chart are a sign of buying pressure from below and a higher possibility for the bullish uptrend to continue.
Also Read: Top 6 Liquid Staking Platforms On Ethereum
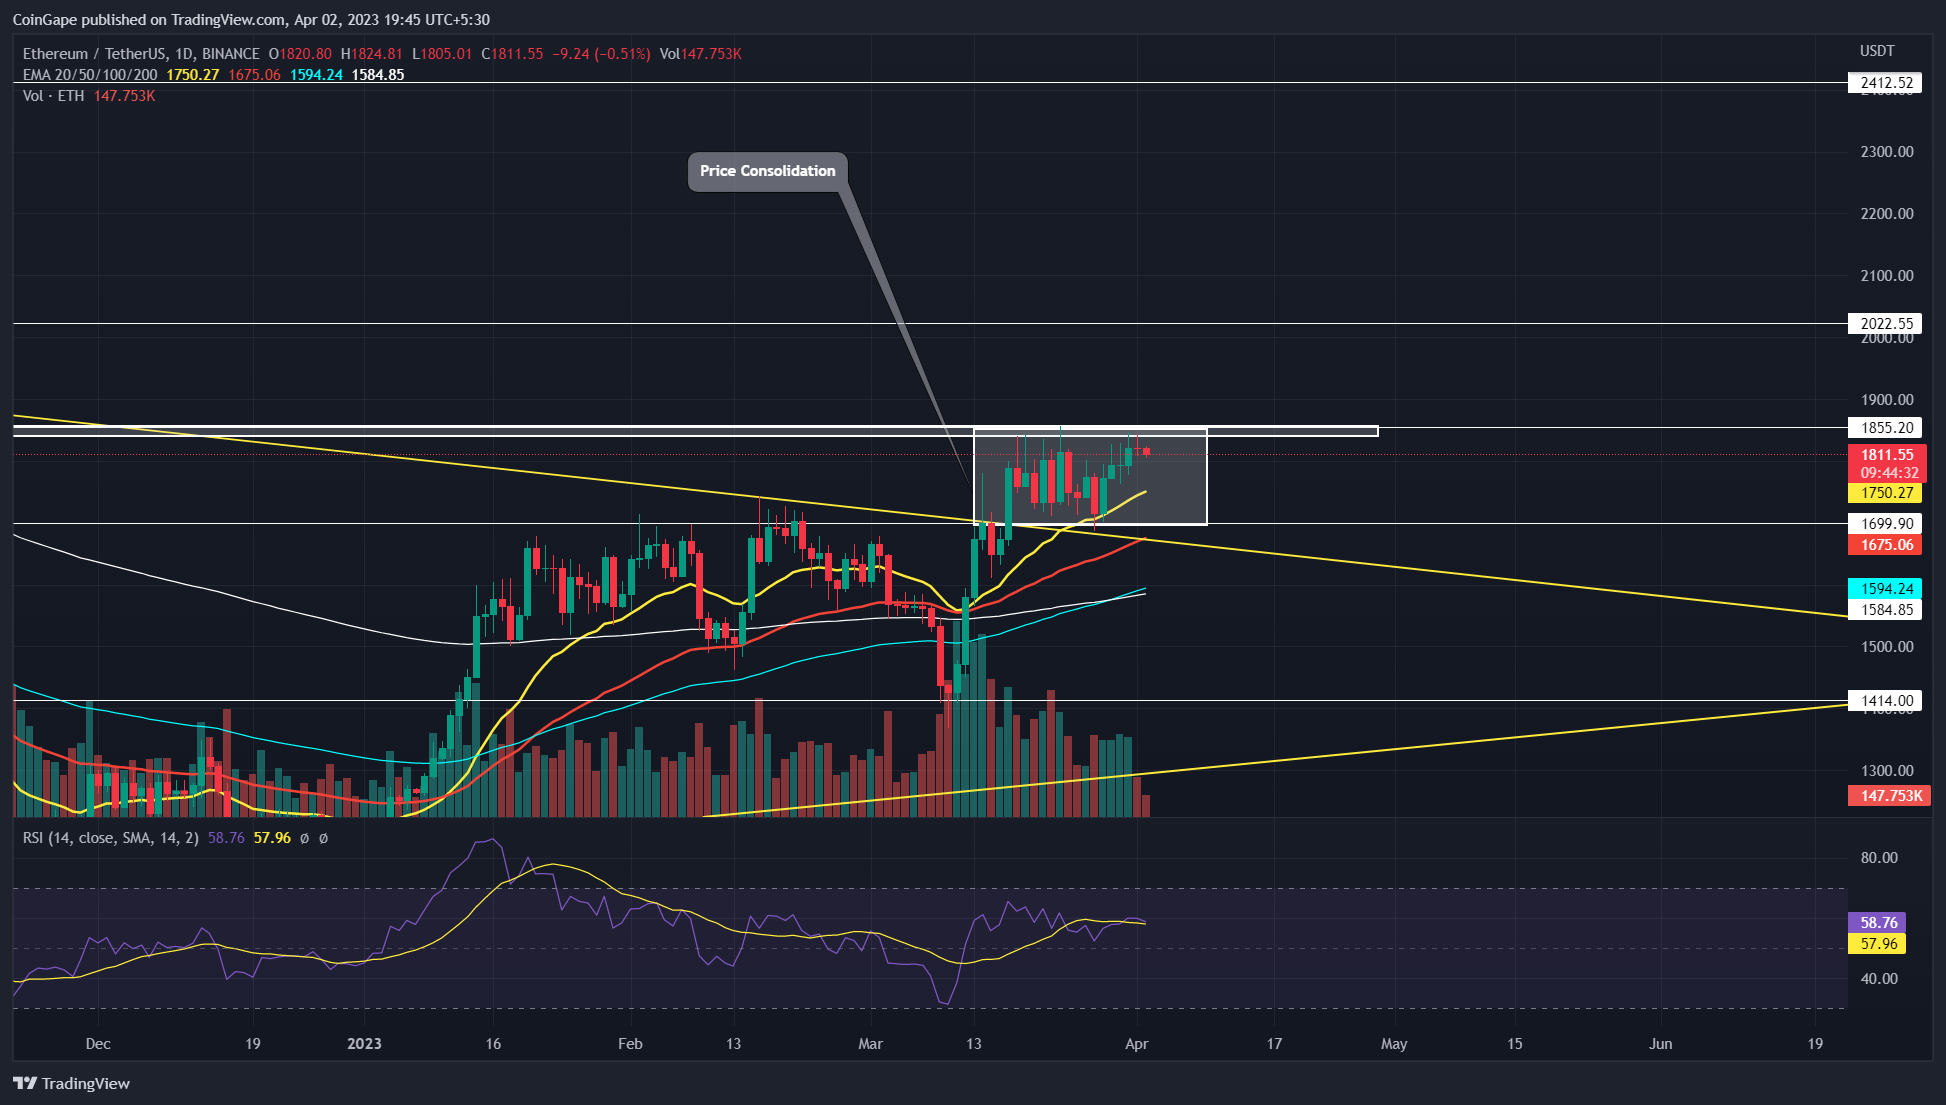
Source- Tradingview
In the daily time frame chart, the Ethereum price shows a clear view of an ongoing consolidation phase. As of now, the ETH price trades at $1812 and displays its struggles to surpass the $1855 overhead resistance.
The higher price rejection candle in the daily chart projects the overhead supply pressure is high and the price may witness another retest to $1700 before the next recovery cycle begins.
Under the influence of a symmetrical triangle pattern, a potential bullish breakout of $1855 will drive the Ethereum price to $2020, $2400, or $2800.
The long-trades can main a stop loss below the 50-day EMA slope wavering near the $1680 mark
Technical Indicator
RSI(4-hour): A gradual rise in the daily RSI slope reflects a positive sentiment among market participants for steady growth.
EMAs: The Ethereum price wobbling between the 50-and-100-weekly EMAs slope gives extra weightage to the importance of the aforementioned range.
Ethereum Coin Price Intraday Levels-
- Spot rate: $1812
- Trend: Bearish
- Volatility: High
- Resistance level- $1855 and $2020
- Support level- $1700-1680 and $1420
Share this article on:
advertisement
The presented content may include the personal opinion of the author and is subject to market condition. Do your market research before investing in cryptocurrencies. The author or the publication does not hold any responsibility for your personal financial loss.
<!– Close Story–>
- SEO Powered Content & PR Distribution. Get Amplified Today.
- Platoblockchain. Web3 Metaverse Intelligence. Knowledge Amplified. Access Here.
- Source: https://coingape.com/markets/ethereum-price-analysis-guide-for-april-2023-with-potential-target-and-stoploss/

