Expression of a dicarboxylic acid transporter and deletion of byproduct pathways
Previous introduction of the rTCA pathway into I. orientalis (strain SA) (Fig. 1B) enabled the production of SA with a titer of 11.6 g/L in shake flask fermentations13. To further improve the titer, we attempted to express a transporter for SA. MAE1 from Schizosaccharomyces pombe (SpMAE1) was found to be the most efficient dicarboxylic acid transporter for the export of SA18. The codon-optimized SpMAE1 was integrated into the genome of strain SA, resulting in strain SA/MAE1. Strains SA and SA/MAE1 were evaluated for SA production using shake flask fermentations in minimal media (SC-URA) with 50 g/L of glucose under oxygen-limited conditions. The introduction of SpMAE1 greatly improved the SA titer from 6.8 g/L to 24.1 g/L (Fig. 2, Supplementary Fig. 1A, and Supplementary Fig. 1B).
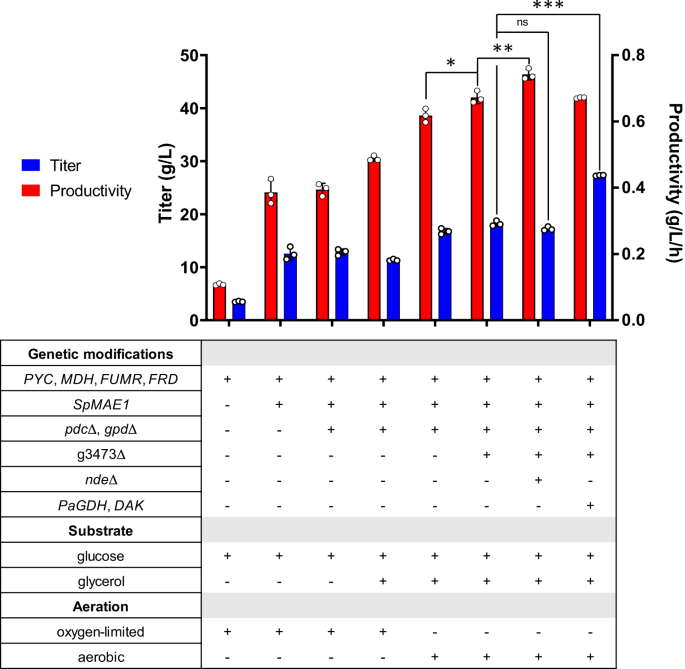
Error bars, mean ± SD (n = 3 biologically independent samples). *p < 0.05, **p < 0.01, ***p < 0.001, ns not significant, calculated by two-tailed unpaired t-test. Source data are provided as a Source Data file.
Ethanol was the major byproduct and accumulated at 9.5 g/L in the fermentation of strain SA/MAE1. Ethanol is formed by the reaction catalyzed by alcohol dehydrogenase (ADH), which uses NADH to reduce acetaldehyde to ethanol. Since the production of SA by the rTCA pathway requires NADH, eliminating the ethanol formation pathway might improve the SA production. Furthermore, although glycerol accumulated less than 1 g/L and was not the major byproduct observed in the fermentation of strain SA/MAE1, the glycerol formation pathway catalyzed by glycerol-3-phosphate dehydrogenase (GPD) can potentially compete with the rTCA pathway for carbon and NADH. Thus, both PDC (pyruvate decarboxylase) and GPD were deleted in strain SA/MAE1, resulting in strain SA/MAE1/pdc∆/gpd∆. While deletion of PDC to prevent ethanol formation should theoretically improve SA titer due to the increase in availability of both pyruvate and NADH, fermentation of strain SA/MAE1/pdc∆/gpd∆ unexpectedly resulted in the similar SA titer of 24.6 g/L and the accumulation of 19.8 g/L of pyruvate under oxygen-limited conditions (Fig. 2 and Supplementary Fig. 1C).
Recently, a genome-scale model was constructed for I. orientalis, and all ADH activities were predicted to be localized in the mitochondrion19. Thus, the removal of ethanol production through the PDC deletion should not enhance cytosolic NADH availability, leading to no increase in SA titer. Regarding cytosolic NADH balance, glycolysis produces 2 moles of pyruvates and 2 moles of NADH from 1 mole of glucose, while the conversion of 1 mole of pyruvate to 1 mole of succinic acid requires 2 moles of NADH. Thus, although the reductive TCA cycle has the highest theoretical yield, the actual yield of SA in yeasts is limited to only 1 mol/mol glucose. We conducted 13C metabolic flux analysis (MFA) and verified that the rTCA pathway efficiently used most of the cytosolic NADH produced by glycolysis for SA production and pyruvate excretion accounted for half of the pyruvate produced from the last step of glycolysis (Supplementary Fig. 2). We also expressed an additional copy of the rTCA pathway or individual gene of the pathway in strain SA/MAE1/pdc∆/gpd∆ to further modulate the carbon fluxes between pyruvate and SA, but there was no significant change in SA titer or pyruvate accumulation (Supplementary Fig. 3). Thus, the shortage of NADH supply in the cytosol is the main bottleneck for SA production through the rTCA pathway.
Co-fermentation of glucose and glycerol for SA production
Since glucose alone does not produce sufficient cytosolic NADH for SA production, other carbon sources can be considered in order to obtain higher titers and yields. Glycerol has a higher degree of reduction and thus can produce more reducing equivalents of NADH than glucose20,21. Since strain SA/MAE1/pdc∆/gpd∆ exhibited growth defects in SC-URA medium with glycerol as the sole carbon source, we sought to perform fermentation of this strain using SC-URA medium with 50 g/L of glucose and 20 g/L of glycerol. Previously, using glucose and glycerol as dual carbon sources was shown to enhance the conversion of oxaloacetate to malate through the increased supply of NADH from glycerol in an engineered M. succiniciproducens6. As shown in Supplementary Fig. 4A, the cells could consume both substrates for SA production under oxygen-limited conditions; however, the glycerol consumption was slow, and the SA titer was improved to only 30.5 g/L after 7 days of fermentation. We then performed the fermentation under aerobic conditions, postulating the glycerol metabolism might be limited at oxygen-limited conditions. Under aerobic conditions, both glucose and glycerol were consumed faster, allowing the production of 38.6 g/L of SA (Fig. 2 and Supplementary Fig. 4B). We also tested fermentation of strain SA/MAE1/pdc∆/gpd∆ using SC-URA medium with 50 g/L of glucose under aerobic conditions. Interestingly, while the rTCA pathway is a fermentative pathway and higher aeration might channel more carbon flux into the TCA cycle for aerobic respiration, we observed that aerobic conditions led to similar titers compared to the oxygen-limited conditions and the cells were able to consume glucose faster, leading to higher productivities (Supplementary Fig. 4C).
Deletions of a dicarboxylic acid importer and external NADH dehydrogenase
Further gene deletions were then attempted to increase the SA production. Recently, the JEN family carboxylate transporters PkJEN2-1 and PkJEN2-2 in Pichia kudriavzevii were characterized to be involved in the inward uptake of dicarboxylic acids22,23. PkJEN2-1 and PkJEN2-2 were annotated as g3473 and g3068 in I. orientalis, respectively. g3473 was deleted from strain SA/MAE1/pdc∆/gpd∆, leading to strain g3473∆. Fermentation of this strain in SC-URA medium with 50 g/L of glucose and 20 g/L of glycerol improved the SA titer to 42.0 g/L (Fig. 2 and Supplementary Fig. 5A), suggesting that preventing SA from re-entering the cells was beneficial. g3068 was further knocked out in strain g3473∆; however, we observed that disruption of both JEN2 transporters lowered the SA titer to 34.5 g/L and thus was not beneficial (Supplementary Fig. 5B). This result was inconsistent with the previous report that deletion of both JEN transporters in P. kudriavzevii CY902 resulted in higher SA titer than single gene deletions, which might be attributed to different genetic backgrounds. P. kudriavzevii CY902 was engineered to produce SA using the oxidative TCA (oTCA) pathway by deletion of the succinate dehydrogenase complex subunit gene SDH5, while SA production in our engineered I. orientalis SD108 was achieved using the rTCA pathway. Moreover, based on MFA, a small amount of cytosolic NADH was oxidized by the external mitochondrial NADH dehydrogenase (NDE), which transports electrons from cytosolic NADH to the mitochondrial electron transport chain (Supplementary Fig. 2). NDE was targeted for disruption in strain g3473∆, resulting in strain g3473∆/nde∆. Compared to strain g3473∆, NDE deletion further improved the SA titer to 46.4 g/L, suggesting the knockout of NDE increased the cytosolic NADH pool for the production of SA (Fig. 2 and Supplementary Fig. 5C). Nevertheless, the disruption of NDE lowered the glucose consumption rate; hence, despite having higher titer, strain g3473∆/nde∆ had similar productivity as strain g3473∆ (Fig. 2).
Improving glycerol consumption
The slow glycerol consumption indicated the endogenous glycerol metabolism might not be highly active. Previously, overexpression of glycerol dehydrogenase (GDH) from Pichia angusta and endogenous dihydroxyacetone kinase (DAK) established an NADH-producing glycerol consumption pathway in S. cerevisiae24. Thus, we sought to employ a similar strategy to improve the glycerol consumption in I. orientalis. The codon optimized PaGDH and endogenous DAK were overexpressed in strains g3473∆ and g3473∆/nde∆, resulting in strains g3473∆/PaGDH-DAK and g3473∆/nde∆/PaGDH-DAK, respectively. Fermentations of these strains in SC-URA medium with 50 g/L of glucose and 20 g/L of glycerol did not lead to higher titers of SA; g3473∆/PaGDH-DAK and g3473∆/nde∆/PaGDH-DAK produced SA at titers of 41.9 g/L and 46.5 g/L, respectively, similar to the titers achieved by the parent strains lacking the overexpression of PaGDH and DAK (Fig. 2, Supplementary Fig. 6A, and Supplementary Fig. 6B). However, the overexpression of PaGDH and DAK was beneficial to both glucose and glycerol utilization rates. The productivities were increased from 0.29 to 0.44 g/L/h in strain g3473∆/PaGDH-DAK and from 0.28 to 0.32 g/L/h in strain g3473∆/nde∆/PaGDH-DAK (Fig. 2 and Supplementary Fig. 6C).
Strain g3473∆/PaGDH-DAK could produce 25.4 g/L of SA in fermentation using 50 g/L glucose, while 41.9 g/L of SA could be obtained from 50 g/L of glucose and 20 g/L of glycerol (Supplementary Fig. 7A). Since the SA titer of 41.9 g/L could also be achieved just by simply using more initial glucose in the fermentation using only glucose, one may question the advantages of using glucose and glycerol as dual carbon sources. On a carbon equivalent basis, 1 gram of glucose is equivalent to 1 gram of glycerol. Using 50 g/L of glucose and 20 g/L of glycerol enabled the SA yield of 0.60 g/g glucose equivalent, which was higher than the yield of 0.51 g/g glucose from fermentation using only 50 g/L glucose (Supplementary Fig. 7B). Furthermore, from 70 g/L of glucose, a concentration equivalent to 50 g/L of glucose and 20 g/L of glycerol, strain g3473∆/PaGDH-DAK could produce SA at titer of only 35.6 g/L and yield of 0.50 g/g glucose (Supplementary Fig. 7). Therefore, utilizing a mixture of glucose and glycerol as carbon sources allowed SA production at higher titers and higher yields than using equivalent amount of glucose. We also compared the SA production in strain g3473∆/PaGDH-DAK using 50 g/L of glucose and different glycerol concentrations of 10 g/L, 20 g/L, and 30 g/L (Supplementary Fig. 8). As expected, SA titer increased as the initial amount of glycerol increased; thus, a comparison between titers was not meaningful. Also, the yield was lowest when 10 g/L of glycerol were used. No significant difference in yields was observed when 20 g/L and 30 g/L of glycerol were used; however, the productivity was highest when 20 g/L of glycerol were used. Thus, we considered 20 g/L of glycerol to be the optimal concentration to use with 50 g/L of glucose for the SA production.
We also attempted to relieve the catabolite repression of glucose on the glycerol consumption through the deletion of a hexokinase, which was shown to reduce the glucose phosphorylation rate and permit the co-utilization of glucose and xylose in S. cerevisiae25. Through BLAST analysis, three potential hexokinase genes (g1398, g2945, and g3837) were determined, and only the deletion of g3837 in strain g3473∆/PaGDH-DAK enabled the simultaneous consumption of both glucose and glycerol (Supplementary Fig. 9). While similar SA titers could be achieved, g3837 deletion lowered the glucose and glycerol consumption rates, leading to no increase in the productivity.
Fed-batch fermentations and scale-up
Following the shake flask fermentations, we performed fed-batch fermentations to increase the titer of SA and to assess the performance of our engineered strain in large-scale production. To exploit the superior tolerance to low pH of I. orientalis, we chose to perform the fed-batch fermentations at pH 3. At this pH, approximately 90% of the SA species are fully protonated SA, while the remaining 10% of the species are hydrogen succinate26. We first tested the performance of strain g3473∆/PaGDH-DAK, which was chosen over g3473∆/nde∆/PaGDH-DAK due to higher productivity, using SC-URA medium with 50 g/L of glucose and 20 g/L of glycerol in batch fermentation in a bench-top bioreactor with a size of 0.3 L and a working volume of 0.1 L under static conditions of agitation and continuous sparging of O2 and CO2. We observed that the titers (27.1 g/L and 30.7 g/L at 0.333 vvm (volume per working volume per min) of CO2 and 0.667 vvm of CO2, respectively) were much lower than the titer obtained in shake flask fermentation (42.1 g/L) (Supplementary Fig. 10A, B). Particularly, while similar titers of SA could be produced from glucose in both reactor and shake flask, the SA titers produced during glycerol utilization phase were much lower in the bioreactor. We also conducted batch fermentation in bioreactor using strain g3473∆/PaGDH-DAK/g3837∆ and observed that this strain could produce more SA during the glycerol consumption phase and a titer of 38.8 g/L of SA could be obtained at 0.167 vvm of O2 and 0.667 vvm of CO2 (Supplementary Fig. 10C, D). We postulated that while glycerol was being utilized in the bioreactor environment with higher aeration than the shake flask environment, more carbon flux might be channeled to the TCA cycle and led to lower SA titer; on the other hand, deletion of g3837 might repress the activity of the TCA cycle genes and improve SA production. Real-time PCR analysis was employed to compare the transcriptional levels of genes in the rTCA pathway and some selected genes in the TCA cycle (citrate synthase, CIT; aconitase, ACO; and isocitrate dehydrogenase, IDH) in strains g3473∆/PaGDH-DAK with or without g3837 deletion grown in YP medium with glycerol. We observed that knockout of g3837 maintained similar expressions of genes in the rTCA pathway but lowered the expression levels of CIT, a homolog of ACO, and IDHs (Supplementary Fig. 11). Thus, the lower activities of genes in the TCA cycle might lead to higher SA titer obtained by strain g3473∆/PaGDH-DAK/g3837∆ in the bioreactor. The fed-batch fermentation of strain g3473∆/PaGDH-DAK/g3837∆ in SC-URA medium with glucose and glycerol feeding produced 109.5 g/L of SA with a yield of 0.65 g/g glucose equivalent and a productivity of 0.54 g/L/h (Fig. 3A). At the end of the fermentation, we observed the formation of crystals, which was likely SA (Supplementary Fig. 12). While other organic acids, such as lactic and acetic acids, are fully miscible in aqueous broth at pH 1–14, the solubility of SA decreases as the pH becomes more acidic27.
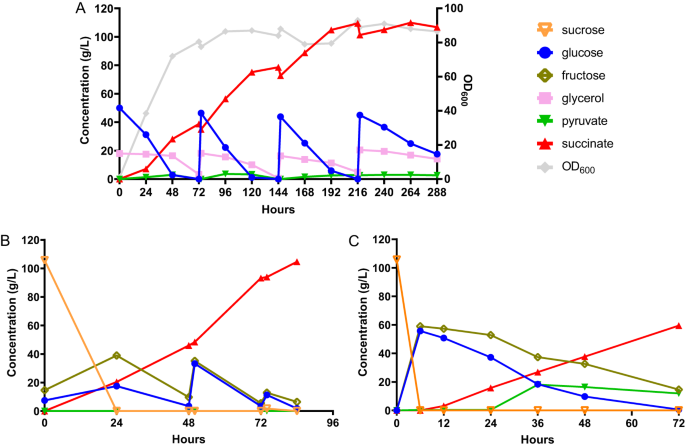
A Fed-batch fermentation of strain g3473∆/PaGDH-DAK/g3873∆ in minimal medium with glucose and glycerol. B Fed-batch fermentation of strain g3473∆/PaGDH-DAK/ScSUC2 in sugarcane juice medium. C Batch fermentation of strain g3473∆/PaGDH-DAK/ScSUC2 in sugarcane juice medium in a pilot-scale reactor. Source data are provided as a Source Data file.
Following the high fermentative performance of our recombinant I. orientalis strain using the minimal medium commonly used in the laboratory, we then tested the production of SA using a real industrial substrate, sugarcane juice. Sugarcane is the most energy-efficient perennial C4 plant and has a higher biomass yield compared to other crops such as switchgrass and miscanthus28. Furthermore, sugarcane juice, as a sucrose-based feedstock, is cheaper than glucose and starch-based substrates such as corn and cassava29. Since I. orientalis is unable to utilize sucrose, the invertase SUC2 from S. cerevisiae was expressed in g3473∆/PaGDH-DAK. Batch fermentation occurred in the first 48 h, and SA could be produced at a titer of 46.0 g/L, a yield of 0.40 g/g glucose equivalent, and a productivity of 0.96 g/L/h. With feeding of concentrated sugarcane juice afterwards, our engineered strain could produce SA at a titer of 104.6 g/L, a yield of 0.63 g/g glucose equivalent, and a productivity of 1.25 g/L/h at the bench scale (Fig. 3B).
Furthermore, we scaled up our SA fermentation process using sugarcane juice from the bench scale to a pilot scale. Here, we determined the process parameters to maintain similar power input per unit volume and the same Reynolds number between bench-scale and pilot-scale bioreactors, and batch fermentation was performed in a pilot-scale bioreactor with a size of 75 L and a working volume of 30 L or a scale-up factor of 300× compared to the bench-top bioreactor. Our strain could produce SA at a titer of 63.1 g/L, a yield of 0.50 g/g glucose equivalent, and a productivity of 0.66 g/L/h at pH 3 (Fig. 3C). Due to the volume requirement, we did not attempt a fed-batch fermentation at the pilot scale; nevertheless, our titer and yield for the batch fermentation in the pilot-scale bioreactor were comparable to those in the bench-scale bioreactors. Thus, we anticipated a similar performance of the strain in fed-batch fermentation at the pilot scale.
We further completed the full production process of SA by devising a DSP to recover SA from sugarcane juice fermentation broth using two-stage vacuum distillation and crystallization. Without further acidification of the fermentation broth containing 63.1 g/L SA obtained from the pilot-scale fermentation, the maximum yield was 31.0% during the first stage. The filtrate from stage 1 was then concentrated to 50% of its volume using vacuum distillation and subjected to the second stage of crystallization. The yield of SA from stage 2 was 47.7%, and similar amounts of SA crystal were obtained for both stages (1.98 g for stage 1 and 2.10 g for stage 2). Thus, via two-stage vacuum distillation and crystallization, the overall SA recovery yield of 64.0% from the low-pH fermentation broth was obtained. Furthermore, the purities of SA crystals recovered in stage 1 and stage 2 were estimated to be 88.9% and 86.23%, respectively. The obtained result was in line with the findings from a previous study30. From the results, it was evident that the crystallization of SA in high purity (>85%) from the untreated fermentation broth was successful. However, further investigation is needed to eliminate the coloring impurities to recover SA crystal of commercial grade.
Techno-economic analysis and life cycle assessment
We designed and simulated end-to-end biorefineries capable of accepting sugarcane as a feedstock, saccharifying it to sugarcane juice (sucrose, glucose, and fructose), fermenting the sugars to SA using I. orientalis, and separating the fermentation broth to recover dried SA crystals (Supplementary Fig. 13) at an annual production capacity of 26,800 metric tonnes of SA (the global demand for SA in 2013 was approximately 76,000 metric tonnes31). The biorefineries were simulated under alternative fermentation scenarios with assumptions for yield, titer, and productivity corresponding to the fermentation performance achieved in laboratory-scale batch mode (laboratory batch scenario) and fed-batch mode (laboratory fed-batch scenario) experiments as well as the pilot-scale batch mode setup (pilot batch scenario). To characterize the financial viability and environmental benefits of the developed SA pathways, we performed TEA and LCA for each scenario under baseline assumptions as well as under uncertainty (2000 Monte Carlo simulations for each scenario with Latin hypercube sampling; the distribution of results at alternative numbers of Monte Carlo simulations is reported in Supplementary Table 1 and the assumed baseline values and distributions of all uncertain parameters for each scenario are reported in Supplementary Data 1). We used the minimum product selling price (MPSP, in 2016$ with an internal rate of return of 10%), 100-year global warming potential (GWP100; cradle-to-grave), and fossil energy consumption (FEC; cradle-to-gate) as metrics to represent the TEA and LCA results. We also performed sensitivity analyses using Spearman’s rank order correlation coefficients (Spearman’s ρ) to identify key drivers of production costs and environmental impacts. Finally, to set and prioritize targets for further improvements to financial viability and environmental sustainability, we designed and simulated biorefineries across the potential fermentation performance landscape (i.e., 2500 yield-titer combinations each across a range of productivities for both neutral and low-pH fermentation).
Based on the experimental performance in the laboratory batch scenario, the biorefinery could produce SA at an estimated MPSP of $1.70/kg (baseline; Fig. 4A) with a range of $1.51–1.92/kg (5th–95th percentiles; hereafter in brackets). The biorefinery’s GWP100 and FEC under this scenario were estimated to be 1.95 kg CO2-eq./kg (1.37–2.65 kg CO2-eq./kg) and -3.74 MJ/kg (−12.9–5.39 MJ/kg), respectively (Fig. 4B and Supplementary Fig. 14A). In the laboratory fed-batch scenario (with improved fermentation SA titer, yield, and productivity over that of the laboratory batch scenario), the biorefinery’s MPSP was $1.06/kg ($0.96–1.22/kg), GWP100 was 0.93 kg CO2-eq./kg (0.71–1.32 kg CO2-eq./kg), and FEC was −5.36 MJ/kg (−8.97–0.213 MJ/kg). In the pilot batch scenario (with fermentation SA yield and titer improved relative to the laboratory batch scenario but lower than those of the laboratory fed-batch scenario, and lower productivity than both laboratory scenarios), the biorefinery had an estimated MPSP of $1.37/kg ($1.23–1.54/kg), GWP100 of 1.67 kg CO2-eq./kg (1.22–2.17 kg CO2-eq./kg), and FEC of −0.21 MJ/kg (−7.08 to 6.47 MJ/kg). A Sankey diagram depicting the flow of carbon through the biorefinery for this scenario was also shown in Supplementary Fig. 15.
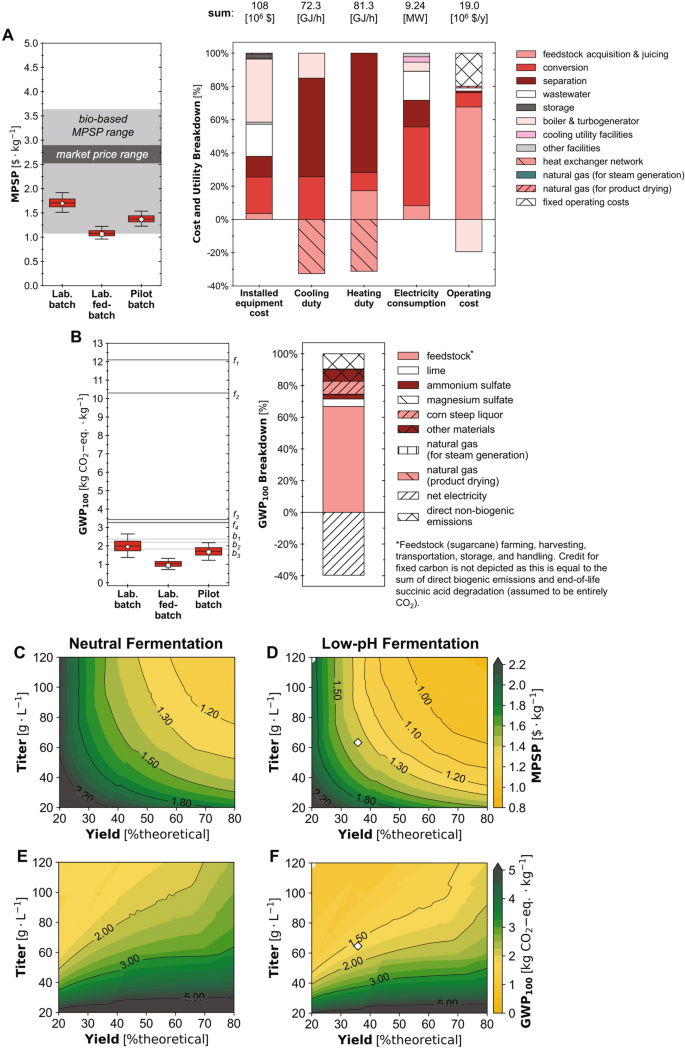
Uncertainties (box and whisker plots) and breakdowns (stacked bar charts) for (A) minimum product selling price (MPSP) and (B) cradle-to-grave 100-year global warming potential (GWP100). Whiskers, boxes, and the middle line represent 5th/95th, 25th/75th, and 50th percentiles from 2000 Monte Carlo simulations (n = 2000 simulations) for each scenario. Pentagon, square, and diamond markers represent baseline results for the laboratory batch (Lab. batch) laboratory fed-batch (Lab. fed-batch), and pilot batch (Pilot batch) scenarios, respectively. Stacked bar charts report baseline results for the pilot batch scenario; results for other scenarios are included in the SI. Electricity consumption includes only the consumption of the system; production was excluded in the depicted breakdown for figure clarity. Tabulated breakdown data for material and installed equipment costs, heating and cooling duties, electricity usage, GWP100, and FEC are available online62. Labeled dark gray lines denote reported impacts for fossil-based production pathways (f152; f2-f451). Labeled light gray lines denote reported impacts for alternative bio-based production pathways (b151; b253; b352). Where GWP100 was reported as cradle-to-gate, 1.49 kg CO2-eq./kg was added as end-of-life impacts for consistency with this study and Dunn et al. 2015. Values for all reported MPSPs and impacts before and after adjustment are listed in Supplementary Table 3 and 4. (C, D) MPSP and (E, F) GWP100 across 2500 fermentation yield-titer combinations at the baseline productivity of the pilot batch scenario (0.66 g/L/h) for neutral (left panel; C, E) and low-pH (right panel; D, F) fermentation. Yield is shown as % of the theoretical maximum (%theoretical) scaled to the theoretical maximum yield of 1.31 g/g-glucose-equivalent (based on carbon balance). For a given point on the figure, the x-axis value represents the yield, the y-axis value represents the titer, and the color and contour lines represent the value of MPSP, GWP100. Diamond markers show baseline results for the pilot batch scenario. Source data are provided as a Source Data file.
Across the 28 parameters to which uncertainty was attributed for the pilot batch scenario, we found MPSP was most sensitive to fermentation SA yield (Spearman’s ρ of −0.60; all uncertainty distributions are listed in Supplementary Data 1 and Spearman’s ρ values for all parameters are reported in Supplementary Table 2). MPSP was also significantly sensitive to feed sugarcane unit price (Spearman’s ρ of 0.39), plant uptime (−0.38), the plant’s capacity for feed sugarcane (−0.31), and fermentation SA titer (−0.30). GWP100 was most sensitive to the boiler efficiency (Spearman’s ρ of −0.63). GWP100 was also significantly sensitive to fermentation SA titer and yield, with Spearman’s ρ values of −0.62 and 0.32, respectively. FEC was most sensitive to fermentation SA yield (Spearman’s ρ of 0.63), and also sensitive to the boiler efficiency (−0.56) and fermentation SA titer (−0.49). To further characterize the implications of fermentation performance, we performed TEA and LCA across the fermentation performance landscape (Fig. 4C–F and Supplementary Fig. 14B, C), simulating 2500 yield-titer combinations across a range of productivities for each of two alternative regimes: low-pH fermentation (i.e., with fermentation at a pH of 3 controlled using base addition during fermentation and no acidulation required after fermentation) and neutral fermentation (i.e., with complete neutralization of SA by base addition during fermentation and complete re-acidulation after fermentation). Results for an alternative low-pH scenario with re-acidulation required after fermentation were shown in Supplementary Fig. 16.
- SEO Powered Content & PR Distribution. Get Amplified Today.
- PlatoData.Network Vertical Generative Ai. Empower Yourself. Access Here.
- PlatoAiStream. Web3 Intelligence. Knowledge Amplified. Access Here.
- PlatoESG. Carbon, CleanTech, Energy, Environment, Solar, Waste Management. Access Here.
- PlatoHealth. Biotech and Clinical Trials Intelligence. Access Here.
- Source: https://www.nature.com/articles/s41467-023-41616-9

