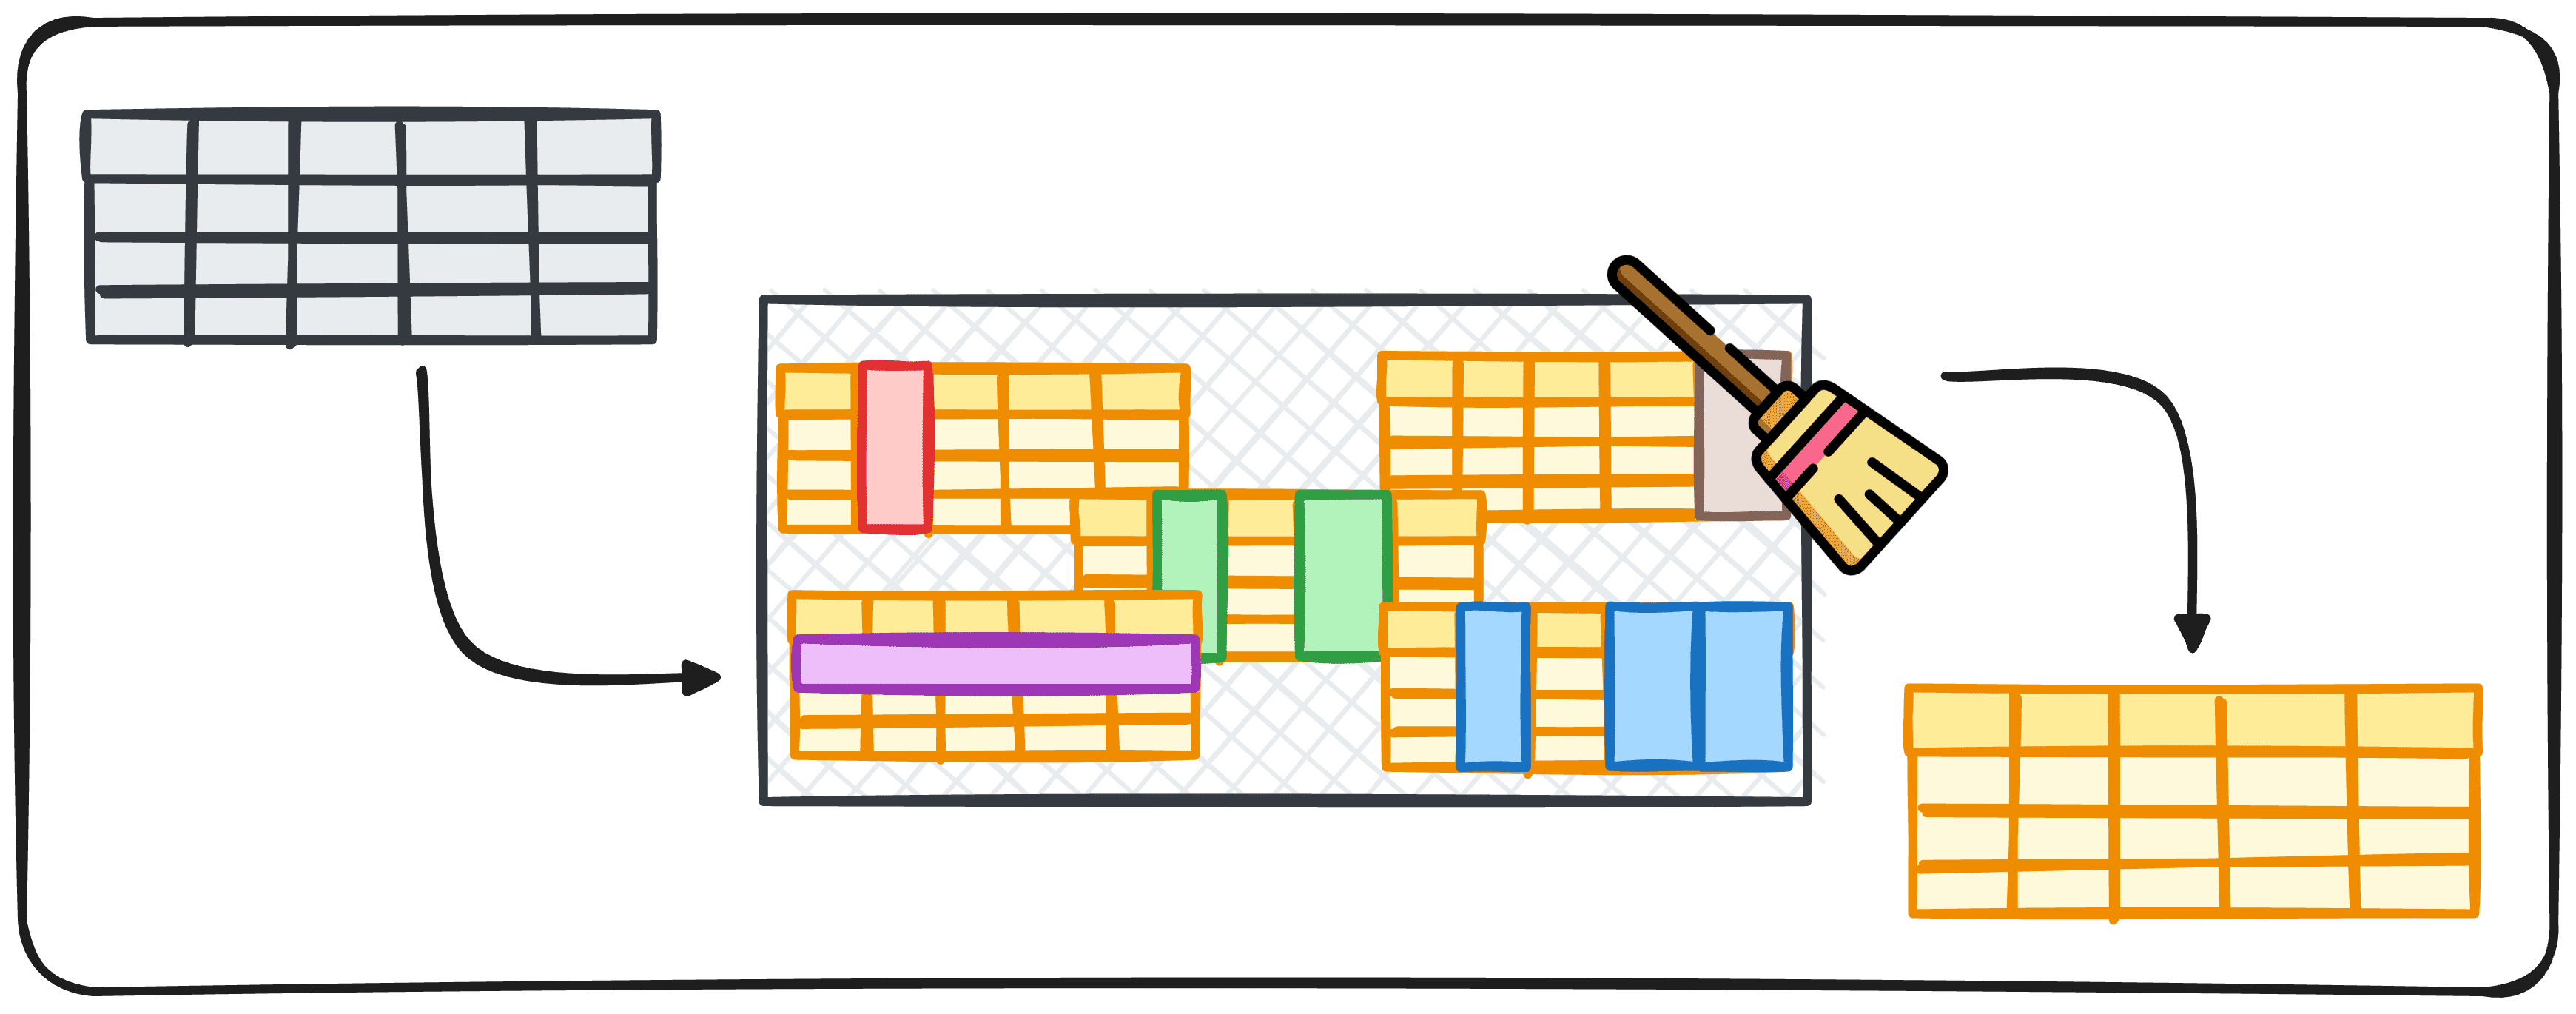
Image by Author
It is a widely spread fact among Data Scientists that data cleaning makes up a big proportion of our working time. However, it is one of the least exciting parts as well. So this leads to a very natural question:
Is there a way to automate this process?
Automating any process is always easier said than done since the steps to perform depend mostly on the specific project and goal. But there are always ways to automate, at least, some of the parts.
This article aims to generate a pipeline with some steps to make sure our data is clean and ready to be used.
Data Cleaning Process
Before proceeding to generate the pipeline, we need to understand what parts of the processes can be automated.
Since we want to build a process that can be used for almost any data science project, we need to first determine what steps are performed over and over again.
So when working with a new data set, we usually ask the following questions:
- What format does the data come in?
- Does the data contain duplicates?
- Does the data contain missing values?
- What data types does the data contain?
- Does the data contain outliers?
These 5 questions can easily be converted into 5 blocks of code to deal with each of the questions:
1.Data Format
Data can come in different formats, such as JSON, CSV, or even XML. Every format requires its own data parser. For instance, pandas provide read_csv for CSV files, and read_json for JSON files.
By identifying the format, you can choose the right tool to begin the cleaning process.
We can easily identify the format of the file we are dealing with using the path.plaintext function from the os library. Therefore, we can create a function that first determines what extension we have, and then applies directly to the corresponding parser.
2. Duplicates
It happens quite often that some rows of the data contain the same exact values as other rows, what we know as duplicates. Duplicated data can skew results and lead to inaccurate analyses, which is not good at all.
This is why we always need to make sure there are no duplicates.
Pandas got us covered with the drop_duplicated() method, which erases all duplicated rows of a dataframe.
We can create a straightforward function that utilizes this method to remove all duplicates. If necessary, we add a columns input variable that adapts the function to eliminate duplicates based on a specific list of column names.
3. Missing Values
Missing data is a common issue when working with data as well. Depending on the nature of your data, we can simply delete the observations containing missing values, or we can fill these gaps using methods like forward fill, backward fill, or substituting with the mean or median of the column.
Pandas offers us the .fillna() and .dropna() methods to handle these missing values effectively.
The choice of how we handle missing values depends on:
- The type of values that are missing
- The proportion of missing values relative to the number of total records we have.
Dealing with missing values is a quite complex task to perform – and usually one of the most important ones! – you can learn more about it in the following article.
For our pipeline, we will first check the total number of rows that present null values. If only 5% of them or less are affected, we will erase these records. In case more rows present missing values, we will check column by column and will proceed with either:
- Imputing the median of the value.
- Generate a warning to further investigate.
In this case, we are assessing the missing values with a hybrid human validation process. As you already know, assessing missing values is a crucial task that can not be overlooked.
When working with regular data types we can proceed to transform the columns directly with the pandas .astype() function, so you could actually modify the code to generate regular conversations.
Otherwise, it is usually too risky to assume that a transformation will be performed smoothly when working with new data.
5. Dealing with Outliers
Outliers can significantly affect the results of your data analysis. Techniques to handle outliers include setting thresholds, capping values, or using statistical methods like Z-score.
In order to determine if we have outliers in our dataset, we use a common rule and consider any record outside of the following range as an outlier. [Q1 — 1.5 * IQR , Q3 + 1.5 * IQR]
Where IQR stands for the interquartile range and Q1 and Q3 are the 1st and the 3rd quartiles. Below you can observe all the previous concepts displayed in a boxplot.
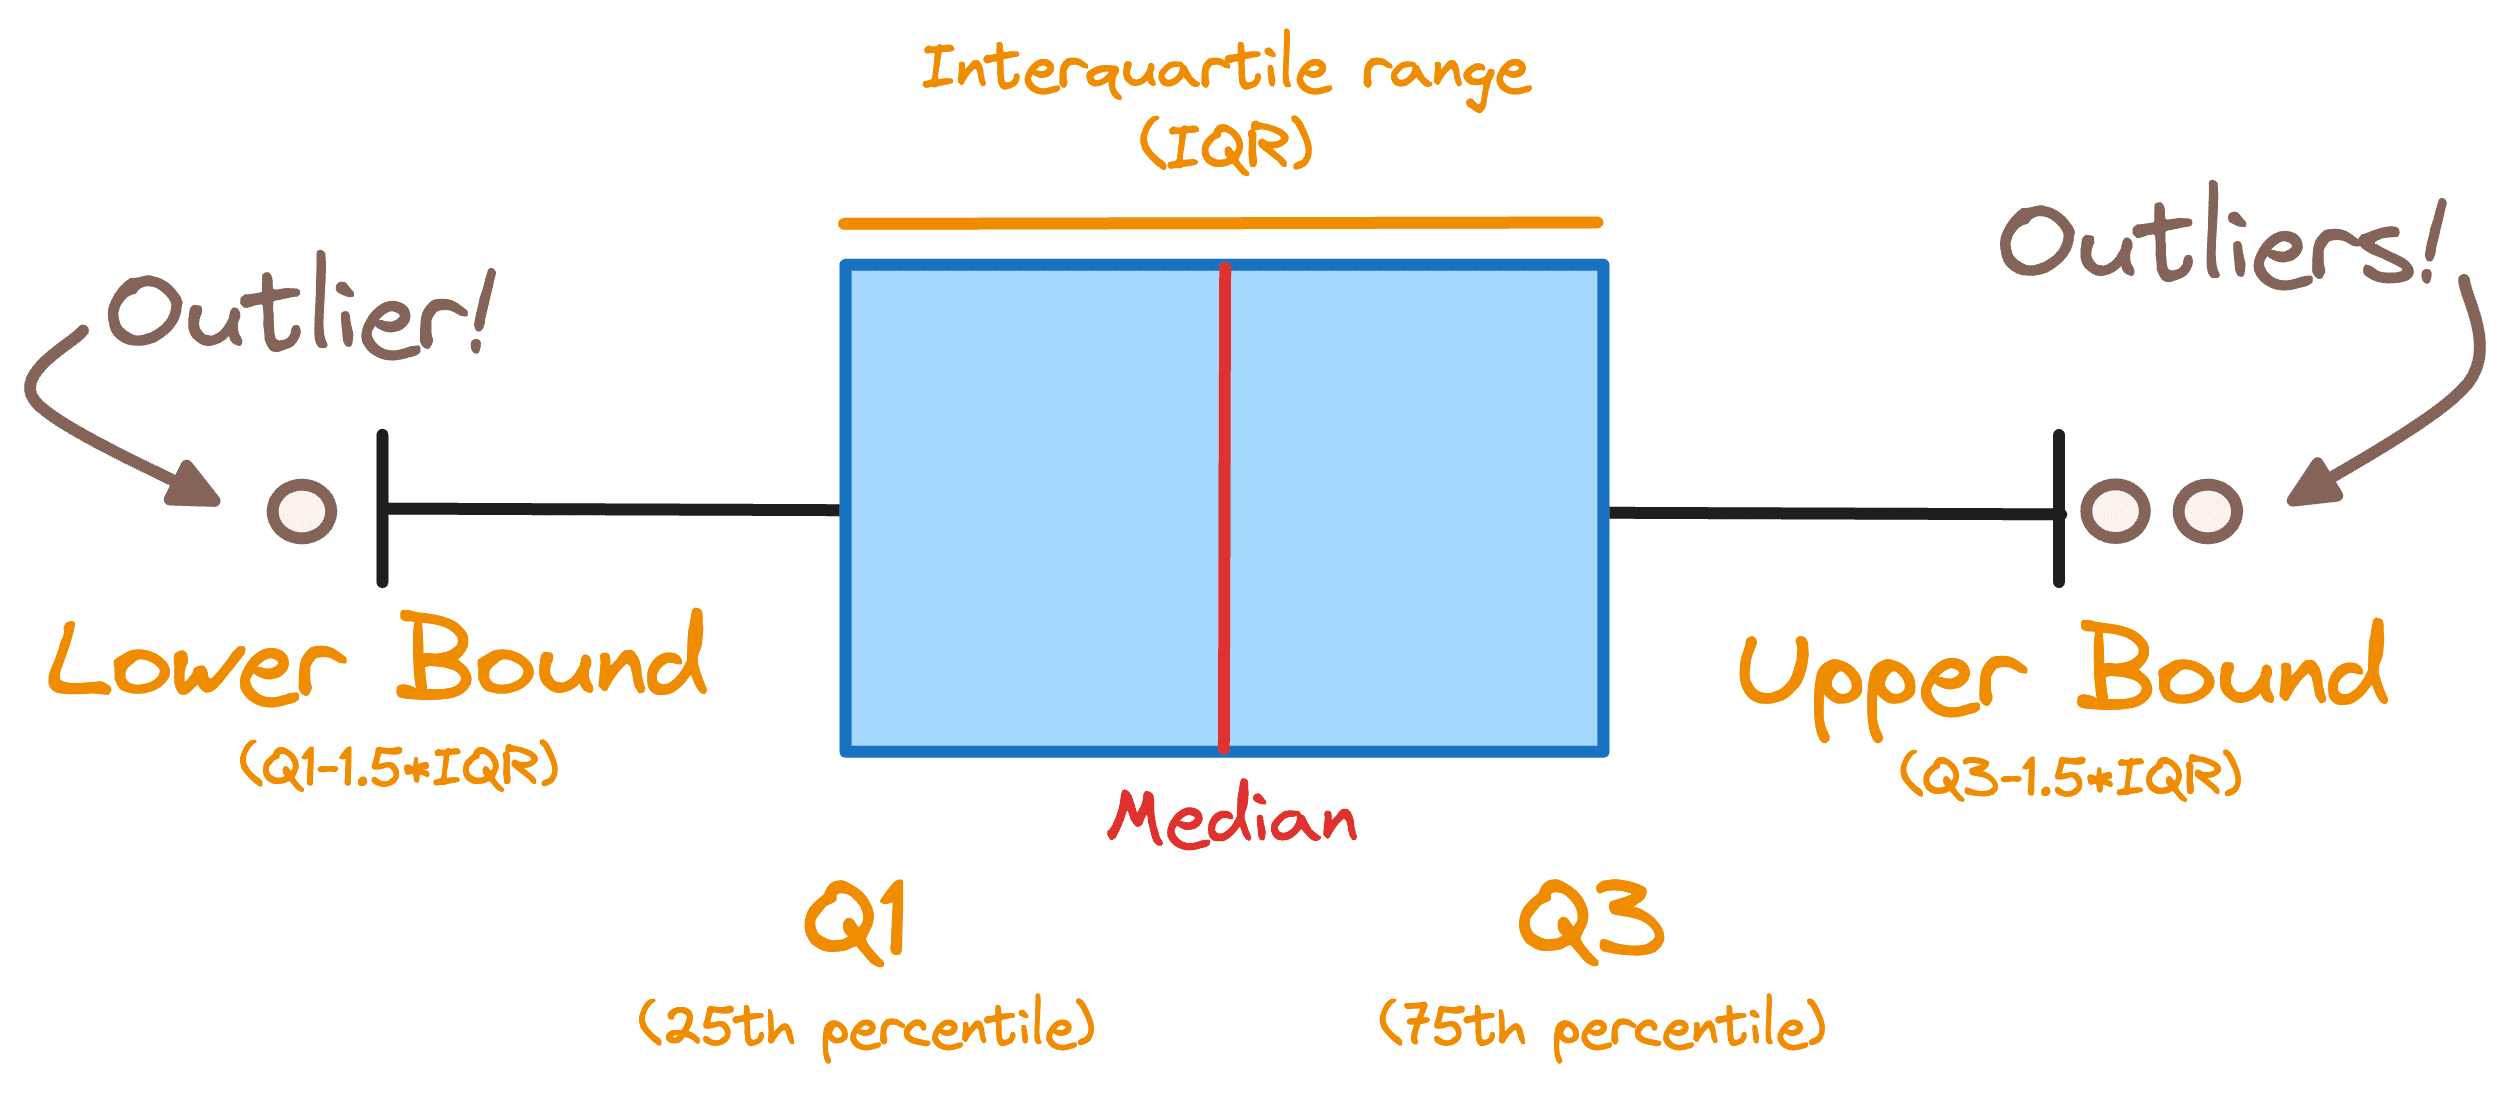
Image by Author
To detect the presence of outliers, we can easily define a function that checks what columns present values that are out of the previous range and generate a warning.
Final Thoughts
Data Cleaning is a crucial part of any data project, however, it is usually the most boring and time-wasting phase as well. This is why this article effectively distills a comprehensive approach into a practical 5-step pipeline for automating data cleaning using Python and.
The pipeline is not just about implementing code. It integrates thoughtful decision-making criteria that guide the user through handling different data scenarios.
This blend of automation with human oversight ensures both efficiency and accuracy, making it a robust solution for data scientists aiming to optimize their workflow.
You can go check my whole code in the following GitHub repo.
Josep Ferrer is an analytics engineer from Barcelona. He graduated in physics engineering and is currently working in the data science field applied to human mobility. He is a part-time content creator focused on data science and technology. Josep writes on all things AI, covering the application of the ongoing explosion in the field.
- SEO Powered Content & PR Distribution. Get Amplified Today.
- PlatoData.Network Vertical Generative Ai. Empower Yourself. Access Here.
- PlatoAiStream. Web3 Intelligence. Knowledge Amplified. Access Here.
- PlatoESG. Carbon, CleanTech, Energy, Environment, Solar, Waste Management. Access Here.
- PlatoHealth. Biotech and Clinical Trials Intelligence. Access Here.
- Source: https://www.kdnuggets.com/5-simple-steps-to-automate-data-cleaning-with-python?utm_source=rss&utm_medium=rss&utm_campaign=5-simple-steps-to-automate-data-cleaning-with-python

