- USD/JPY cleared above 145.50/146.10 resistance that confluences with BoJ’s FX intervention conducted on 22 September last year.
- Primary driver of USD/JPY rallies has been a weak Chinese yuan and rising sovereign yield premium of the 10-year US Treasury over the 10-year JGB.
- The next medium-term resistance to watch will be at 148.20/85 on the USD/JPY.
This is a follow-up analysis of our prior report, “USD/JPY Technical: Lethargic bulls below 145.50” published on 14 August 2023. Click here for a recap.
The USD/JPY has moved up relentlessly and cleared above 145.50/146.10 resistance that coincided with Bank of Japan (BoJ) FX intervention on 22 September last year to negate the JPY weakness seen in the prior major uptrend phase from the January 2021 low to Oct 2022 high, its first market intervention since 1998. It closed higher yesterday, 16 August at 146.36, near its intraday high of 146.41 printed in the US session.
So far, it has rallied by 850 pips from its 28 July 2023 low of 138.06, ex-post BoJ newly enacted flexible yield curve control programme on the 10-year Japanese Government Bond (JGB) and ignored the concerns of another round of FX intervention from BoJ.
Medium-term uptrend supported by sovereign yield premium
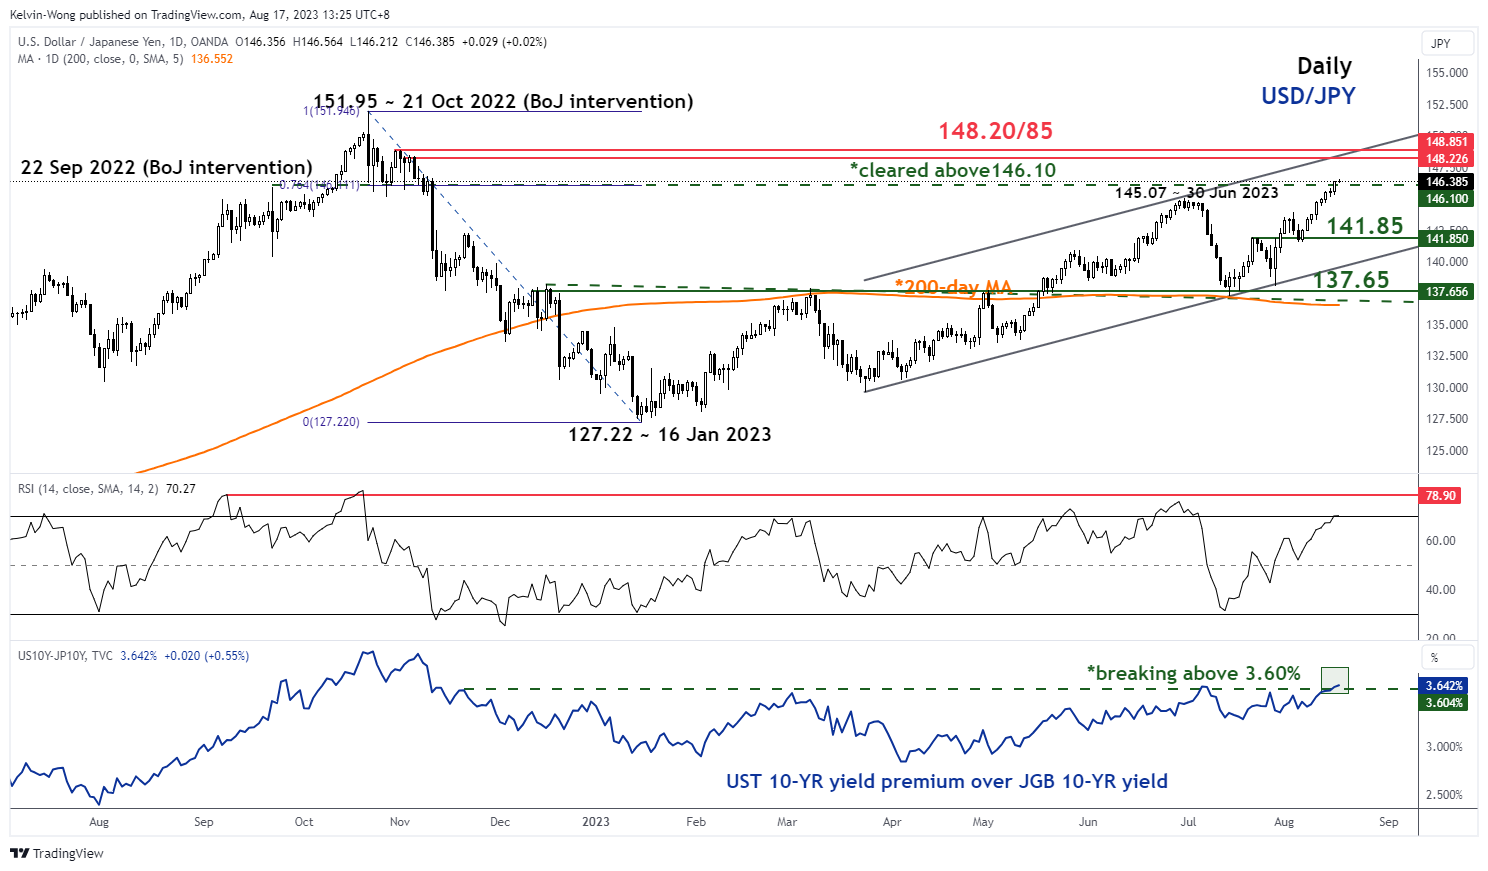
Fig 1: USD/JPY medium-term trend as of 17 Aug 2023 (Source: TradingView, click to enlarge chart)
The primary driver of this recent bout of USD/JPY’s sharp rallies seen in the past two weeks has been the steep sell-off inflicted on the offshore Chinese yuan (CNH) and the widening sovereign yield premium of the 10-year US Treasury note over the 10-year JGB, the yield spread has just broken above a key medium-term resistance of 3.60%.
Oscillating within a minor ascending channel since 7 August 2023 low
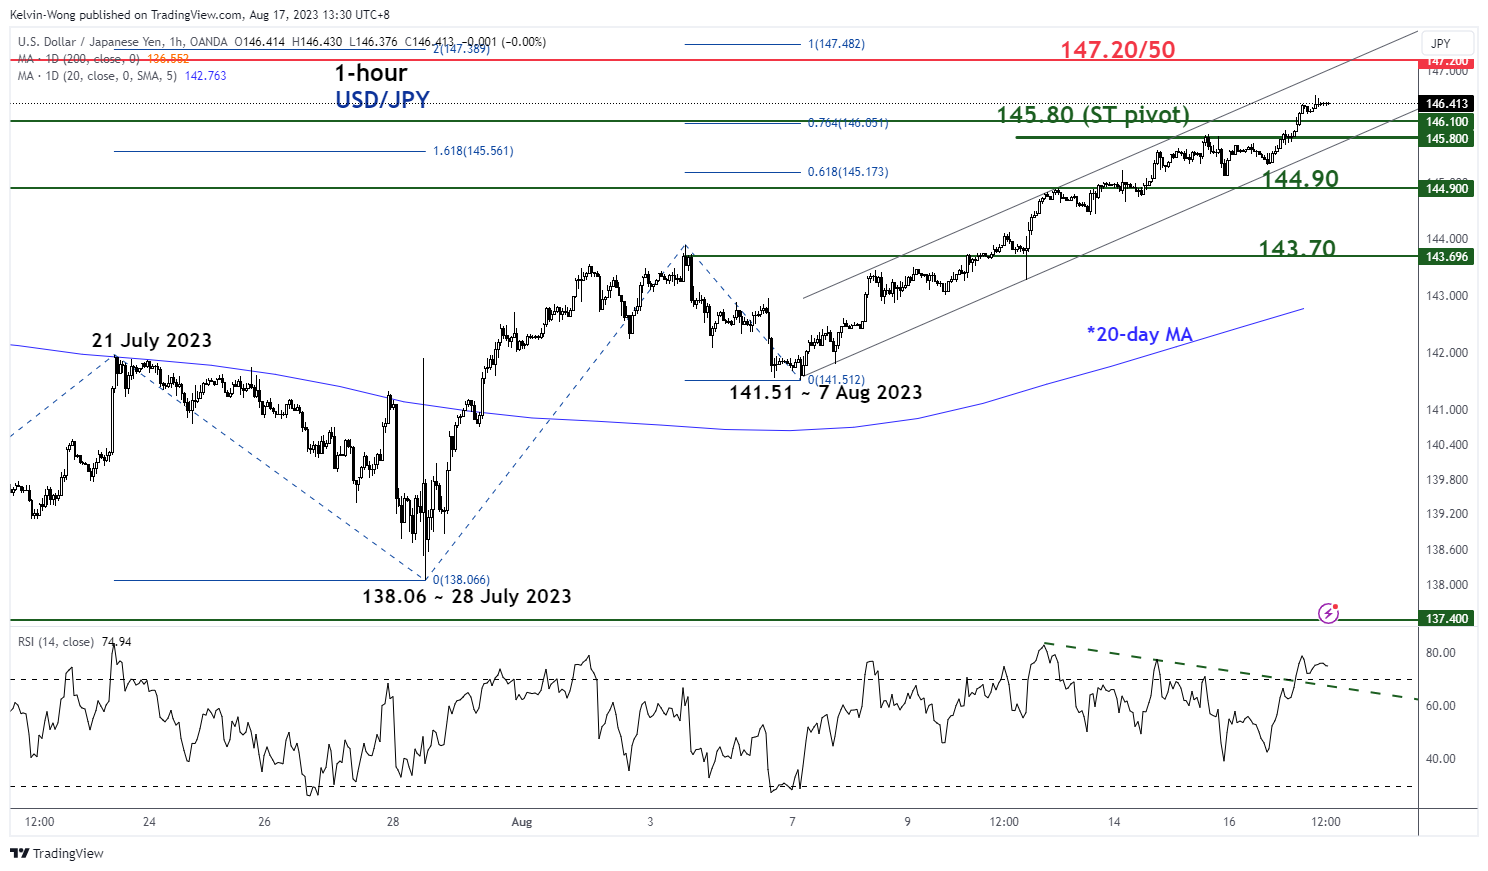
Fig 2: USD/JPY minor short-term trend as of 17 Aug 2023 (Source: TradingView, click to enlarge chart)
In the shorter term, watch the 145.80 key short-term pivotal support to maintain the current bullish tone to see the next resistance coming at 147.20/50 in the first step.
On the flip side, a break below 145.80 may jeopardize the bulls to expose the next supports at 144.90 and 143.70 (also close to the 20-day moving average).
Content is for general information purposes only. It is not investment advice or a solution to buy or sell securities. Opinions are the authors; not necessarily that of OANDA Business Information & Services, Inc. or any of its affiliates, subsidiaries, officers or directors. If you would like to reproduce or redistribute any of the content found on MarketPulse, an award winning forex, commodities and global indices analysis and news site service produced by OANDA Business Information & Services, Inc., please access the RSS feed or contact us at info@marketpulse.com. Visit https://www.marketpulse.com/ to find out more about the beat of the global markets. © 2023 OANDA Business Information & Services Inc.
Latest posts by Kelvin Wong (see all)
- SEO Powered Content & PR Distribution. Get Amplified Today.
- PlatoData.Network Vertical Generative Ai. Empower Yourself. Access Here.
- PlatoAiStream. Web3 Intelligence. Knowledge Amplified. Access Here.
- PlatoESG. Automotive / EVs, Carbon, CleanTech, Energy, Environment, Solar, Waste Management. Access Here.
- PlatoHealth. Biotech and Clinical Trials Intelligence. Access Here.
- ChartPrime. Elevate your Trading Game with ChartPrime. Access Here.
- BlockOffsets. Modernizing Environmental Offset Ownership. Access Here.
- Source: https://www.marketpulse.com/forex/usd-jpy-technical-bullish-tone-resumes-148-20-85-next-resistance-to-watch/kwong

