- Medium-term uptrend of USD/JPY in place since 16 January 2023 at risk of breakdown.
- Steep decline from last Thursday, 6 July 2023 has reached oversold condition.
- Minor bounce cannot be ruled out at this juncture above 140.60 support.
- Watch the 142.50/142.80 intermediate resistance zone.
This is a follow-up on our prior analysis “USD/JPY surged to a 7-month high, but fundamentals diverge” published on 23 June 2023. We have highlighted the risks of the overextended rally exhibited in the USD/JPY seen in the past six weeks as it approached a key resistance zone of 145.50/146.10 (click here for a recap).
The price actions of the USD/JPY have indeed staged a retreat right below 145.50 (the lower limit of the key resistance zone) as it printed an intraday high of 145.07 on 30 June 2023 and dropped by 379 pips to hit a low of 141.28 in yesterday, 10 July US session.
Medium-term uptrend from 16 January 2023 is at risk of breakdown
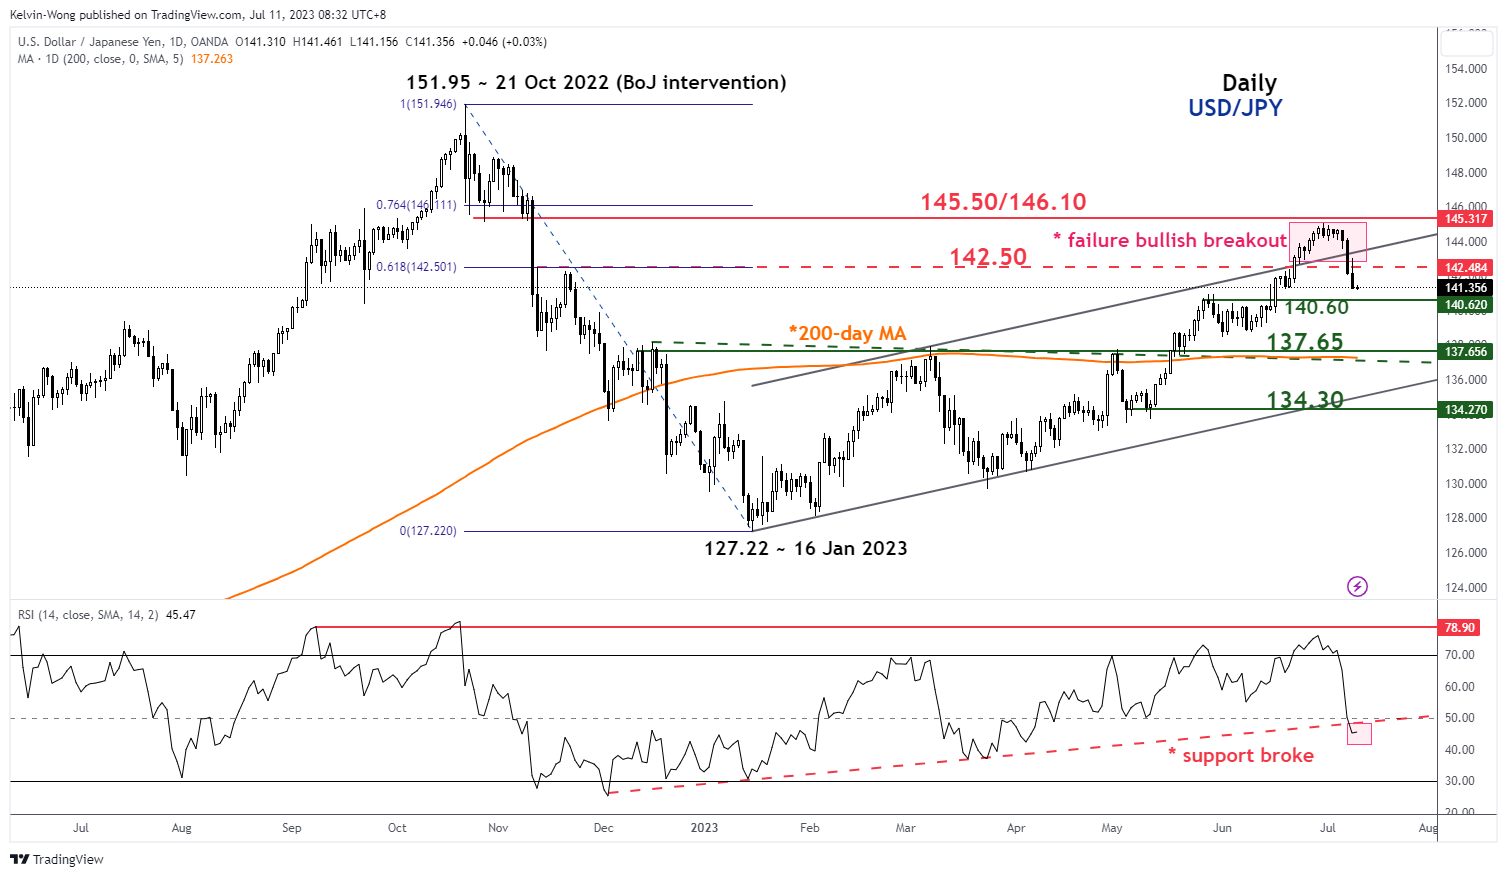
Fig 1: US/JPY medium-term trend as of 11 Jul 2023 (Source: TradingView, click to enlarge chart)
Two key observations have emerged that indicated that the ongoing medium-term uptrend phase of the USD/JPY in place since the 16 January 2023 low of 127.22 may have reached its terminal point on 30 June 2023 which in turn may see the start of a multi-week corrective down move.
Firstly, price actions have reintegrated below 142.50 (the pull-back support of the upper boundary of the medium-term ascending channel where price actions pierced above it on 22 June 2023) which suggests that the prior bullish breakout is likely a failure.
Secondly, the daily RSI has broken below a key parallel ascending trendline support at the 48 level, indicating that medium-term upside momentum has waned.
A minor bounce cannot be ruled out as the decline reached short-term oversold condition
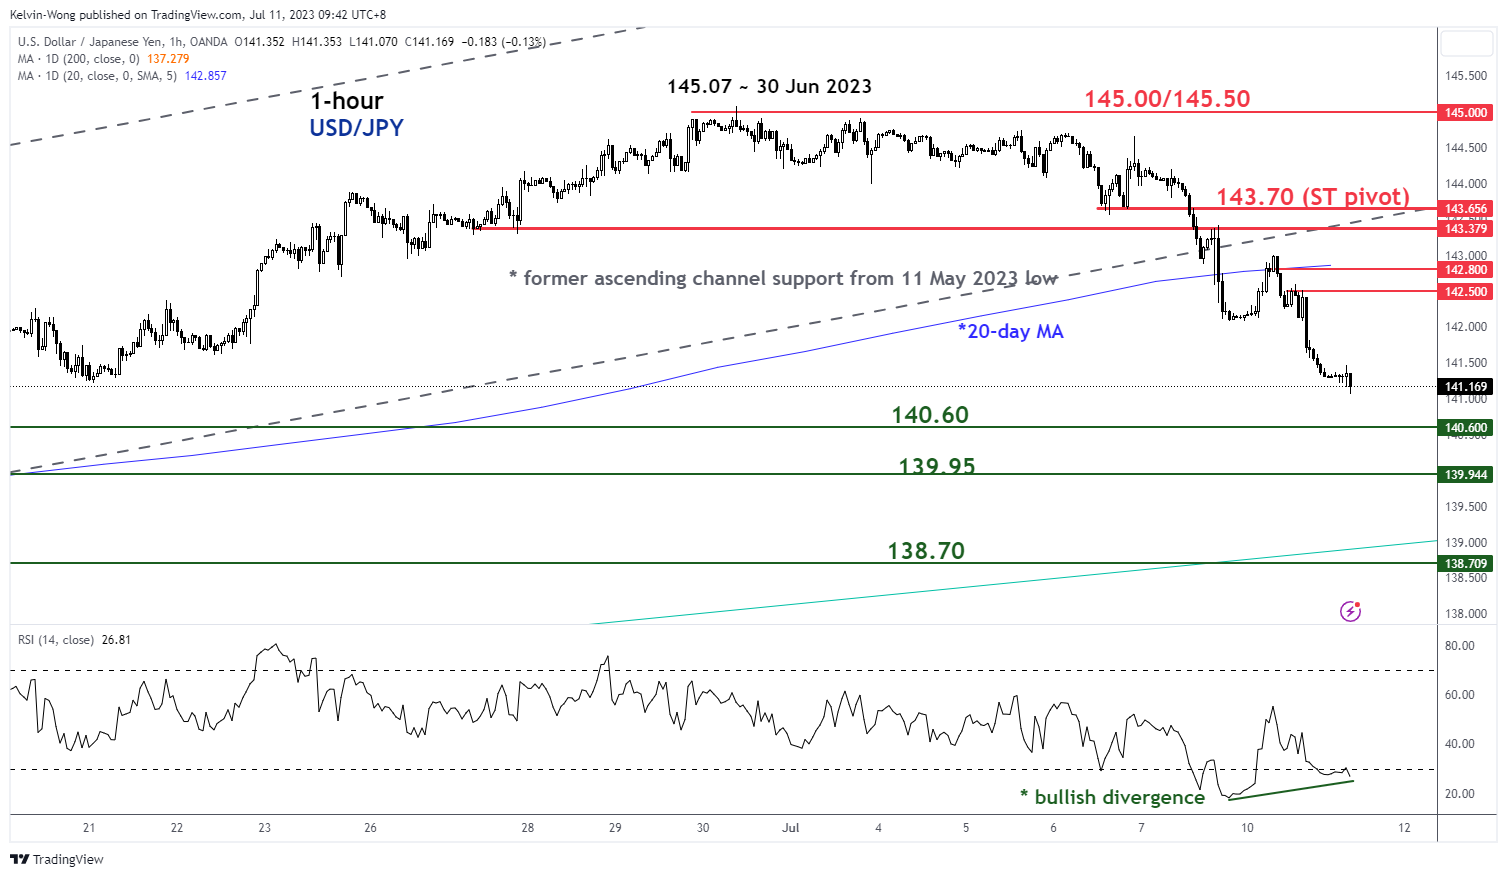
Fig 2: US/JPY minor short-term trend as of 11 Jul 2023 (Source: TradingView, click to enlarge chart)
In the realm of technical analysis, price actions of tradable financial instruments do not evolve in a vertical fashion but oscillate within a trend.
As seen on the 1-hour chart of the USD/JPY, the steep decline since last Thursday, 6 July 2023 minor high of 144.65 has led the hourly RSI to reach an oversold condition (below the 30 level) and flashed out a bullish divergence observation (higher low in RSI but lower low in parallel price actions).
These current observations have emerged as the decline in price actions is coming close to 140.60 key intermediate support (see daily chart).
Hence if the 140.60 intermediate support manages to hold, a minor bounce may unfold with intermediate resistances coming in at 142.50 and 142.80 (20-day moving average). The key short-term pivotal resistance will be at 143.70 to maintain the ongoing short-term downtrend phase in place since the 30 June 2023 high of 145.07.
On the other hand, a break below 140.60 exposes the next supports at 139.95 and 138.70.
Content is for general information purposes only. It is not investment advice or a solution to buy or sell securities. Opinions are the authors; not necessarily that of OANDA Business Information & Services, Inc. or any of its affiliates, subsidiaries, officers or directors. If you would like to reproduce or redistribute any of the content found on MarketPulse, an award winning forex, commodities and global indices analysis and news site service produced by OANDA Business Information & Services, Inc., please access the RSS feed or contact us at info@marketpulse.com. Visit https://www.marketpulse.com/ to find out more about the beat of the global markets. © 2023 OANDA Business Information & Services Inc.
Latest posts by Kelvin Wong (see all)
- SEO Powered Content & PR Distribution. Get Amplified Today.
- PlatoData.Network Vertical Generative Ai. Empower Yourself. Access Here.
- PlatoAiStream. Web3 Intelligence. Knowledge Amplified. Access Here.
- PlatoESG. Automotive / EVs, Carbon, CleanTech, Energy, Environment, Solar, Waste Management. Access Here.
- BlockOffsets. Modernizing Environmental Offset Ownership. Access Here.
- Source: https://www.marketpulse.com/forex/usd-jpy-technical-at-risk-of-a-minor-bounce-before-bearish-tone-resumes/kwong

