Russell 2000 Technical: A persistent underperformer among the US stock indices
- The Russell 2000 has recorded its worst relative performance against the S&P 500 in 23 years.
- Momentum and technical elements have remained lackluster.
- The Russell 2000 may be the hardest hit if the Fed continues to signal a higher interest rate environment for a longer period.
- Short-term momentum has turned bearish ahead of tomorrow’s US CPI release & FOMC meeting.
- Watch the key short-term resistance at 2,065 on the Russell 2000.
The Russell 2000 comprises small-cap listed companies that derived most of the revenue streams (close to 80% on the aggregate) domestically in the US.
Hence, the Russell 2000 can be considered a bellwether for the US economy as it reflects the performance of smaller companies focusing on the US market.
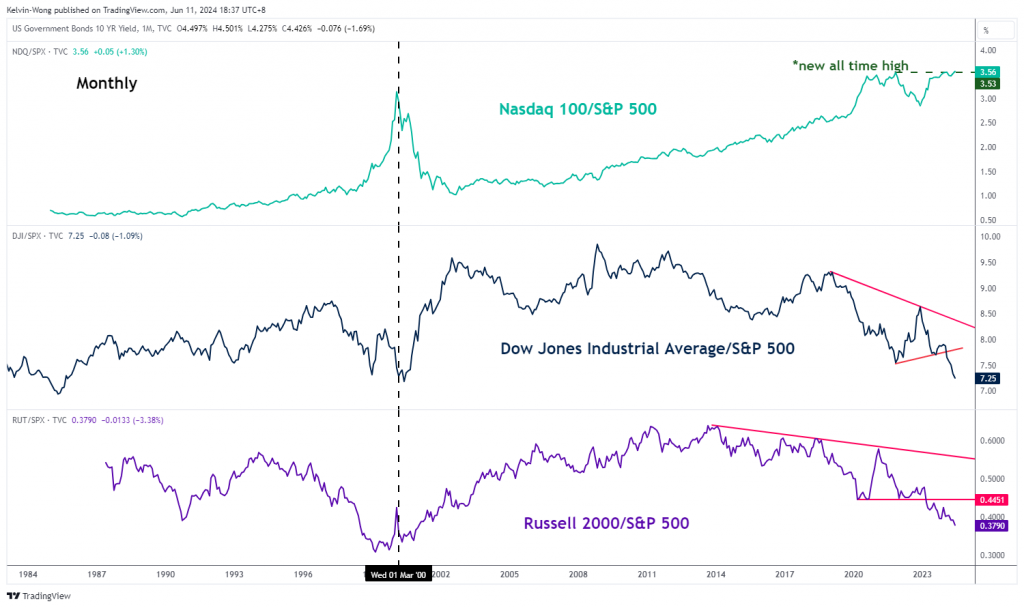
But when comparing its performance against the other major US stock indices such as the S&P 500, Nasdaq 100, and Dow Jones Industrial Average, it has continued to lag. It recorded only a paltry year-to-date return of 0.93% as of Monday, 10 June which was in stark contrast with double-digit gains seen in the Nasdaq 100 (15.30%), and S&P 500 (13.70%) as well as underperforming the Dow Jones Industrial Average (+3.06%) over the same period.
Russell 2000 suffered its worst run against the S&P 500 in 23 years
Fig 1: US Russell 2000 relative performance with S&P 500 as of 10 Jun 2024 (Source: TradingView, click to enlarge chart)
Over a longer-term multi-year period, the performance of the Russell 2000 has been miserable against the larger mega-cap technology stocks represented by the S&P 500.
The underperformance gap between US small-cap stocks and the S&P 500 has continued to widen in the past year as seen in the relative (ratio) chart of Russell 2000 over the S&P 500 where the underperformance of the Russell 2000 has hit a 23-year low (see Fig 1).
The main fundamental reason for the persistent underperformance of the Russell 2000 against the larger-cap S&P 500 is that US small-cap firms have weaker pricing power, lower margins, and weaker balance sheets that weighed down on their earnings growth potential in an elevated high inflationary environment coupled with high interest rates.
In addition, close to 40 percent of the debt on Russell 2000 is on a short-term floating rate compared with about 9 percent for S&P 500 firms. Hence, higher refinancing costs may be inflicted on Russell 2000 firms if the US Federal Reserve in their upcoming FOMC meeting on Wednesday, 12 June signals a higher interest rate environment for a longer period which in turn the Russell 2000 is likely to be the hardest hit.
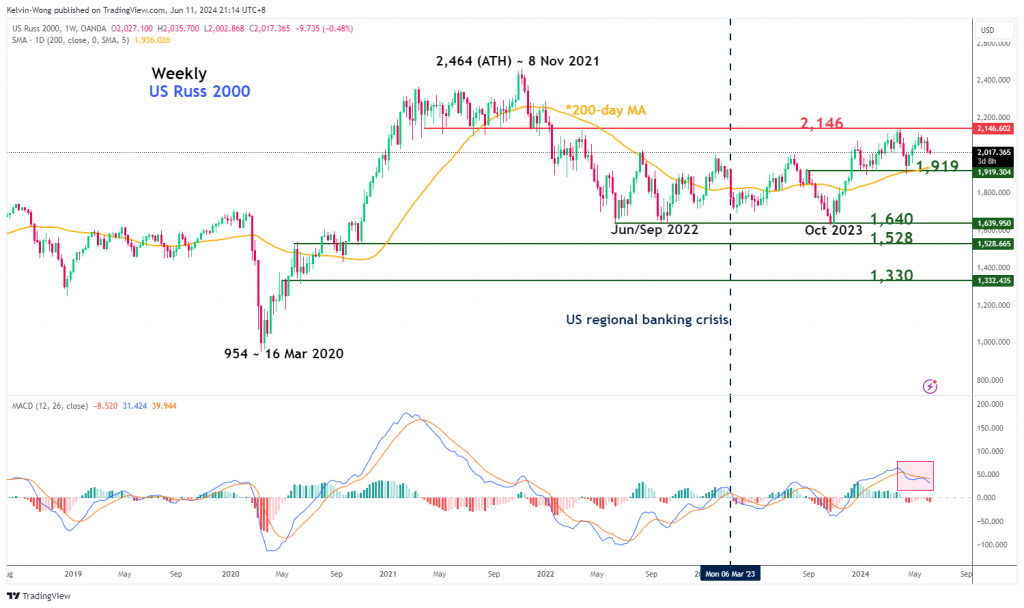
Russell 2000 has not made a fresh all-time high in the last 2 years
Fig 2: US Russell 2000 major trend as of 11 Jun 2024 (Source: TradingView, click to enlarge chart)
In the lens of technical analysis, the price actions of the US Russ 2000 CFD Index (a proxy of the Russell 2000 futures) are still oscillating within a major sideways range configuration since June 2022 and its current price action as of Monday, 10 June is still 22 percent away from its prior all-time high of 2,464 printed on 8 November 2021(see Fig 2).
In addition, its weekly MACD trend indicator has shaped a recent “lower high” on the week of 27 May 2024 and inched lower which suggests a lack of upside momentum, and its price actions face an increasing risk of transition towards the lower part of its major range configuration.
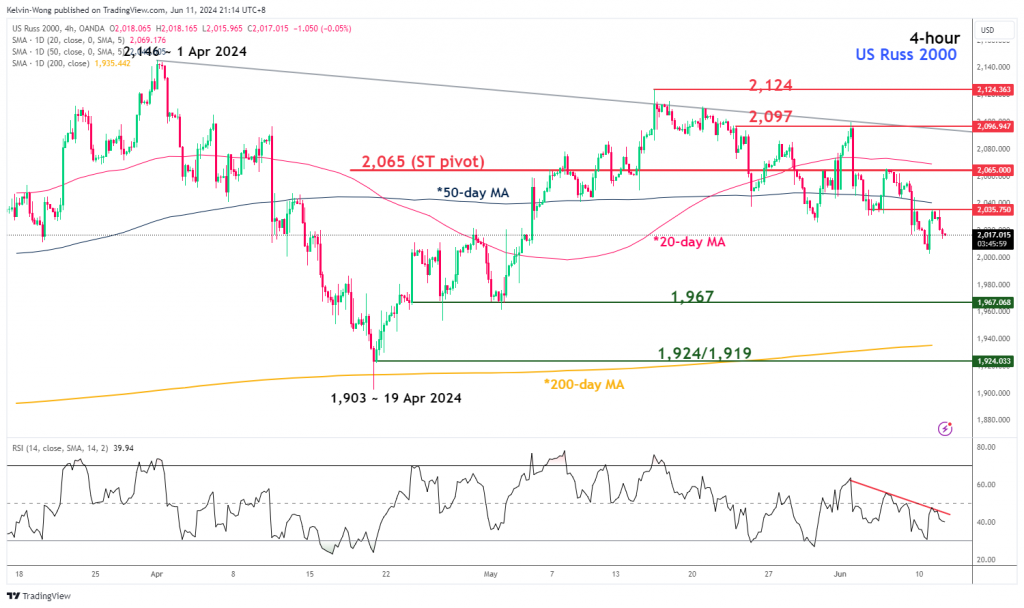
Short-term momentum has turned bearish on the Russell 2000
Fig 3: US Russell 2000 short-term trend as of 11 Jun 2024 (Source: TradingView, click to enlarge chart)
Since last Friday, 7 June, the price action of the US Russ 2000 CFD Index (a proxy of the Russell 2000 futures) has broken below its 50-day moving average and the minor rebound seen on Monday, 10 June has failed to reintegrate above it.
The 4-hour RSI momentum indicator has printed a “lower high” right below the 50 level which suggests that short-term momentum has turned bearish and may support lower price actions at least in the short-term horizon (see Fig 3).
Watch the 2,065 short-term pivotal resistance (also the 20-day moving average) with near-term support at 1,967 and a break below it exposes the 1,924/1,919 major range support (also the 200-day moving average).
On the flip side, a clearance above 2,065 negates the bearish tone for the next intermediate resistances to come in at 2,097 and 2,124.
Content is for general information purposes only. It is not investment advice or a solution to buy or sell securities. Opinions are the authors; not necessarily that of OANDA Business Information & Services, Inc. or any of its affiliates, subsidiaries, officers or directors. If you would like to reproduce or redistribute any of the content found on MarketPulse, an award winning forex, commodities and global indices analysis and news site service produced by OANDA Business Information & Services, Inc., please access the RSS feed or contact us at info@marketpulse.com. Visit https://www.marketpulse.com/ to find out more about the beat of the global markets. © 2023 OANDA Business Information & Services Inc.
- SEO Powered Content & PR Distribution. Get Amplified Today.
- PlatoData.Network Vertical Generative Ai. Empower Yourself. Access Here.
- PlatoAiStream. Web3 Intelligence. Knowledge Amplified. Access Here.
- PlatoESG. Carbon, CleanTech, Energy, Environment, Solar, Waste Management. Access Here.
- PlatoHealth. Biotech and Clinical Trials Intelligence. Access Here.
- Source: https://www.marketpulse.com/indices/russell-2000-technical-a-persistent-underperformer-among-the-us-stock-indices/kwong


