- The bulls of the Nasdaq 100 have staged another retreat at the key 15,270 resistance.
- Medium-term upside momentum has started to wane as indicated by the daily RSI.
- Minor bearish “Double Top” sighted with its neckline support at 14,700.
This is a follow-up on our prior analysis “Nasdaq 100 Technical: “Risk of a medium-term blow-off top” published on 27 June 2023. So far, its price actions have failed to have a daily close above the 15,270 key medium-term pivotal resistance after an intraday breach above it on 5 July (click here for a recap).
Bulls halted again at the 15,270 level
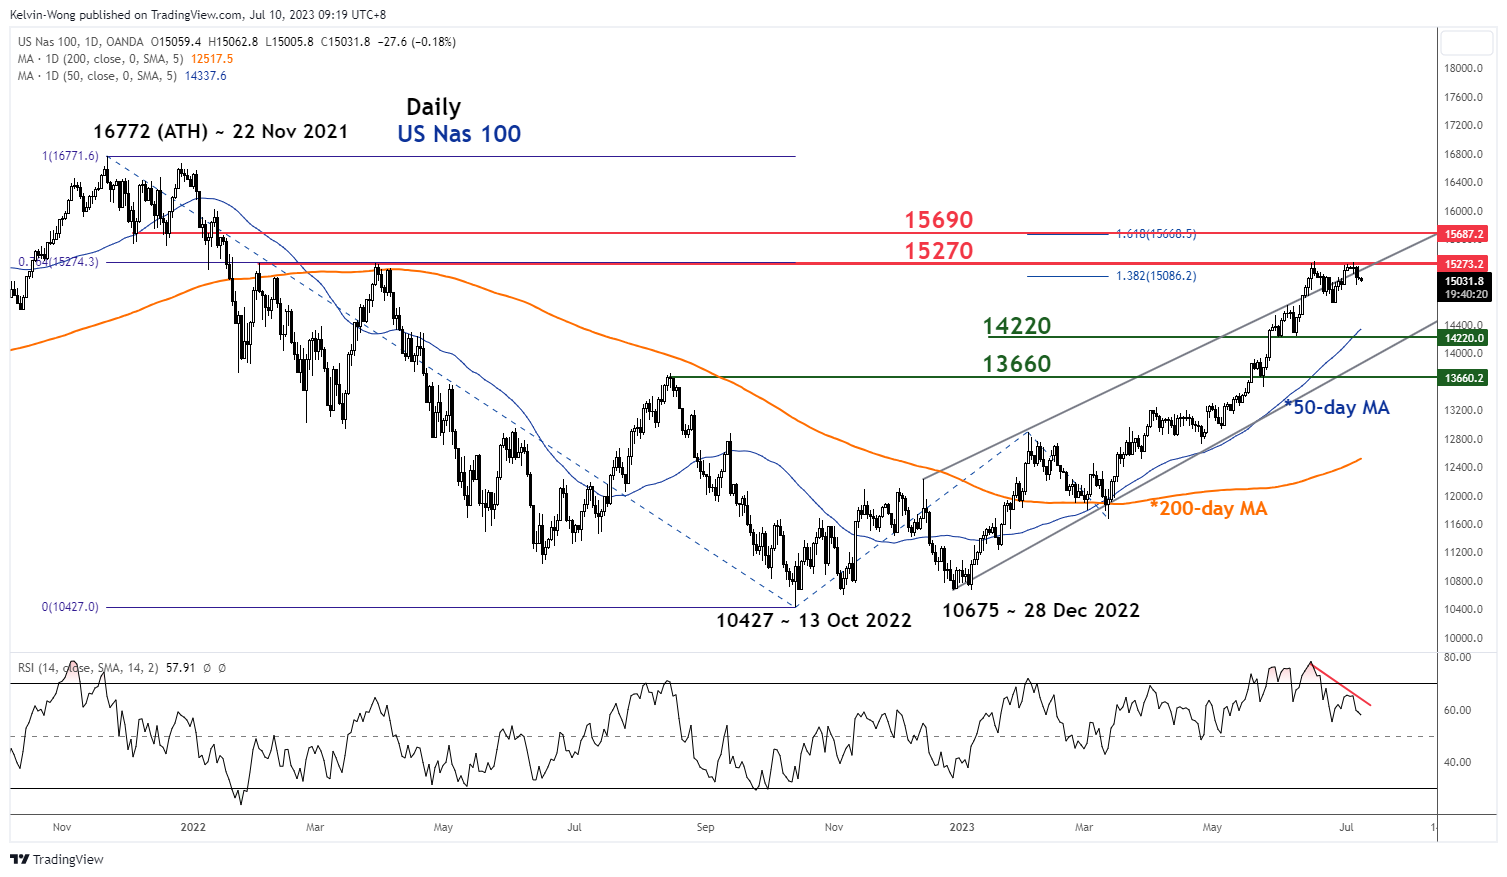
Fig 1: US Nas 100 medium-term trend as of 10 Jul 2023 (Source: TradingView, click to enlarge chart)
After a retest on the key 15,270 resistance level on 5 July 2023 (printed an intraday high of 15,283), the US Nas 100 Index (a proxy for the Nasdaq 100 futures) has staged a decline of -2.1% to print a low of 14,964 on 6 July 2023.
Additional bearish elements have emerged
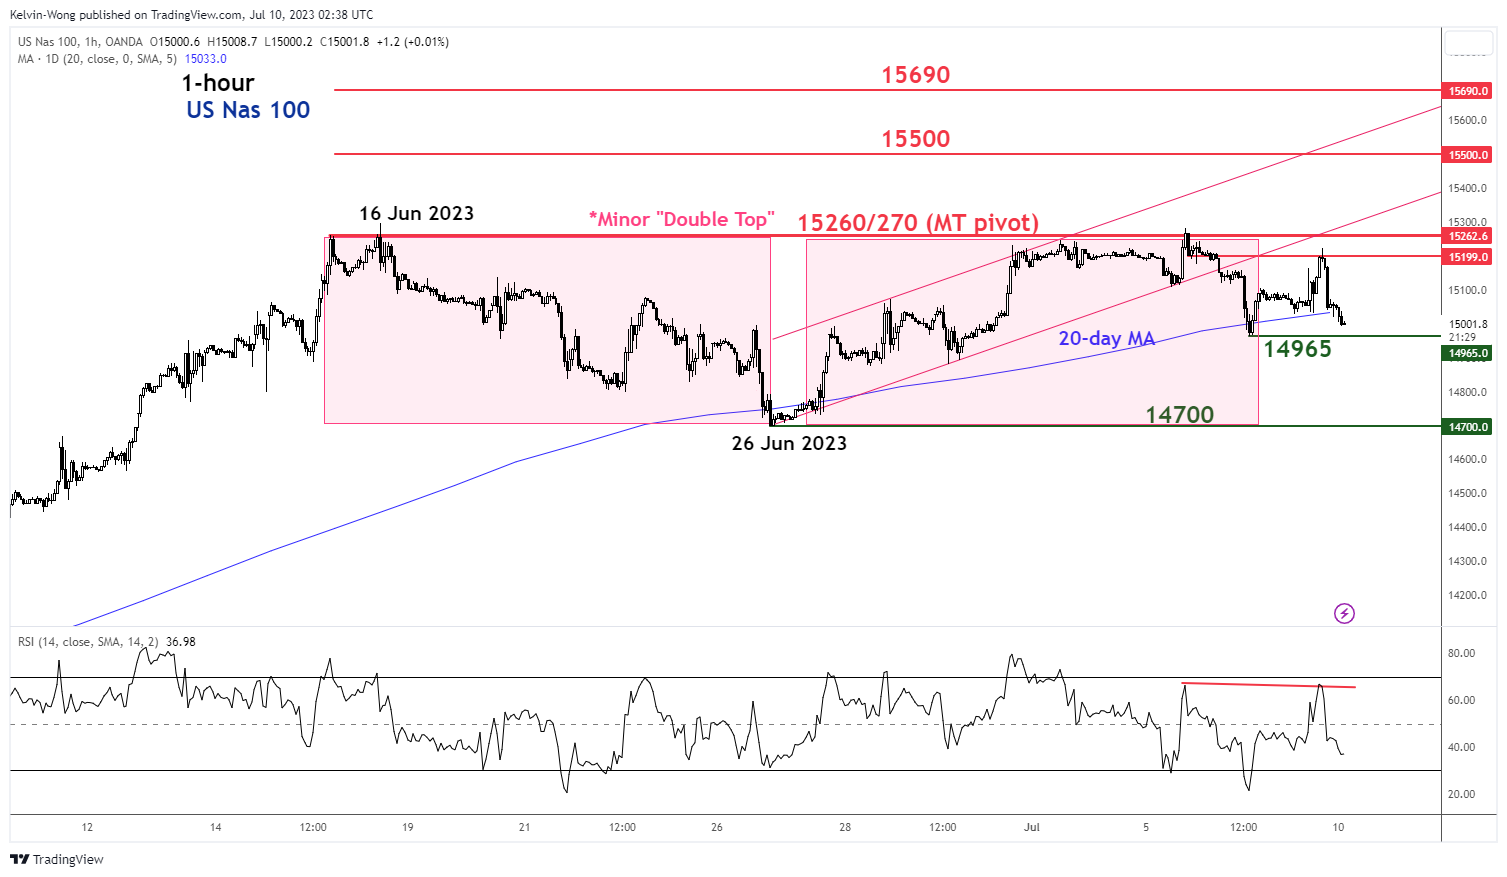
Fig 2: US Nas 100 minor short-term trend as of 10 Jul 2023 (Source: TradingView, click to enlarge chart)
The daily RSI oscillator flashed a bearish divergence signal on 4 July 2023 after it exited from its overbought region (above 70 level) which suggests that medium-term upside momentum has started to wane.
In a shorter time horizon (1-hour chart), the price actions of the Index have traced out an impending minor bearish “Double Top” configuration with its neckline support of 14,700.
Also, on the 1-hour chart, the price actions have staged a bearish breakout below the minor ascending channel support followed by a crack below the 20-day moving average in today’s Asian session at this time of the writing that indicates a potential minor downtrend phase may have kickstarted.
Watch the 15,270 key medium-term pivotal resistance to maintain the bearish tone and a break below 14,965 exposes the next support at 14,700 (the neckline of the minor “Double Top”).
However, a clearance above 15,270 sees the next resistances coming in at 15,500 and 15,690.
Content is for general information purposes only. It is not investment advice or a solution to buy or sell securities. Opinions are the authors; not necessarily that of OANDA Business Information & Services, Inc. or any of its affiliates, subsidiaries, officers or directors. If you would like to reproduce or redistribute any of the content found on MarketPulse, an award winning forex, commodities and global indices analysis and news site service produced by OANDA Business Information & Services, Inc., please access the RSS feed or contact us at info@marketpulse.com. Visit https://www.marketpulse.com/ to find out more about the beat of the global markets. © 2023 OANDA Business Information & Services Inc.
Latest posts by Kelvin Wong (see all)
- SEO Powered Content & PR Distribution. Get Amplified Today.
- PlatoData.Network Vertical Generative Ai. Empower Yourself. Access Here.
- PlatoAiStream. Web3 Intelligence. Knowledge Amplified. Access Here.
- PlatoESG. Automotive / EVs, Carbon, CleanTech, Energy, Environment, Solar, Waste Management. Access Here.
- BlockOffsets. Modernizing Environmental Offset Ownership. Access Here.
- Source: https://www.marketpulse.com/indices/nasdaq-100-technical-potential-minor-bearish-double-top/kwong

