A simple assay for screening EV-sorting proteins
In search of efficient EV-sorting proteins, a list of candidates was compiled based on literature review and proteomics databases. Potential candidates were derived from either (1) proteins found to be enriched in EVs across the NCI-60 cells29, (2) proteins abundant in EVs produced by human embryonic kidney epithelial (HEK)-293T cells34, (3) reported EV-sorting proteins as references to previous studies32,33, and (4) all proteins in the tetraspanin superfamily. Proteins larger than 130 kDa were excluded to facilitate overexpression/engineering. A total of 244 candidates with a median size of 38 kDa were included, of which 129 were non- and 115 were transmembrane proteins (Fig. 1a; see the Data Source file for a complete list).
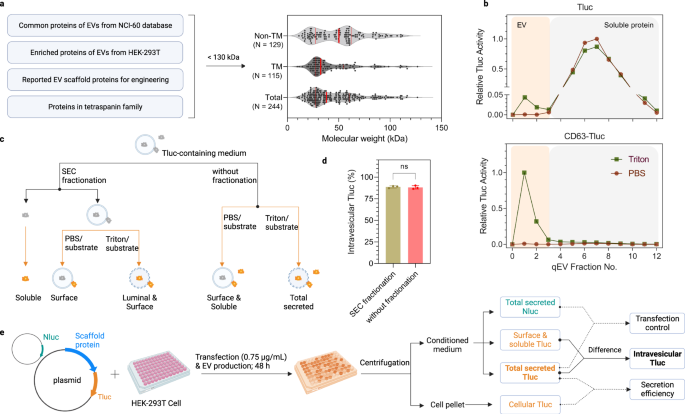
a Selection criteria and overview of EV-sorting protein candidates. The red solid lines indicate the 25%, 50% and 75% percentile values. b SEC elution profiles of conditioned media from HEK-293T cells expressing Tluc or CD63-Tluc. Tluc activity in each fraction was quantified directly (group PBS) or after membrane lysis (group Triton) and normalized to the fraction with the highest signal. EVs and soluble proteins were recovered in fractions 0-3 and 4–12, respectively. c Scheme of differentiating Tluc forms in conditioned media. d Percentage of intravesicular Tluc for CD63-Tluc using fractionated and unfractionated media. Results are shown as the mean ± standard deviation of three biological replicates. Two-sided Student’s t test (P > 0.9999). ns: not significant. e Outline of the screening procedure and data analyses. HEK-293T cells were grown in 96-well microplates and co-transfected with Tluc fusion plasmid and Nluc plasmid. Cell cultures were centrifuged and Tluc activity was measured in the cell pellet and conditioned media. Nluc activity was only quantified in the conditioned media. c, e Created with BioRender.com. Source data are provided as a Source Data file. SEC size exclusion chromatography.
To assess the luminal loading ability of the candidates into EVs, we developed an assay based on the luciferase reporter ThermoLuc (Tluc; 60.5 kDa)18. In brief, Tluc was fused to the C termini of all candidates, bearing in mind that N termini are usually the site for signal peptides and post-translational modifications. The plasmids encoding the fusion proteins were transfected into HEK-293T cells. After 48 h, the conditioned media were collected and further processed prior to bioluminescence measurements. Initially, to evaluate the feasibility of this assay, the conditioned media of cells expressing Tluc alone and CD63-Tluc were analyzed. Both were fractionated with size exclusion chromatography (SEC) columns to separate vesicles from free proteins (Fig. 1b)35. The fractions were treated either with PBS to determine soluble/surface-associated Tluc or the detergent Triton X-100 to detect total secreted Tluc (Fig. 1c). Compared to Tluc alone, fusion with CD63 resulted in a prominent shift of Tluc towards the EV fraction (Fig. 1b). Notably, Tluc activity in the EV fractions was only detected upon membrane lysis, indicating that Tluc substrate is unable to cross the EV membrane and react with luminal luciferase. This implies that SEC fractionation is dispensable for quantifying luminal proteins. This is further supported by comparison of unfractionated and fractionated media of CD63-Tluc-expressing cells, which revealed no significant differences in the percentage of intravesicular Tluc (Fig. 1d). Taken together, these data show that this assay can be used in a high-throughput format to identify potential EV-loading scaffolds.
Moving forward, the principle for screening all 244 candidates was the same as above. For downstream analyses, the proteins were primarily evaluated on the absolute amount of intravesicular Tluc, derived from the difference in Tluc signal detected with and without membrane lysis, or the relative percentage thereof (Fig. 1e). Information on fusion protein expression was obtained by measuring Tluc in the EV-producing cells. Additionally, when specified, the data was normalized to a transfection control in the form of a plasmid encoding NanoLuc (Nluc) luciferase that was spiked into the transfection mixture to account for possible transfection variations.
Screening identifies dozens of EV-sorting proteins
Screening the 244 candidates in HEK-293T cells revealed no obvious correlation between intravesicular Tluc and cellular or total secreted Tluc (Supplementary Fig. 1a, b), indicating that neither cellular expression nor overall secretion fully predicts EV-sorting ability. For most candidates, the percentage of intravesicular Tluc was below zero, which is unexpected but might be attributable to attenuated enzyme activity and/or photon lifetime in the presence of the detergent Triton. Nevertheless, it provided a reasonable and practical cut-off for proteins with EV-sorting ability. According to this definition, a total of 36 proteins were found to exhibit EV-sorting ability in HEK-293T cells (Fig. 2a). Among these were five known EV-sorting proteins including three EV markers (CD9, CD63, CD81), one recently identified protein (PTGFRN)32, and the viral glycoprotein gag, thereby substantiating the validity of our screening protocol. To the best of our knowledge, this is the first time the remaining 31 proteins have been reported as being capable of luminal cargo loading into EVs.
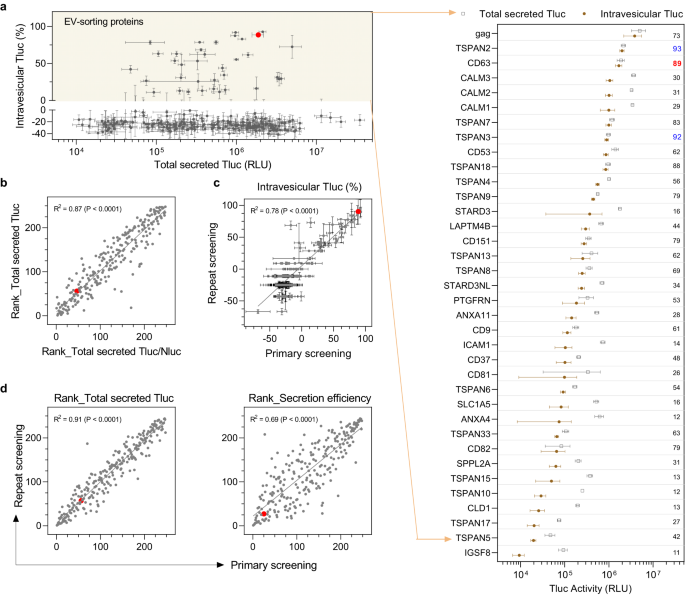
a Overview of all 244 candidates plotting total secreted Tluc against percentage of intravesicular Tluc. EV-sorting proteins were defined to have a percentage of intravesicular Tluc above zero (yellow area) and are shown in the grouped dot plot. The value refers to the percentage of intravesicular Tluc. Proteins are marked with gene names. b Correlation between the rank regarding total secreted Tluc and the rank regarding total secreted Tluc/Nluc ratio. c Correlation of the percentage of intravesicular Tluc obtained from the primary and repeat screening. d Correlation of the rank regarding secreted Tluc or secretion efficiency between the primary and repeat screening. Results in (a, b) were from the primary screening and are shown as mean ± standard deviation of five biological replicates. Data from the repeat screening are shown as mean ± standard deviation of three biological replicates. In the scatter plots, each dot refers to one candidate and the red dot indicates the benchmark CD63. The degree of correlation was analyzed with linear regression and is shown as goodness-of-fit (R2) and significance of non-zero slope (P). Source data are provided as a Source Data file.
Out of the four known non-viral EV-sorting proteins, CD63 showed the highest percentage of intravesicular Tluc, with 89% of total secreted Tluc localized inside EVs. Notably, TSPAN2 outperformed CD63 not only in terms of relative intravesicular Tluc (93% vs. 89%) but also absolute amount (2.0e6 vs. 1.7e6; see Source Data file for detailed information). Apart from that, three calmodulin proteins (CALM1, CALM2, CALM3) sorted considerable amounts of Tluc into EVs but with moderate percentages of intravesicular Tluc (29–31%).
To rule out that any unwanted factors interfered with Tluc secretion, suitable quality controls were put in place. First, all candidates were ranked according to total secreted Tluc and the ratio of total secreted Tluc to Nluc. Normalization against Nluc signal did not affect Tluc secretion (Fig. 2b), thereby dismissing a confounding role of the transfection procedure. Secondly, a repeat of the screening revealed consistent results for the percentage of intravesicular Tluc (Fig. 2c) as well as the ranks of total secreted Tluc and secretion efficiency (Fig. 2d). Finally, the ranks of total secreted Tluc and secretion efficiency showed a high degree of linear correlation between two different plasmid doses (0.75 µg/mL vs 1 µg/mL; Supplementary Fig. 1c). Taken together, these results substantiate the reliability of the findings obtained with our screening method.
EV-sorting proteins are largely conserved across different cell types
Besides HEK-293T, other cell types are regularly used as EV sources prompting us to screen the EV-sorting ability of our candidates in (1) suspension-adapted HEK cells (Freestyle 293-F), (2) human cord blood-derived mesenchymal stem cells (MSCs), (3) human hepatocyte-derived carcinoma cells (Huh-7), and (4) mouse kidney epithelial cells (TCMK-1). For this purpose, 95 candidates that had shown promise in the initial screening, in either of these categories: percentage of intravesicular Tluc, total secreted Tluc, and secretion efficiency (see Source Data file for detailed information), were screened as above.
In Freestyle 293-F, the protein with the highest EV-sorting ability in terms of percentage of intravesicular Tluc was TSPAN3. In MSCs and Huh-7, CALM2 occupied the highest rank, and in TCMK-1 was CD63 (Fig. 3a). While the transfection procedure was not found to substantially affect Tluc secretion in all the adherent cells tested, Freestyle 293-F seemed more prone to variation (Supplementary Fig. 2). Between 30 and 37 proteins with EV-sorting ability (percentage of intravesicular Tluc above zero) were identified for each cell type (Fig. 3b). Out of these, 24 proteins were conserved across all five cell types indicating their robust sorting ability in different cellular contexts (see Source Data file for a complete list). The proteins in the conserved subset were ranked according to their absolute intravesicular Tluc activity (Fig. 3c). On average, TSPAN2, CD63 and TSPAN3 demonstrated the best sorting abilities across different cell types.
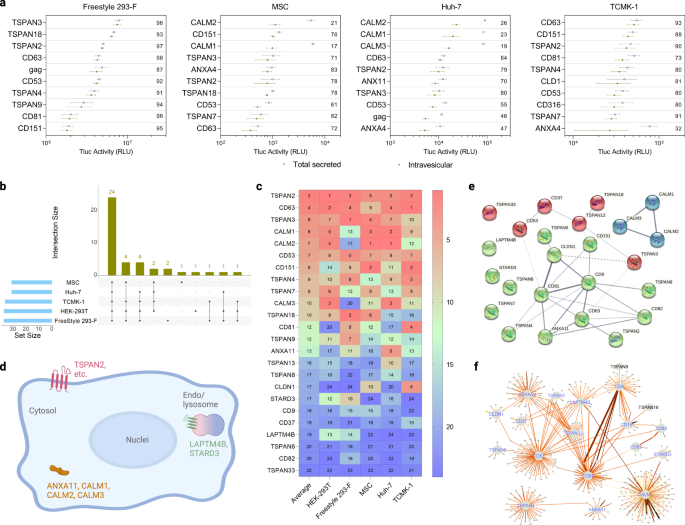
a Top ten scaffold proteins regarding intravesicular Tluc in different producer cell types. The value inside the plot refers to the percentage of intravesicular Tluc. Results are shown as mean ± standard deviation of three biological replicates. b Number of EV-sorting proteins identified for each producer cell type and overlap between cell types. c Rank of the 24 conserved EV-sorting proteins regarding intravesicular Tluc in each cell type. The value indicates the rank in each cell type as well as the average thereof. d Topology and subcellular location of the 24 conserved EV-sorting proteins. Created with BioRender.com. (e-f) Interaction network of the 24 conserved EV-sorting proteins retrieved from STRING (e) and IntAct (f) databases. Line thickness in panels (e, f) indicates the strength of data support, with thicker line standing for stronger evidence. Proteins are marked with gene names. Source data are provided as a Source Data file.
To obtain a more in-depth understanding of potential mechanisms that govern the EV-sorting ability of the conserved subset, bioinformatic studies were conducted. According to the annotation available on UniProtKB, only the three calmodulin proteins and ANXA11 are cytosolic, while the remaining proteins are all members of the tetraspanin superfamily and located either on the plasma or endosomes/lysosomes membrane (Fig. 3d). Next, we evaluated possible interactions between the 24 EV-sorting proteins. The experimental and predicted interactome available from the STRING database showed weak evidence for the interaction of TSPAN2/TSPAN3 with CD63, and calmodulin proteins seem to operate irrespective of the rest (Fig. 3e). Similarly, the results from the IntAct database, which includes both direct and indirect interactions, suggested that the interactome of TSPAN2 overlaps poorly with that of the three well-characterized tetraspanins CD9/CD63/CD81 (Fig. 3f). These predictions indicate that TSPAN2 and TSPAN3 operate largely independent of each other and other tetraspanins.
EV-sorting candidates prove robust amid standardized EV production
In the screening, HEK-293T cells were grown and transfected in 96-well microplates for the purpose of higher throughput. Such a scale, however, is not practicable for future applications seeking to produce larger quantities of engineered EVs. Additionally, the conditioned media in the screening were analyzed directly after centrifugation without any defined separation techniques. Here, we were particularly interested in small EVs (sEVs, ≤ 200 nm) because of their therapeutic potential in many diseases36,37. With that in mind, we produced EVs according to a standardized protocol recently established by our group38. The main differences to the initial screening protocol were (1) a higher dose of plasmids and shorter transfection duration, (2) subsequent maintenance in Opti-MEM, and (3) filtration of conditioned media through a 200-nm membrane followed by a concentration step (Fig. 4a). Additionally, sEVs were separated from soluble proteins by SEC before measuring Tluc activity and vesicle counts (Fig. 4b). Noteworthily, Tluc in the eluate was completely deactivated by Proteinase K indicating that resistant protein aggregates were not a matter of concern (Fig. 4b).
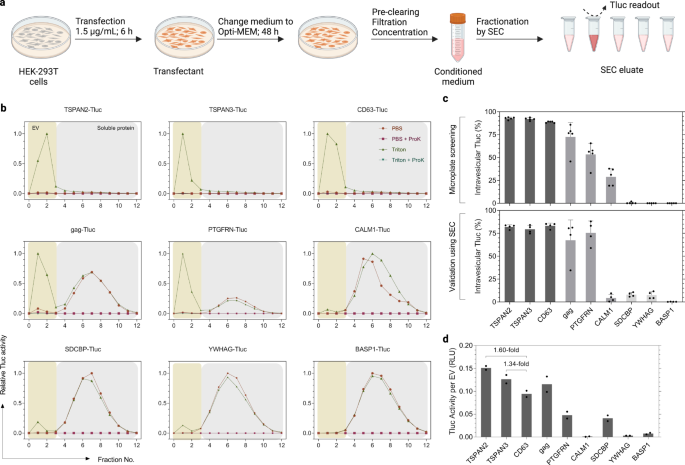
a Workflow of EV production and SEC fractionation protocol. Created with BioRender.com. b SEC elution profiles of conditioned media from transfected HEK-293T cells. EVs and soluble proteins were recovered in fractions 0–3 and 4–12, respectively. Tluc activity in each fraction was measured with and without Triton and ProK, and normalized to the fraction with the highest signal. c Percentage of intravesicular Tluc using the screening (upper panel; five biological replicates) and standardized (lower panel; four biological replicates) protocols. Mean ± standard deviation. d Calculated Tluc activity per vesicle for purified EV preparations. Results are shown as an average of two biological replicates. Proteins are marked with gene names. Source data are provided as a Source Data file. SEC size exclusion chromatography.
To gain insight into sEV-sorting ability, nine representative candidates were selected based on their performance in the screening (Fig. 4c). The percentage of intravesicular Tluc generally coincided with the screening, showing high (>80%; TSPAN2, TSPAN3, and CD63) and low (<15%; SDCBP, YWHAG, BASP1) sEV-sorting ability (Fig. 4c). Interestingly, CALM1 sorted only 3.7% Tluc into sEVs as compared to 28.9% in the screening (P < 0.01, Two-sided Student’s t test). Taking vesicle numbers into account, we observed that TSPAN2 and TSPAN3 outperformed CD63 in terms of Tluc activity per EV (1.60-fold and 1.34-fold, respectively; Fig. 4d). Overall, these results demonstrate that the sorting ability of these nine candidates remained largely unchanged when following a standardized sEV production protocol.
EV-sorting candidates prove versatile for different cargos
Luciferase is a facile reporter for quantifying engineered EVs in bulk. However, to obtain more information on the number of engineered EVs and the abundance of cargo proteins per EV, single-vesicle imaging flow cytometry is the method of choice39,40. Therefore, for the nine candidate proteins explored above, Tluc was replaced with a hybrid reporter consisting of the fluorescent protein mNeonGreen (mNG; 26.6 kDa) fused to HiBiT41, an 11-mer peptide from split Nluc luciferase (Fig. 5a).
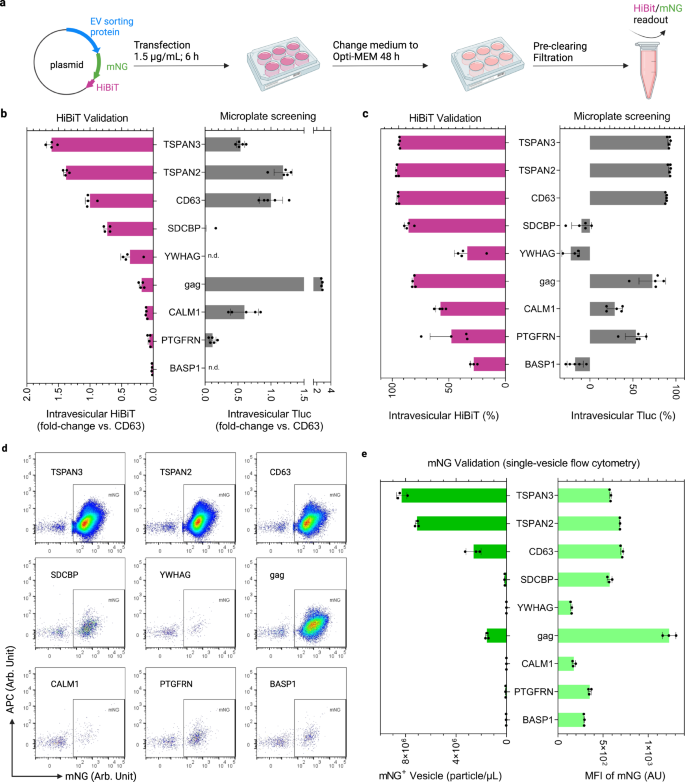
a Workflow of EV production and analysis. Created with BioRender.com. b Intravesicular HiBiT relative to the benchmark CD63. n.d. not detected. c Percentage of intravesicular HiBiT. In b, c, results are shown as mean ± standard deviation of four biological replicates. Screening results from HEK-293T cells were re-graphed for reference. d Single-vesicle flow cytometry dot plots of mNG-HiBiT-labeled EVs. e Concentration and mean fluorescence intensity (MFI) of mNG-positive EVs. Results are shown as mean ± standard deviation of three biological replicates. Proteins are marked with gene names. Source data are provided as a Source Data file.
Comparison of intravesicular luciferase activities of HiBiT and Tluc revealed comparable engineering efficiencies for TSPAN3, TSPAN2 and CD63 in terms of amount (Fig. 5b) and percentage (Fig. 5c). Using mNG to look at the single-vesicle level, TSPAN3 and TSPAN2 produced the highest number of engineered EVs, outperforming CD63 by approximately threefold while reaching similar levels of mNG per engineered EV (Fig. 5d, e). Additionally, we showed that mNG co-localized with respective sorting proteins on the EVs after antibody staining, which is indicative of intact fusion proteins (Supplementary Fig. 3). Surprisingly, HiBiT- and Tluc-based measurements differed greatly for gag (Fig. 5b, c); however, its mNG levels did not show such a discrepancy (Fig. 5d, e). This led us to postulate that the steric configuration of gag-mNG-HiBiT prohibits HiBiT from complexing with its partner subunit to form functional luciferase. Additionally, CALM1 showed low levels of vesicular HiBiT and mNG, in line with the trend observed for CALM1-Tluc in SEC validation experiments (Fig. 4c). These results suggest that CALM1 preferentially sorts into larger vesicles (>200 nm) that are removed during the filtration step (Supplementary Fig. 4).
We additionally evaluated the performance of these selected proteins in Freestyle 293-F cells, which are a prominent source for EV production due to a less tedious propagation procedure. Again, TSPAN3 and TSPAN2 outperformed CD63 by 82% and 50%, respectively, in terms of intravesicular HiBiT (Supplementary Fig. 5a). On a single-vesicle level, the highest concentration of mNG-positive vesicles was produced by TSPAN3 and TSPAN2 engineered Freestyle 293-F cells (Supplementary Fig. 5b). Collectively, the reconciling results based on mNG-HiBiT and Tluc reporters reinforce the reliability of the screening protocol and highlight the robust EV-sorting ability of the candidate proteins for different cargos.
Distinct molecular signatures among tetraspanin-engineered EVs
Throughout all experiments, TSPAN2 and TSPAN3 appeared among the best EV-sorting proteins, seemingly performing better than the well-characterized tetraspanin CD63. Notably, different splice isoforms of TSPAN2 and TSPAN3 failed to retain EV-sorting ability in HEK293-T cells (Supplementary Fig. 6). Since, as far as we know, this is the first report of these proteins for endogenous engineering of EVs, we characterized the physiochemical features of TSPAN2- and TSPAN3-engineered EVs in relation to CD63-engineered EVs in greater detail.
Nanoparticle tracking analysis of EV preparations from transfected HEK-293T cells revealed a narrow size distribution with median hydrodynamic diameters of approximately 120 nm (Fig. 6a). Also, their morphological appearances were typical of EVs as exemplified by membrane structure and size (Fig. 6b). Moreover, common EV markers such as CD81, syntenin-1 and TSG101, but not the negative marker Calnexin, were detected in the EVs (Fig. 6c). Apart from that, we examined the location of the three tetraspanin proteins in transfected cells to gain insight into EV biogenesis. While TSPAN2 was localized in both the plasma membrane and cytosol of producer cells, TSPAN3 and CD63 were primarily detected as punctate signals inside cells (Fig. 6d). Furthermore, the production of all types of engineered EVs was resistant to inhibition of ceramide (Supplementary Fig. 7a), which is a driver of a recognized exosome production pathway1,42.
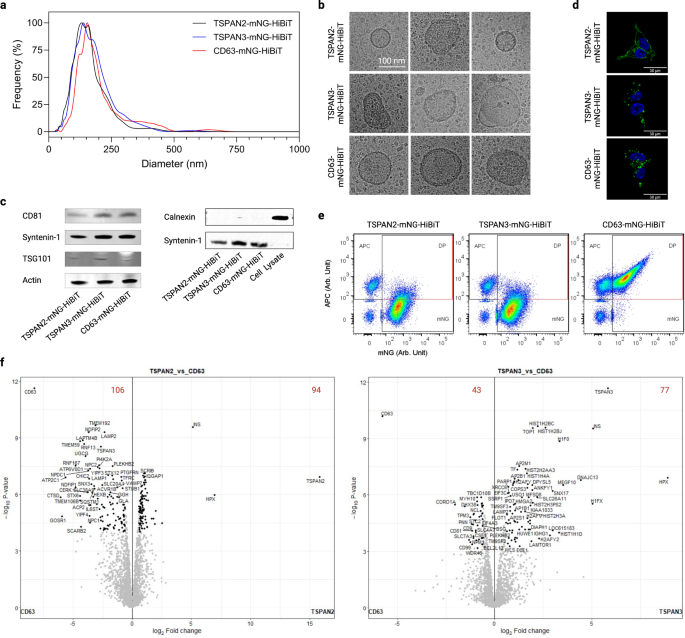
a Size distribution of EVs from transfected HEK-293T cells. b Representative cryo-electron microscopy images of EVs. c Western blots of positive and negative markers of EVs. d Cellular location of tetraspanins in transfected HEK-293T cells. e Single-vesicle flow cytometry dot plots of EVs after staining with APC-conjugated CD9/CD63/CD81 tetraspanin antibodies. f Volcano plots showing differentially enriched proteins in EVs. The red digits indicate the count of differentially enriched proteins. Results were from three biological replicates. Source data are provided as a Source Data file. The mass spectrometry proteomics data have been deposited to the ProteomeXchange Consortium via the PRIDE partner repository with the dataset identifier PXD043840.
To get an understanding of their protein signatures, EVs were stained with the classic pan-surface markers CD9/CD63/CD81 and analyzed on a single-vesicle level. Overexpression of the tetraspanins differently affected the yield of total EVs (defined as all fluorescent events, Supplementary Fig. 7b) and engineered EVs (defined as mNG+ events, Supplementary Fig. 7c). More interestingly, only a small fraction of TSPAN2- and TSPAN3-engineered EVs displayed the three classic EV markers on surface (Fig. 6e). In addition, EV surface expression analysis of 39 proteins by multiplex bead-based flow cytometry43 revealed that the surface epitope composition of TSPAN2-positive EVs differed from that of CD9/CD63/CD81-positive EVs (Supplementary Fig. 7d). Besides surface proteins, in-depth proteomic analyses of EVs showed a plethora of differentially enriched proteins for TSPAN2 (106 de-enriched and 94 enriched) and TSPAN3 (43 de-enriched and 77 enriched) compared to CD63-engineered EVs. CD9/CD63/CD81 were among the proteins that were significantly downregulated in TSPAN2/TSPAN3-engineered EVs, which is in line with the results obtained from single-vesicle and bead-based flow cytometry. Based on Gene Ontology analysis, in comparison with wild-type EVs from HEK293T cells, all three types of engineered EVs (CD63, TSPAN2 and TSPAN3) were enriched (>10%) with metabolite interconversion enzymes, protein modifying enzymes, and RNA metabolism proteins, but depleted (>10%) of extracellular matrix proteins (Supplementary Fig. 8). Next, we compared the overall protein composition with a Principal Clustering Analysis tool and observed that engineered EVs were different from wild-type EVs and to a lesser extent also from each other (Supplementary Fig. 7e). Interestingly, in relative to WT EVs, overexpression of TSPAN2 negatively impacted CD63 and TSPAN3 levels, which could indicate a competitive relationship. TSPAN3 overexpression, on the other hand, led to a slight increase in CD63 levels suggesting a positive regulation (Supplementary Fig. 7f). Overall, these findings illustrate that TSPAN2/TSPAN3-based engineering gives rise to EV subpopulations distinct from CD63.
TSPAN2- and TSPAN3-engineered EVs as delivery modalities
To explore whether TSPAN2/TSPAN3-engineered EVs are suitable for cellular delivery, we investigated their delivery potential in vitro and in vivo. First, Huh-7 cells were treated with mNG-labeled EVs to examine their subcellular location in recipient cells. The strong punctate yellow signal clearly indicated efficient internalization and trafficking to lysosomes (Fig. 7a). Quantification of cellular MFI using flow cytometry revealed slightly better uptake efficiencies for TSPAN2/TSPAN3-engineered EVs compared to CD63-engineered EVs (Fig. 7b). For EV distribution studies in mice, equal amounts of engineered EVs (based on Tluc activity) were administered intravenously and tracked in real time with in vivo imaging system (Supplementary Fig. 9a and Fig. 7c). For all three types of engineered EVs, we observed rapid distribution to liver and spleen within 5 min (Fig. 7c) and a notable decline in whole-body activity over 30 min (Supplementary Fig. 9c, P = 0.0006, Kruskal–Wallis test). TSPAN2- and TSPAN3-engineered EVs seemed to confer slightly higher whole-body retention than CD63-engineered EVs (Supplementary Fig. 9b). Results from subsequent ex vivo measurements supported the dominant hepatic and splenic accumulation of engineered EVs (Fig. 7d). Taken together, like CD63-engineered EVs, TSPAN2- and TSPAN3-engineered EVs are efficiently taken up by cells in vitro and in vivo.
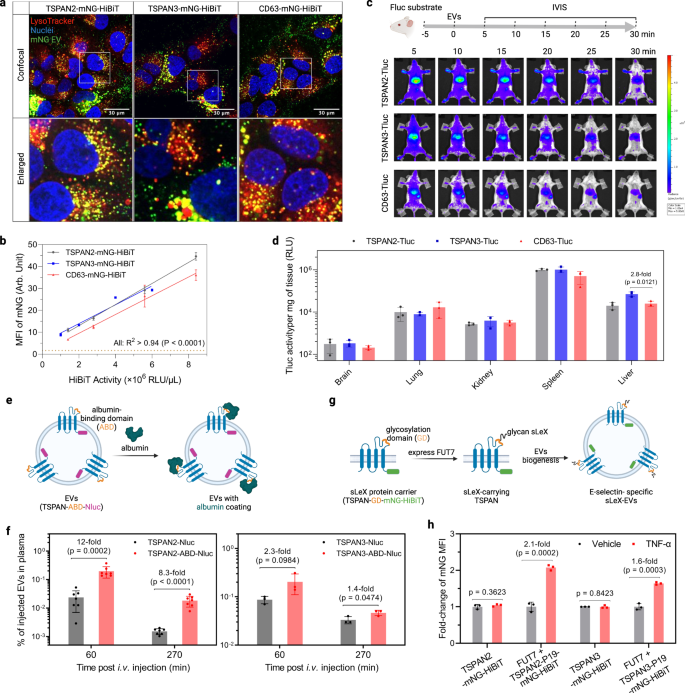
a Huh-7 cells were treated with EVs for 4 h and stained with LysoTracker to visualize lysosomes. Confocal microscopy images from representative regions from the whole well are shown. The experiment was performed once. b Huh-7 cells were treated with EVs for 8 h. Cellular mNG MFI was quantified using flow cytometry. Data are shown as mean ± standard deviation of three biological replicates. The degree of correlation was analyzed with linear regression and is shown as goodness-of-fit (R2) and significance of non-zero slope (P). c Biodistribution of EVs in mice. NMRI mice were intraperitoneally injected with d-luciferin substrate. Five minutes later, mice were intravenously injected with the same amount of engineered EVs (based on Tluc activity) and imaged with IVIS. Subsequently, major organs were collected for ex vivo bioluminescence measurements. Representative IVIS images are shown. N = 3. d Tluc activity in organs ex vivo after IVIS. Results are shown as mean ± standard deviation of three mice. e Scheme of generating albumin-binding EVs. EVs were collected from HEK-293T cells stably expressing the fusion proteins. f Albumin-binding EVs were injected intravenously and their concentration in plasma was determined. Data are shown as mean ± standard deviation. N = 7 (for TSPAN2-related) or 3 (for TSPAN3-related). g Scheme of sLeX display on EVs. EVs were collected from HEK-293T cells stably expressing the components. h HUVEC cells were activated by TNF-α for 2 h and treated with EVs for 6 h. Cellular mNG MFI was quantified using flow cytometry and is shown as fold-change over un-activated cells. c, e, g Created with BioRender.com. Data are shown as mean ± standard deviation of three biological replicates. Two-sided Student’s t test. Source data are provided as a Source Data file.
Having extensively showcased the loading and delivery capacity of TSPAN2 and TSPAN3 for luminal cargo, we next investigated their potential for EV surface display applications. The large extracellular loops (LELs) of some tetraspanins have already been exploited for such applications and given the topological similarities of tetraspanin proteins, we sought to engineer the LELs of TSPAN2 and TSPAN3. Insertion of an albumin-binding domain (ABD) into the LEL of CD63, CD9, and CD81 has been shown to drastically extend the plasma circulation time of EVs44. Using the same strategy, an ABD was cloned into the LEL of TSPAN2 and TSPAN3 with Nluc at the C-terminus for quantification (Fig. 7e). EVs were collected from HEK-293T cells stably expressing TSPAN-ABD-Nluc fusion proteins (Supplementary Fig. 9c) and assessed for their albumin-binding ability. As expected, only ABD-displaying EVs bound to albumin (Supplementary Fig. 9d). Next, these EVs were intravenously injected into mice and EV concentrations in plasma were measured on the basis of Nluc at different timepoints. In comparison to wild-type tetraspanin-engineered EVs, ABD-displaying EVs had significantly higher concentration in plasma, particularly when using TSPAN2 as the scaffold protein (Fig. 7f).
In another example, we aimed to achieve activated endothelial cell-specific targeting through surface display of the glycan ligand sialyl Lewis X (sLeX)45. Therefore, a 19-mer sLeX peptide carrier (P19) was inserted into the LEL of each tetraspanin protein with mNG-HiBiT at the C-terminus. In the presence of fucosyltransferase VII (FUT7), P19 is glycosylated to display sLeX (Fig. 7g). Based on this rationale, sLeX-EVs were produced from HEK-293T cells stably expressing FUT7 and TSPAN-P19-mNG-HiBiT (Supplementary Fig. 9c). Their uptake was evaluated in TNF-α-activated endothelial cells, which express E-selectin, the main receptor for sLeX. Wild-type tetraspanin-engineered EVs were taken up similarly in un-activated and activated endothelial cells while sLeX-EVs, using either TSPAN2 or TSPAN3 as the scaffold, demonstrated preferable uptake by activated endothelial cells (Fig. 7h). Overall, this demonstrates the feasibility of TSPAN2 and TSPAN3 in terms of simultaneous engineering of the LEL for surface display and C-terminus for luminal cargo loading, thus highlighting their potential for therapeutic applications.
- SEO Powered Content & PR Distribution. Get Amplified Today.
- PlatoData.Network Vertical Generative Ai. Empower Yourself. Access Here.
- PlatoAiStream. Web3 Intelligence. Knowledge Amplified. Access Here.
- PlatoESG. Automotive / EVs, Carbon, CleanTech, Energy, Environment, Solar, Waste Management. Access Here.
- BlockOffsets. Modernizing Environmental Offset Ownership. Access Here.
- Source: https://www.nature.com/articles/s41467-023-40453-0

