Introduction
Logistic regression is a statistical technique used to model the probability of a binary (categorical variable that can take on two distinct values) outcome based on one or more predictor variables. Unlike linear regression, which predicts continuous variables (assumes any infinite number in a given interval), logistic regression is used for categorical outcomes with two possible outcomes: yes/no, pass/fail, or 0/1. This is a guide on running a binary logistic regression model with Julius.
Overview
- Understand the fundamentals of logistic regression and its application to binary outcomes.
- Learn how to prepare and validate a dataset for binary logistic regression analysis.
- Gain insights into checking and addressing multicollinearity and other model assumptions.
- Discover how to interpret the results of a binary logistic regression model.Utilize Julius AI to streamline the process of running and evaluating logistic regression models.
Table of contents
What is Julius AI?
Julius AI is a powerful tool for data scientists. It analyzes and visualizes large datasets, providing insights through clear visual representations. It performs complex tasks like forecasting and regression analysis. Julius AI also trains machine learning models, automating algorithm selection, parameter tuning, and validation. It streamlines workflows, reduces manual effort, and enhances accuracy and efficiency in data-driven projects.
Now, let’s look at how Julius AI can be used to run a Binary Logistic Regression Model.
Dataset Assumptions
To run a binary logistic regression, we must make sure our dataset follows the following assumptions:
- Binary outcome is dependent variable must be binary: has exactly two categories
- The observations must be independent, meaning one variable’s outcome should not influence another’s outcome.
- Linearity of Logit is the relationship between each predictor variable, and the log odds of the outcome should be linear.
- No Multicollinearity should be little to no multicollinearity among the independent variables.
- A large sample size helps ensure the stability and reliability of the estimates.
Research Question
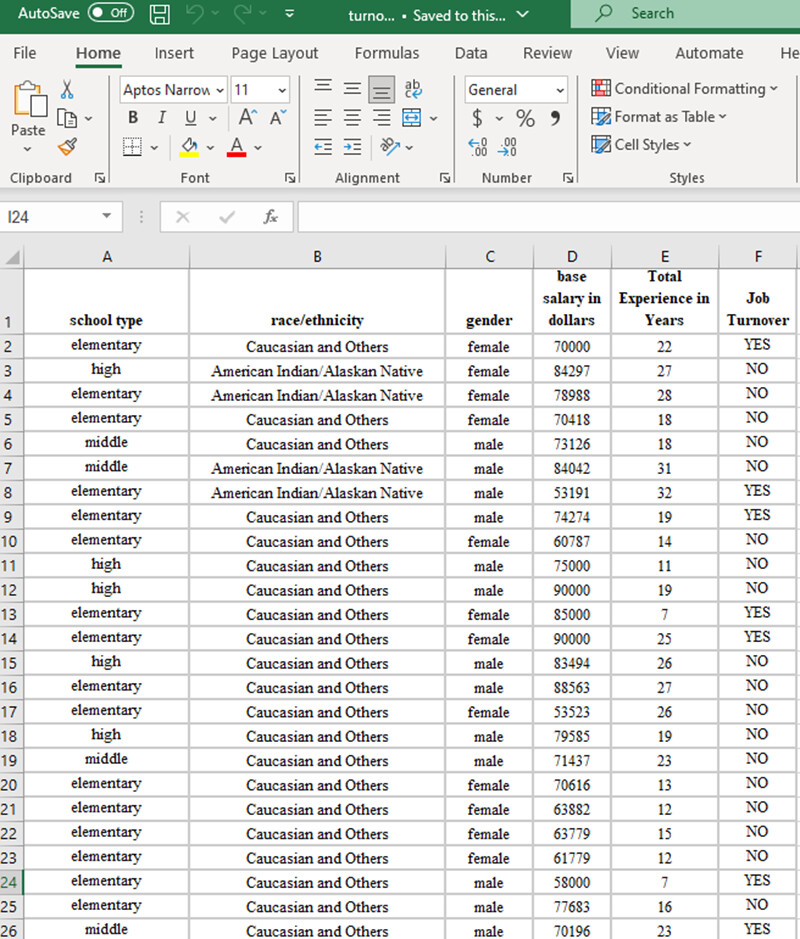
Here, we wanted to investigate whether demographic variables would predict turnover rates in different educational settings. We retrieved publicly available data on state education agencies regarding different school principals. We measured the turnover rate as either yes or no (fulfilling the assumption of a binary factor) for two years following the study. Other variables listed in the database included school type, race/ethnicity, gender, base salary, and total educational experience recorded in years. The dataset contained over 1200 school principals (Assumption of large sample size satisfied). A preview of the dataset is listed below.
Methodology
We created prompts to be clear and concise. We used Julius, the leading statistical software tool, which did not automatically produce everything associated with the model. Consequently, we checked model assumptions and identified dependent variables and predictor values. We then ran descriptive statistics and assessed model fit. After each prompt, we instructed Julius to interpret the findings. Below is a comprehensive list of our prompts and Julius’s output. We replicated Julius’s exact outputs, recording the original conversations without modifications. We used SPSS to verify the accuracy of Julius’s outputs.
Prompts
User: Run a binary logistic regression model. Check the following logistic model assumptions:
- There must be no perfect multicollinearity among independent variables
- Continuous predictors are linearly related to a transformed version of the outcome (linearity). The dependent variable is job turnover. The predictor variables are school type, race, ethnicity, gender, base salary in dollars, and total experience in years.
The final model report should include the following:
- Descriptive statistics on the outcome variable and each predictor.
- Information on which assumptions were checked and whether they were met.
- A statement about model significance, model fit, and the model estimates, including ORs and their 95% CI.
- An interpretation of the findings
- Show the percentage of variance explained using R squared, and show the contribution of each predictor value.
Guide on Running a Binary Logistic Regression Model with Julius
Let us now look at the step-by-step on running a binary logistic regression model with Julius:
Step 1: Previewing the Dataset
The dataset from Sheet 1 of the turnover.xlsx was loaded. Here’s a preview of the data:
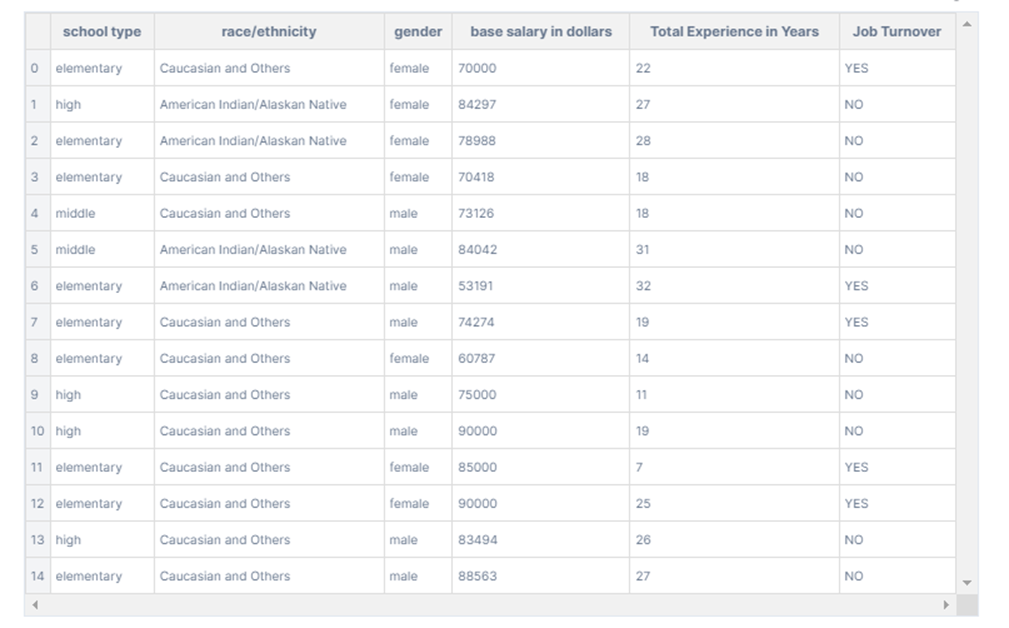
Now, I’ll proceed with the binary logistic regression model analysis, including checking the model assumptions, descriptive statistics, model significance, fit, estimates, and interpretation of the findings. Let’s start with the descriptive statistics of the outcome variable and each predictor.
Step 2: Checking the Descriptives Statistics, Model Significance, Fit, and Estimates
The descriptive statistics for the numerical variables (base salary in dollars and total experience in years) and the outcome variable (job turnover, encoded as 0 for ‘NO’ and 1 for ‘YES’) are as follows:

For the categorical variables (school type, race/ethnicity, gender), the descriptive statistics are:

Step 3a: Checking for Multicollinearity amongst Independent Variables using VIF & Logit Linearity
Next, I’ll check the logistic model assumptions, starting with testing for multicollinearity among the independent variables and then assessing the linearity of continuous predictors with the logit of the outcome.
The Variance Inflation Factor (VIF) was used to check for multicollinearity amongst variables. The results are as follows:
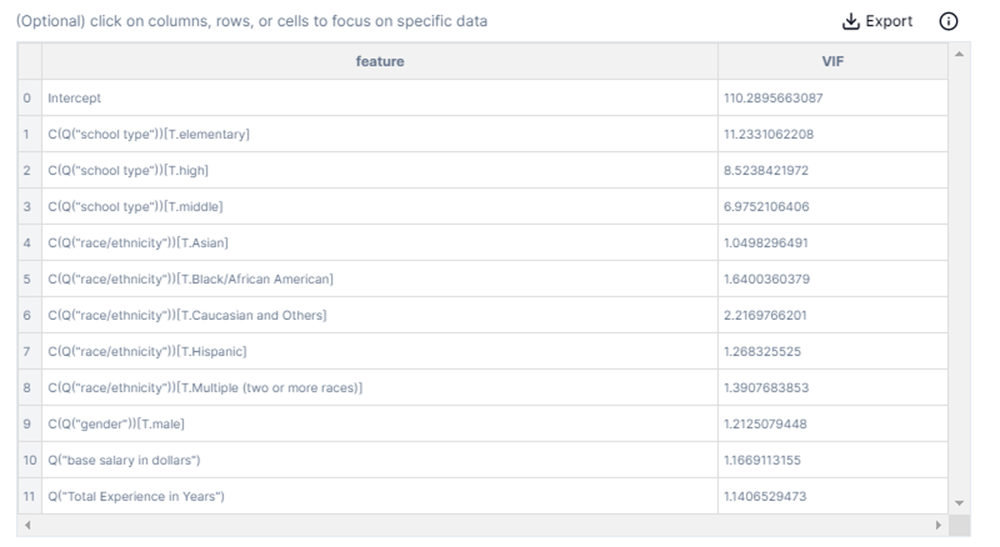
The VIF for most variables is below 10, which is generally acceptable and indicates no severe multicollinearity. However, the ‘Intercept’ and some categories within ‘school type’ have higher VIF values, suggesting potential multicollinearity issues within these categorical variables.
When attempting to check the linearity assumption using the Box-Tidwell test, an error occurred due to missing data or infinite values in the transformed variables. This suggests that zero or negative values in ‘base salary in dollars’ and ‘Total Experience in Years’ might result in undefined values when logged.
Step 3b: Addressing Problematic Values: Zeros or Negative Values
Before proceeding, I must address this issue by removing or imputing these problematic values. Let’s first inspect the data for any zero or negative values in these columns and decide on the next steps.
The rows with zero values in the ‘Total Experience in Years’ column caused the error during the linearity assumption check. Here are the problematic rows:
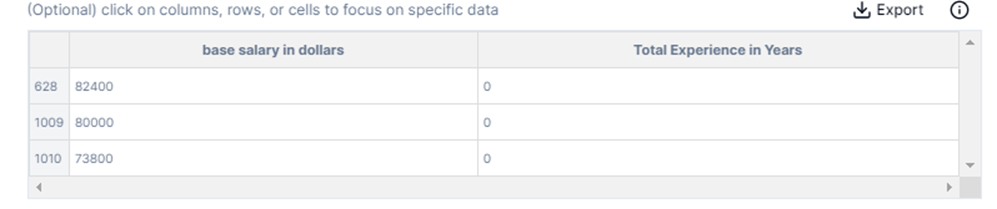
We have a few options to proceed with the linearity assumption check: Remove these rows from the dataset. Input the zero values with a suitable statistic (e.g., the mean or median of ‘Total Experience in Years’).
Julius could run descriptive statistics, run the assumptions, and ask us how we would like to handle the missing data. Let’s proceed:
User: Would you like to remove the rows with zero values in “Total Experience in Years” or input the zero values with a suitable statistic?
Julius: To maintain the integrity of the data for the logistic regression analysis, let’s remove the rows with zero values in ‘Total Experience in Years.’ This approach will allow us to assess the linearity assumption accurately without artificially altering the data distribution. I’ll remove these rows and then re-attempt the linearity assumption check.
Step 4: Outcome of the Linearity Assumption Check
We completed the linearity assumption check using the Box-Tidwell test after removing rows with zero values in ‘Total Experience in Years.’ Here are the results of the logistic regression model:
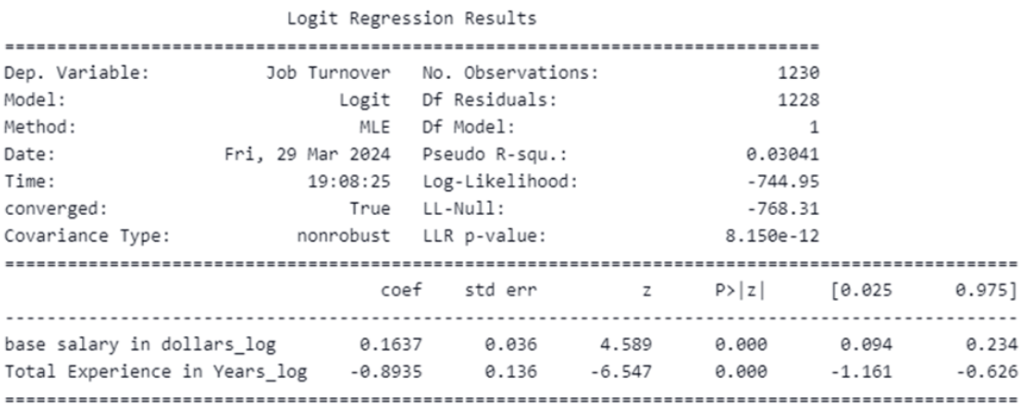
The model includes the log-transformed ‘base salary in dollars’ and ‘Total Experience in Years’ predictors. Both predictors are statistically significant, as indicated by their p-values (P<0.05). The coefficient for ‘base salary in dollars log’ is positive, suggesting that the likelihood of job turnover increases as the base salary increases. The coefficient for ‘Total Experience in Years log’ is negative, indicating that as total experience increases, the likelihood of job turnover decreases.
Step 5: Performing the Logistic Regression Model
Next, I’ll proceed with the full logistic regression model, including all predictors, to evaluate model significance, fit, estimates (ORs and their 95% CIs), and the relative contribution of each predictor variable.
The entire logistic regression model analysis has been completed. Here’s a summary of the model results:
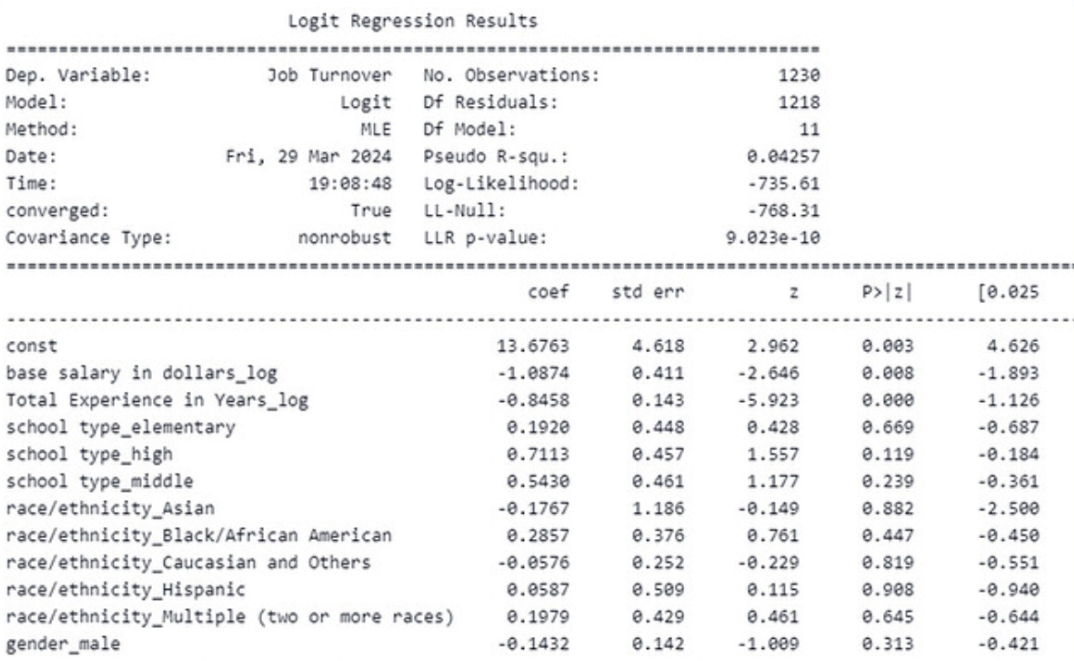
The model includes predictors such as school type, race/ethnicity, gender, log-transformed base salary, and log-transformed total experience. The model’s pseudo-R-squared value is 0.04257, indicating a modest fit. The log-transformed base salary and total experience are statistically significant predictors of job turnover, with p-values less than 0.05. The coefficients for other variables, including school type, race/ethnicity, and gender, are not statistically significant at the 0.05 level.
Step 6: Using the Odds Ratio to Quantify the Strength and Direction of Association between Variables
The Odds Ratios (ORs) and their 95% Confidence Intervals (CIs) for each predictor are as follows:
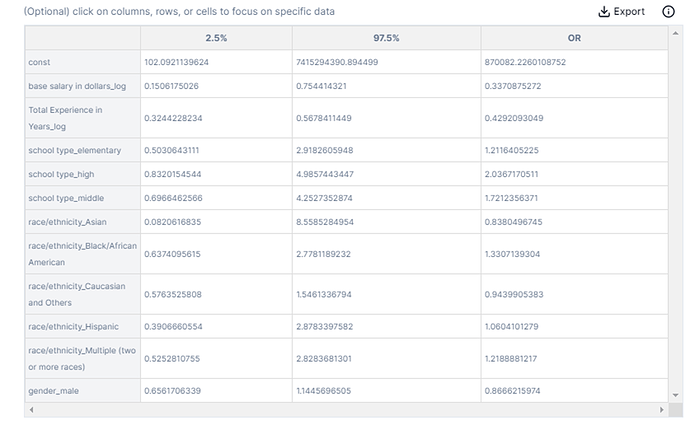
The OR for log-transformed base salary is 0.337, indicating that the odds of job turnover decrease by approximately 66.3% for each unit increase in the log-transformed base salary. The OR for log-transformed total experience is 0.429, suggesting that for each unit increase in log-transformed total experience, the odds of job turnover decrease by about 57.1%. The ORs for school type, race/ethnicity, and gender indicate their relative effects on the likelihood of job turnover, though these effects are not statistically significant.
This analysis provides insights into the factors influencing job turnover, highlighting the importance of salary and experience.
Conclusion
We found that base salary in dollars and total experience in years are two significant predictors of turnover rates among principals. The binary logistic regression model with Julius indicates that base salary, with a coefficient of -1.0874 (SE = 0.411, p = 0.008), significantly influences turnover rates. As each unit increases in log-transformed base salary, job turnover decreases by 66.3%. Additionally, total experience significantly affects turnover rates with a coefficient of -0.4792 (SE = 0.194, p = 0.014). Each unit increase in experience results in a 57.1% reduction in job turnover.
- SEO Powered Content & PR Distribution. Get Amplified Today.
- PlatoData.Network Vertical Generative Ai. Empower Yourself. Access Here.
- PlatoAiStream. Web3 Intelligence. Knowledge Amplified. Access Here.
- PlatoESG. Carbon, CleanTech, Energy, Environment, Solar, Waste Management. Access Here.
- PlatoHealth. Biotech and Clinical Trials Intelligence. Access Here.
- Source: https://www.analyticsvidhya.com/blog/2024/06/binary-logistic-regression-model-with-julius/

