On-chain data shows that Bitcoin short-term holders have participated in buying recently despite the price briefly dropping below their cost basis.
Bitcoin Has Rebounded Back Above Short-Term Holder Realized Price
As pointed out by an analyst in a CryptoQuant post, the BTC price had recently fallen below the realized price of the short-term holders. The “realized price” here refers to a metric that’s derived from the “realized cap.”
The realized cap is a popular capitalization model for Bitcoin that assumes that the true value of each coin in circulation is not the current spot price, but the price at which it was last moved/sold on the blockchain.
When this cap is divided by the total number of coins in circulation, the “realized price” emerges. The significance of this indicator is that it represents the cost basis of the average investor in the market.
In the context of the current discussion, the average acquisition price of the entire market isn’t of interest, however; the realized price for only a segment of the market is relevant: the short-term holders.
The “short-term holders” (STHs) here refer to investors who bought their coins less than 155 days ago. These investors are generally fickle and their behavior has historically been relevant to the trend BTC has followed.
Now, here is a chart that shows the trend in the Bitcoin STH realized price over the past year:
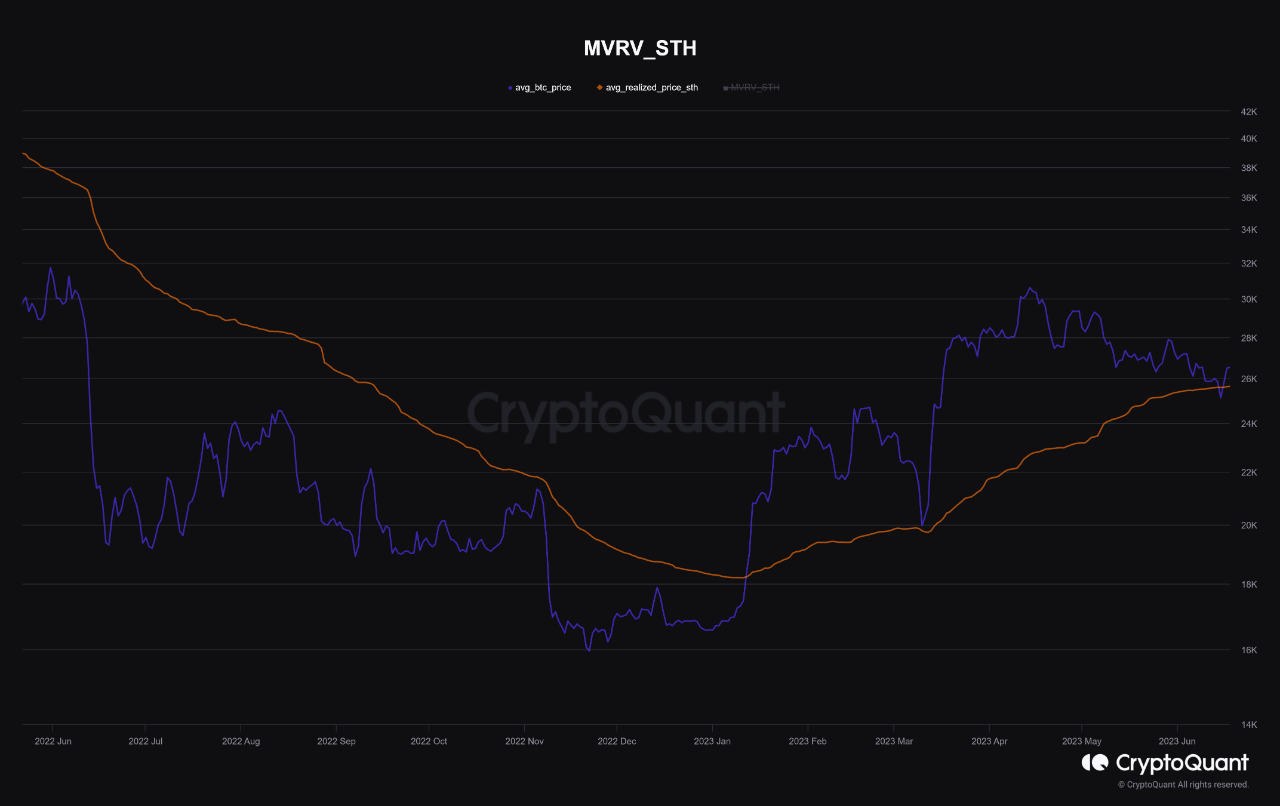
The value of the metric seems to have been near the spot price recently | Source: CryptoQuant
The STH realized price has historically displayed some interesting interactions with the spot price of Bitcoin. During bearish periods, the metric has provided resistance to the price, while in bullish trends, it has switched its role to being a support level.
Both these patterns are also visible in the above graph, where the cryptocurrency saw a negative reaction to the line around the time of the November 2022 FTX collapse, while it found support at it when the rally had taken a step back in March 2023.
As for why this pattern exists at all, the reason likely lies in the fact that the STHs look at their cost basis differently depending on the wider trend being followed in the market at the time.
During bear markets, the investors look at their acquisition price as a chance to escape. They believe that selling at their cost basis would at least mean that they can avoid taking losses. It’s this selling that becomes the source of resistance at the line.
In rallies, on the other hand, the STHs generally hold a bullish sentiment. They look at their cost basis as a profitable buying opportunity, as they think that the price would go up in the near future. The mass buying when the price touches the line may explain why the asset has observed rebounds here.
From the chart, it’s visible that Bitcoin had recently dipped slightly under this line, raising concerns about whether the bullish regime had come to an end. In the past few days, however, the asset has been able to regain itself back above the level.
Related Reading: Bitcoin Price Steadies Above $26K, Can Bulls Pump It Further?
Since the STHs didn’t participate in selling at the level when the asset retested the line from below, it’s looking likely that they still lean towards a bullish sentiment. Naturally, this could suggest that the Bitcoin rally not be over yet after all.
BTC Price
At the time of writing, Bitcoin is trading around $26,400, up 2% in the last week.
BTC has recovered back above $26,000 | Source: BTCUSD on TradingView
Featured image from Kanchanara on Unsplash.com, charts from TradingView.com, CryptoQuant.com
- SEO Powered Content & PR Distribution. Get Amplified Today.
- EVM Finance. Unified Interface for Decentralized Finance. Access Here.
- Quantum Media Group. IR/PR Amplified. Access Here.
- PlatoAiStream. Web3 Data Intelligence. Knowledge Amplified. Access Here.
- Source: https://www.newsbtc.com/bitcoin-news/bitcoin-short-term-holders-still-bullish-will-rally-restart/

