Yesterday’s news that one of the largest US exchanges Kraken will have to pay a $30 million fine to the US Securities and Exchange Commission and shut down its crypto-staking product for US customers has caused a lot of uncertainty, including in the Bitcoin market.
In recent days, it has become increasingly apparent that U.S. authorities are pursuing a strict agenda against crypto companies in the wake of the FTX collapse. In particular, the US authorities’ efforts are targeting the banking sector, which provides the on- and off-ramp for exchanges, and stablecoins.
Therefore, even though crypto-staking has nothing to do with Bitcoin at first glance, there is concern that centralized exchanges in the U.S. are facing major challenges that may also affect the Bitcoin market.
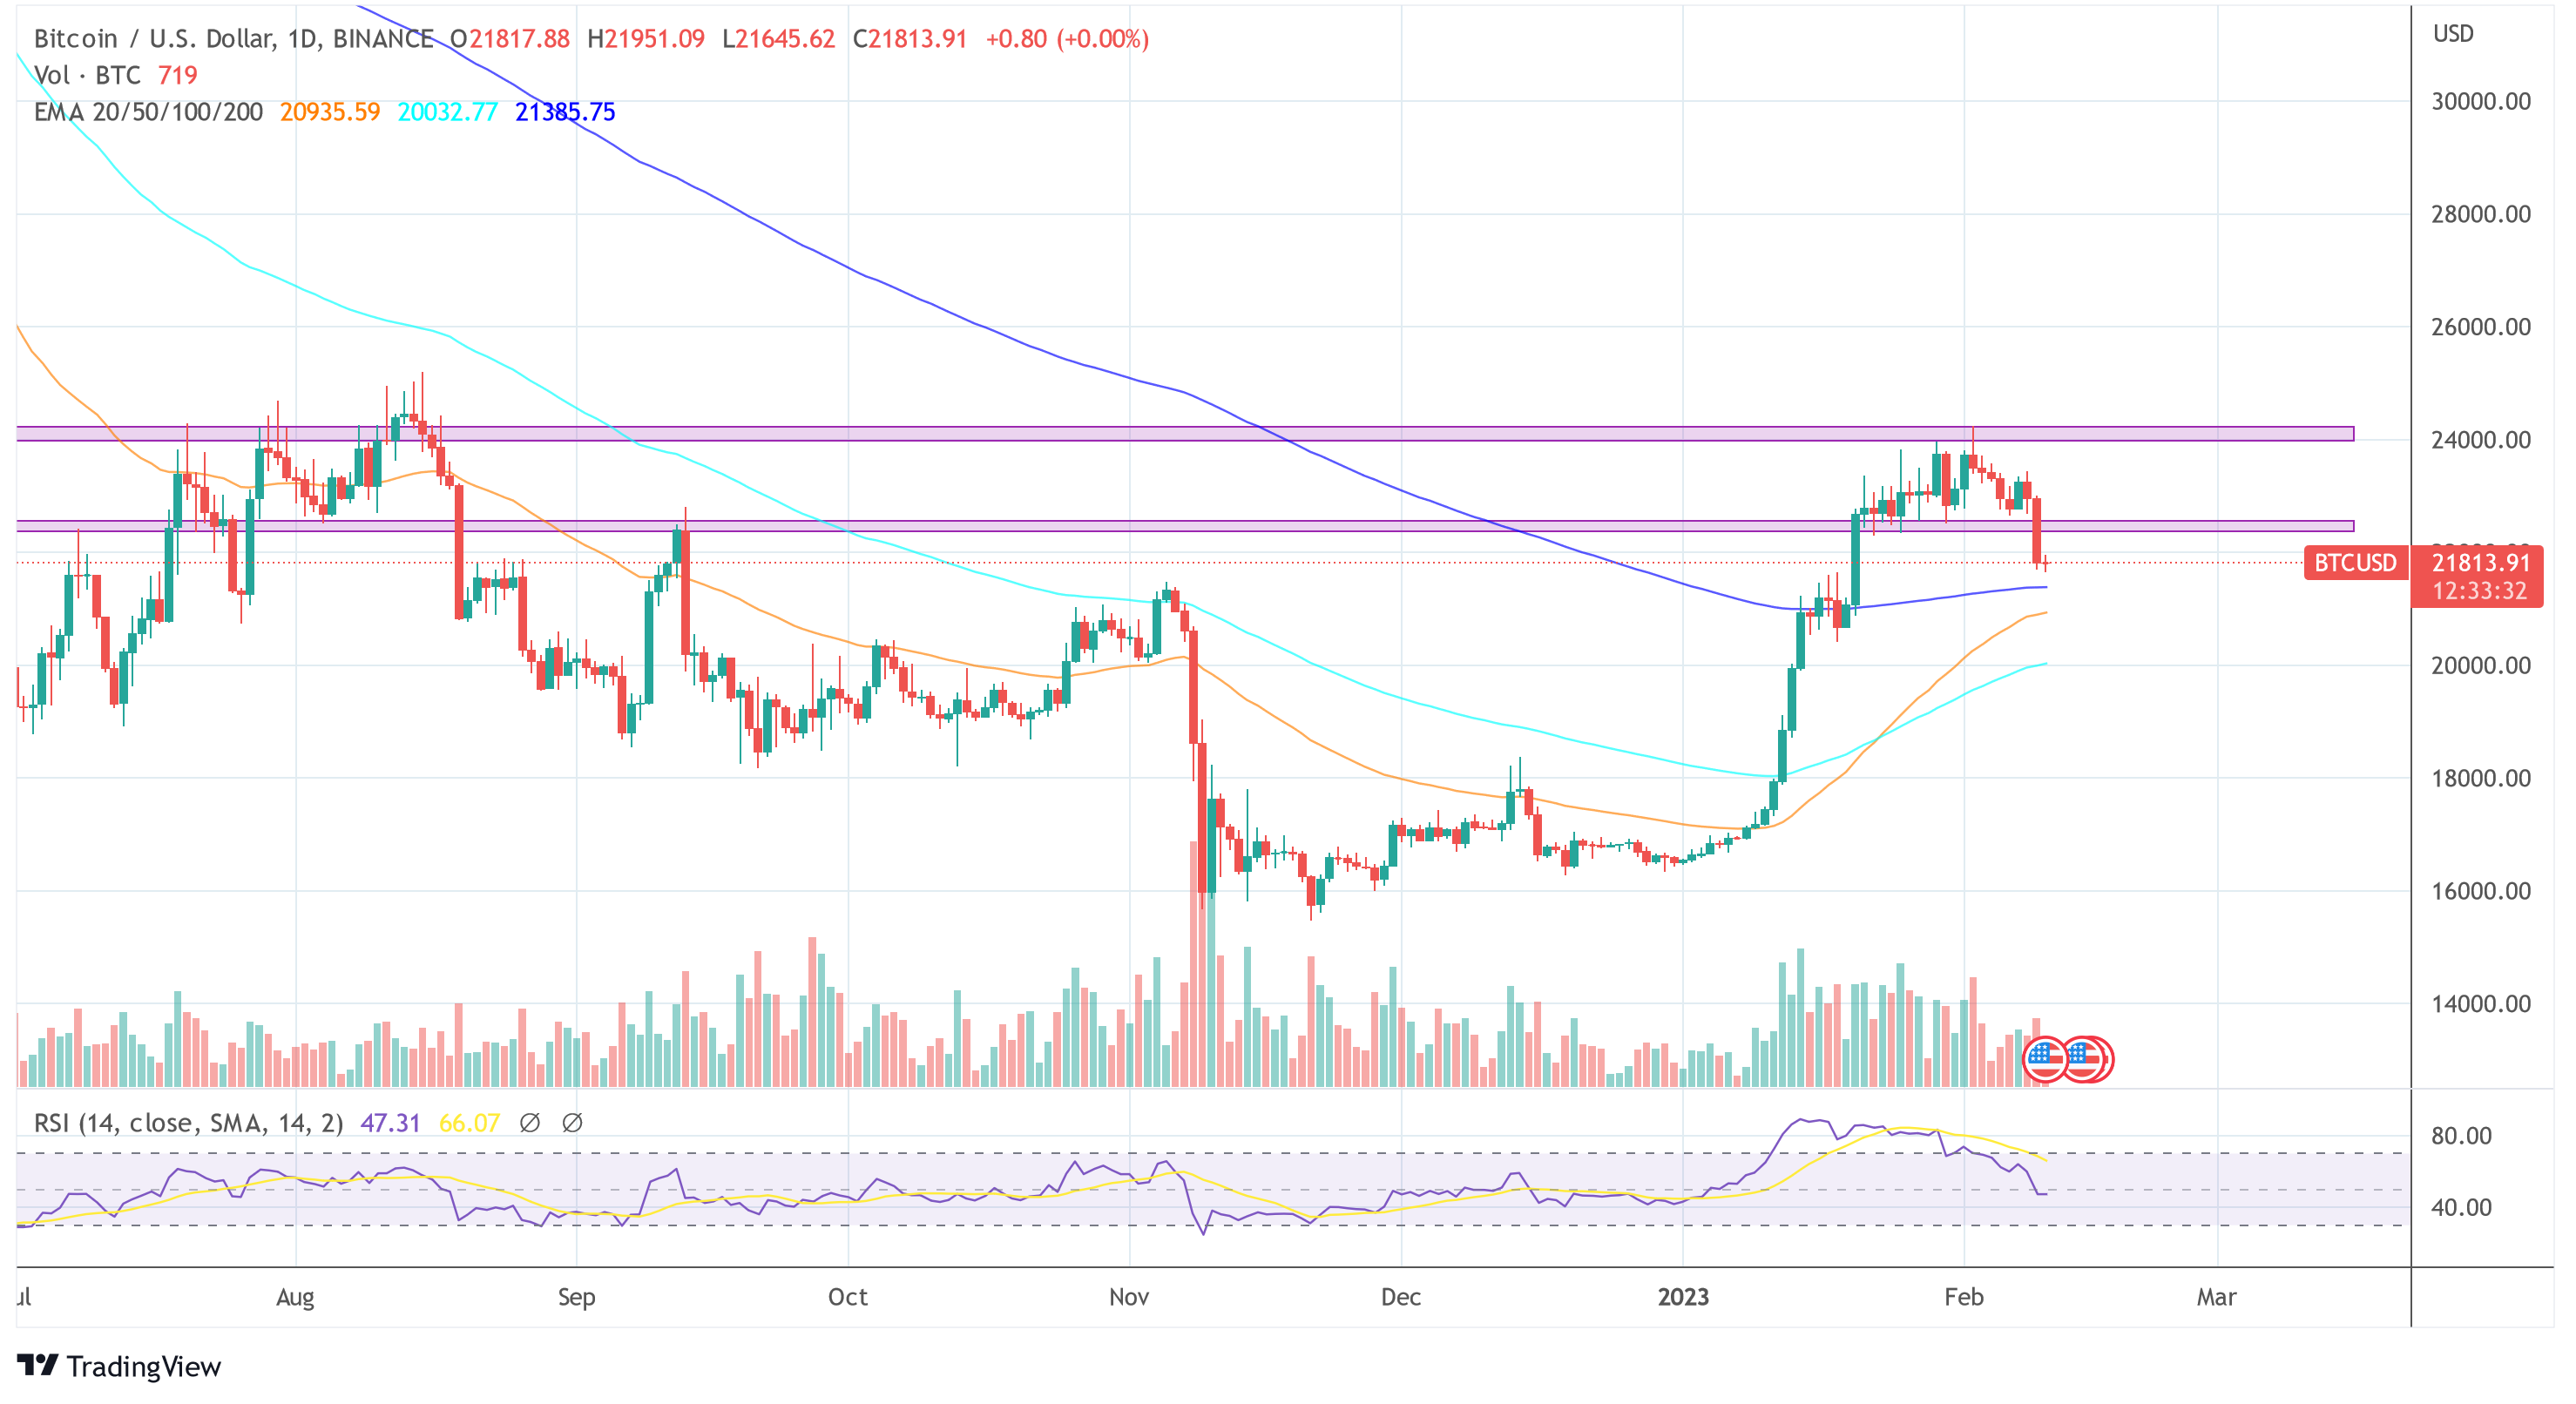
In this respect, it is not surprising that the Bitcoin price has lost support at $22,370. The support level had been tested five times since January 23. Yesterday’s news could not be absorbed by the Bitcoin bulls.
For the moment, BTC reached a low of $21,633, where the next region of support can be found at $21,600 to $21,500. If the support also breaks, the 200-day exponential moving average (EMA) could provide the most important support, which is currently at $21,383.
Bitcoin Bears Or Bulls Taking Over?
The good news is that the daily RSI is completely set back to neutral with 47, after it topped in mid-January at 87. On the other hand, the spot orderbook of the largest spot exchange, Binance, is also displaying a strong support between $21,400 and $21,600 as buy walls have formed in this range.
$BTC Binance spot orderbook.
Look at those buy walls at 21.4k – 21.6k, will be watching them closely. #Bitcoin pic.twitter.com/UCK97jeI2U
— exitpump (@exitpumpBTC) February 9, 2023
As long as the area above the 200-day EMA is defended by the bulls, the current price trend can be dismissed as a healthy correction. The uptrend remains intact.
However, if BTC falls below the 200-day EMA, this could be seen as a failed attempt by the Bitcoin bulls to establish a trend change. In addition, it can be interpreted as bearish for Bitcoin because the price (presumably) fails to establish a new high for the moment in the weekly chart.
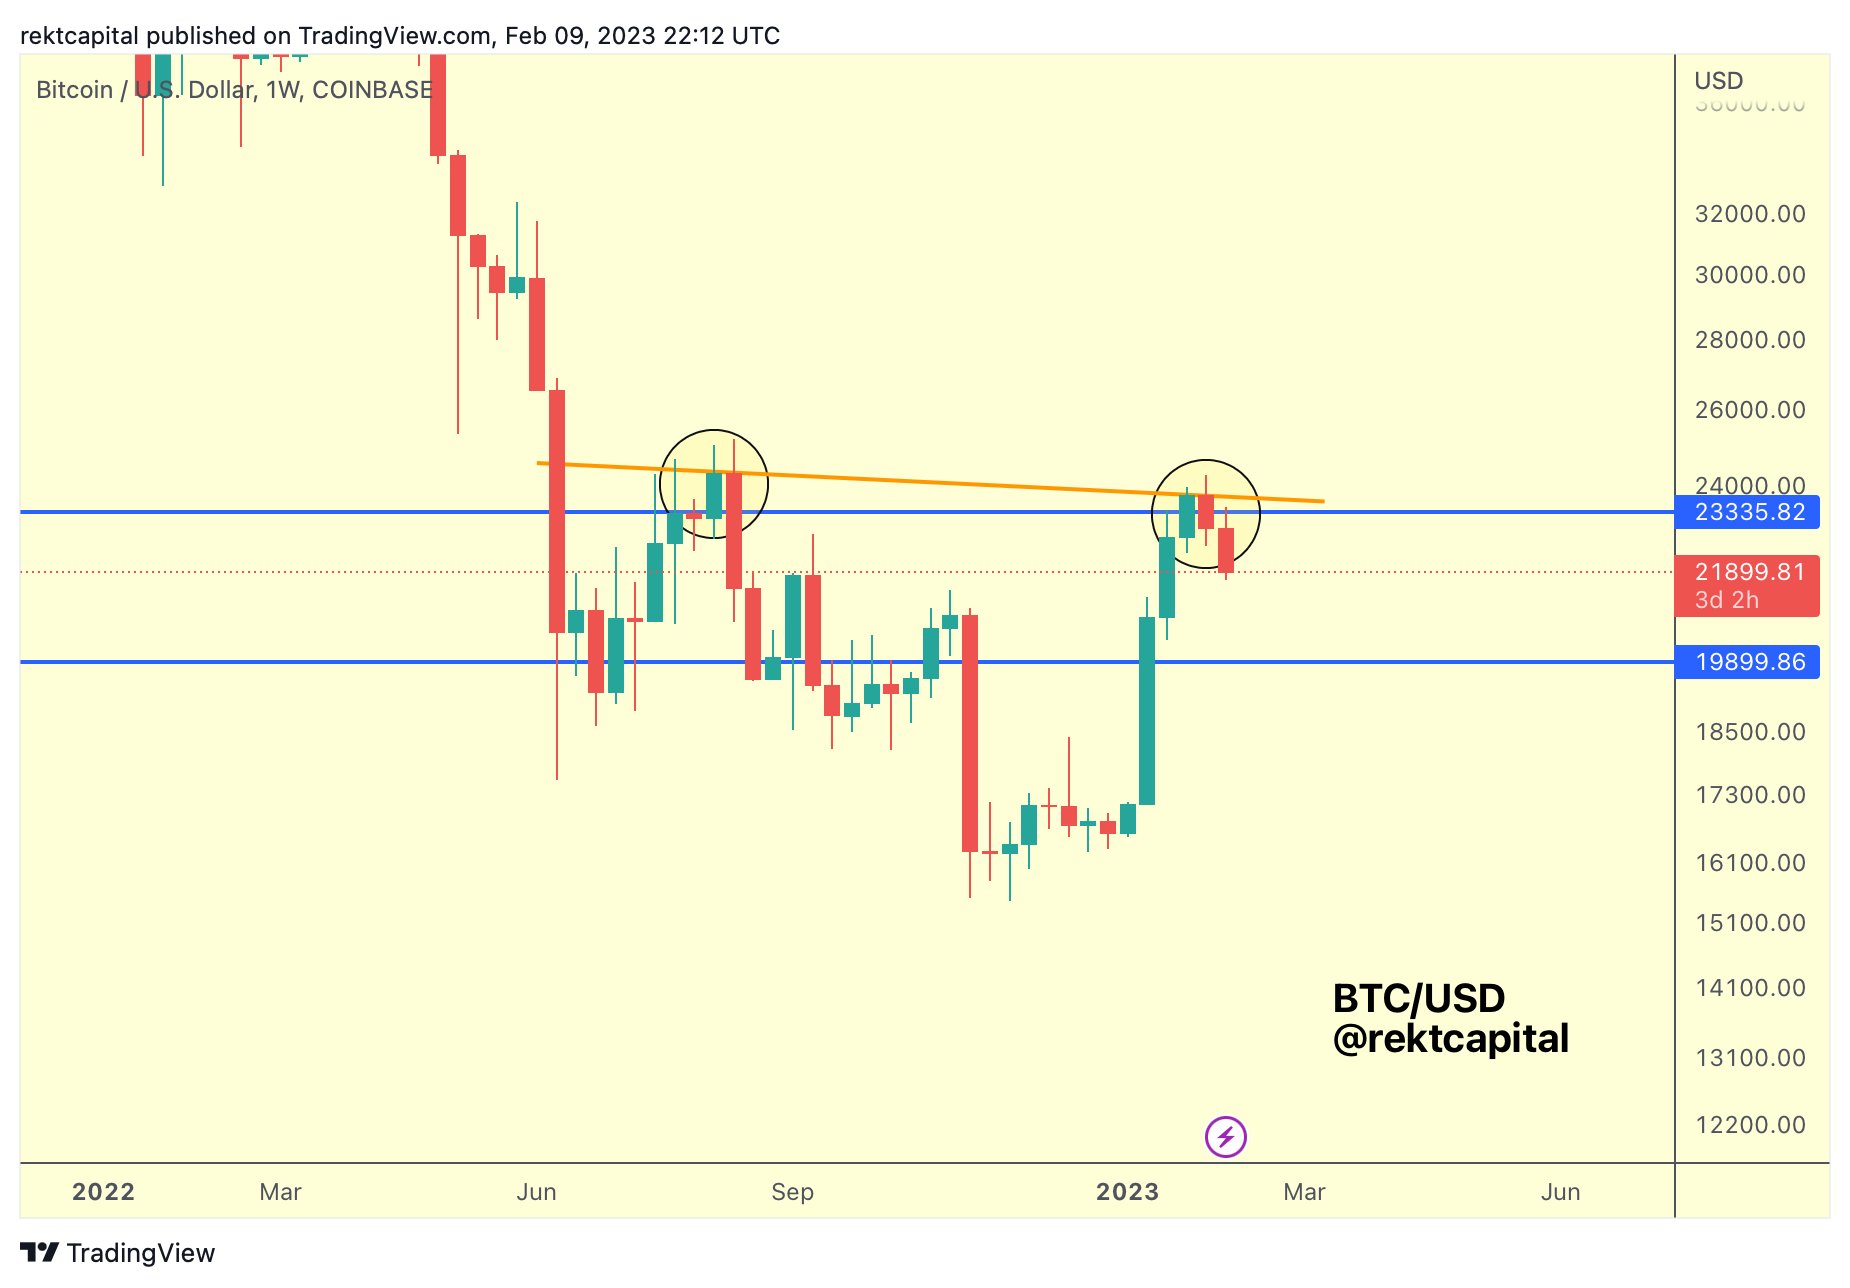
Analyst Rekt Capital shared the following 1-week chart of BTC and states:
BTC performs yet another fake-breakout by failing to retest the ~$23,400 level as support. In the process, BTC has formed a new Lower High resistance.
Meanwhile, from an on-chain perspective, Bitcoin momentum is shifting into positive territory. The adjusted output profit ratio (aSOPR) is breaking out and holding above 1.0, showing that the market has realized gains on the chain for the first time since April 2022, as explained by analyst James Straten.
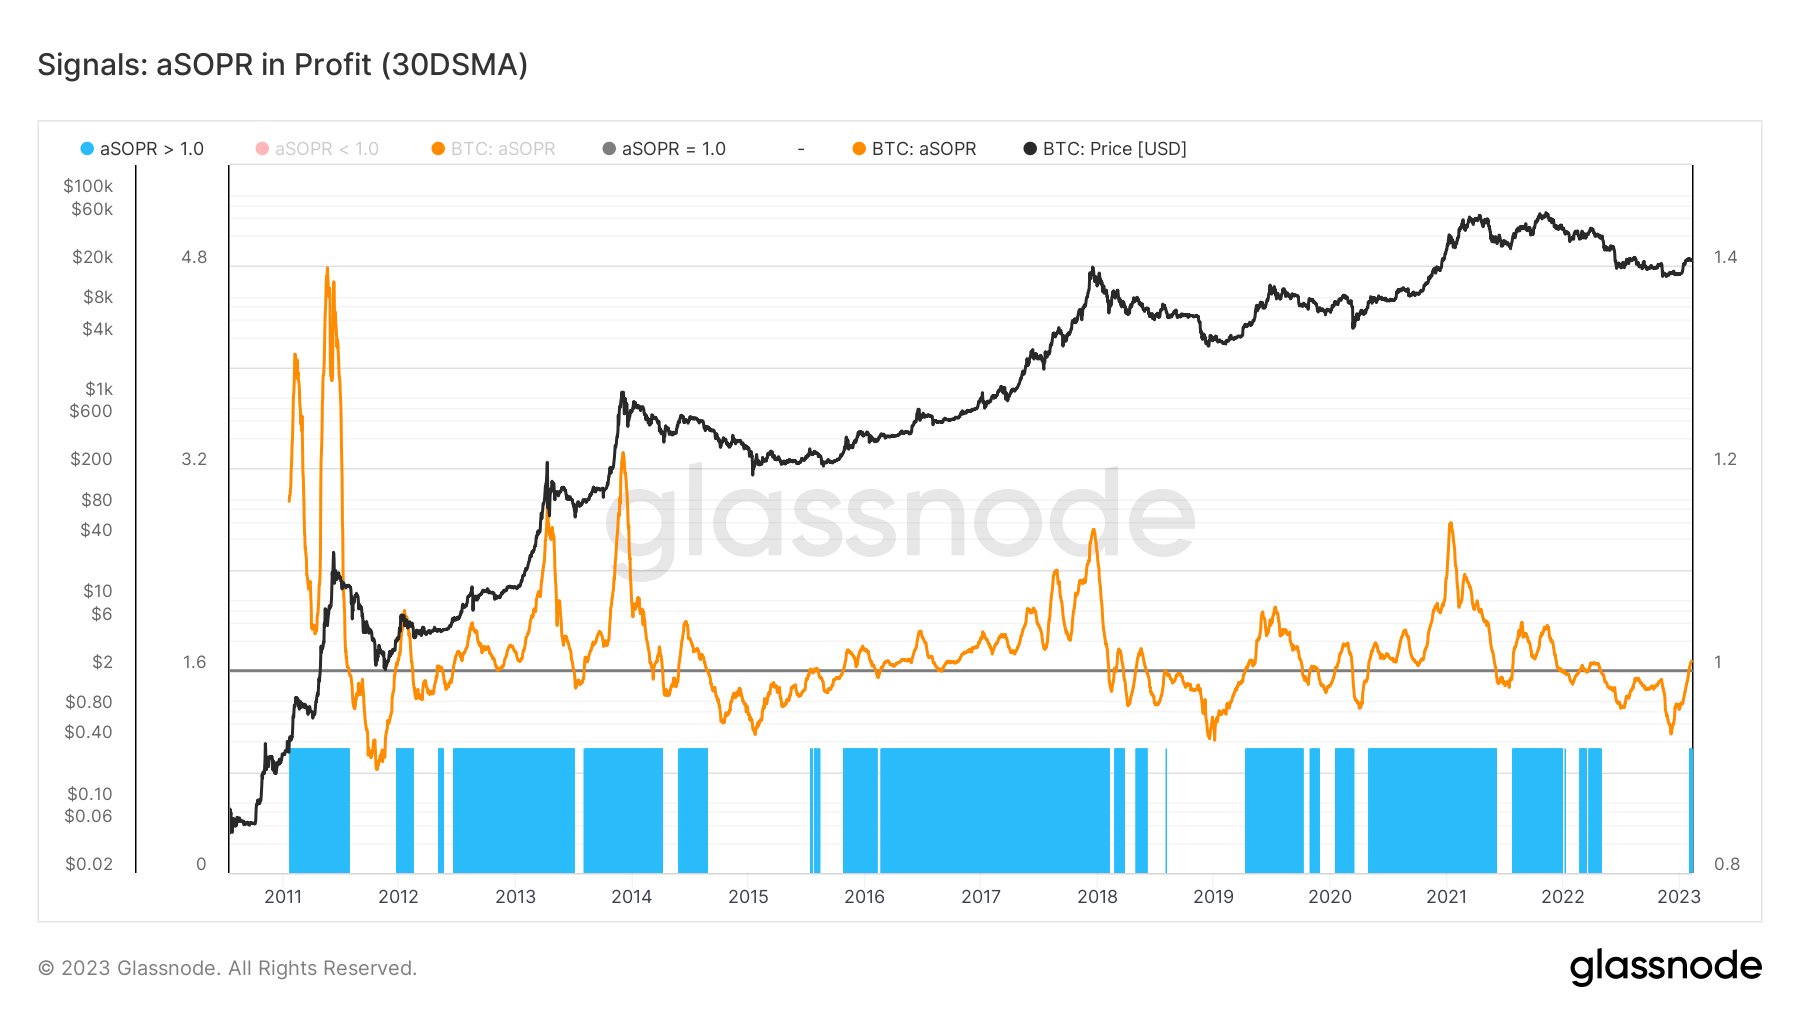
This is also confirmed by the realized P/L ratio on the gains. The market is now realizing a greater proportion of gains in USD than losses. Sellers with an unrealized loss are exhausted and generally adjust to a healthier inflow of demand.
Featured image from iStock, Chart from TradingView.com
- SEO Powered Content & PR Distribution. Get Amplified Today.
- Platoblockchain. Web3 Metaverse Intelligence. Knowledge Amplified. Access Here.
- Source: https://www.newsbtc.com/news/bitcoin/bitcoin-bear-market-back-or-slight-correction/

