Image by Author
Exploratory Data Analysis (or EDA) stands as a core phase within the Data Analysis Process, emphasizing a thorough investigation into a dataset’s inner details and characteristics.
Its primary aim is to uncover underlying patterns, grasp the dataset’s structure, and identify any potential anomalies or relationships between variables.
By performing EDA, data professionals check the quality of the data. Therefore, it ensures that further analysis is based on accurate and insightful information, thereby reducing the likelihood of errors in subsequent stages.
So let’s try to understand together what are the basic steps to perform a good EDA for our next Data Science project.
I am pretty sure you have already heard the phrase:
Garbage in, Garbage out
Input data quality is always the most important factor for any successful data project.
Unfortunately, most data is dirt at first. Through the process of Exploratory Data Analysis, a dataset that is nearly usable can be transformed into one that is fully usable.
It’s important to clarify that it is not a magic solution for purifying any dataset. Nonetheless, numerous EDA strategies are effective at addressing several typical issues encountered within datasets.
So… let’s learn the most basic steps according to Ayodele Oluleye in his book Exploratory Data Analysis with Python Cookbook.
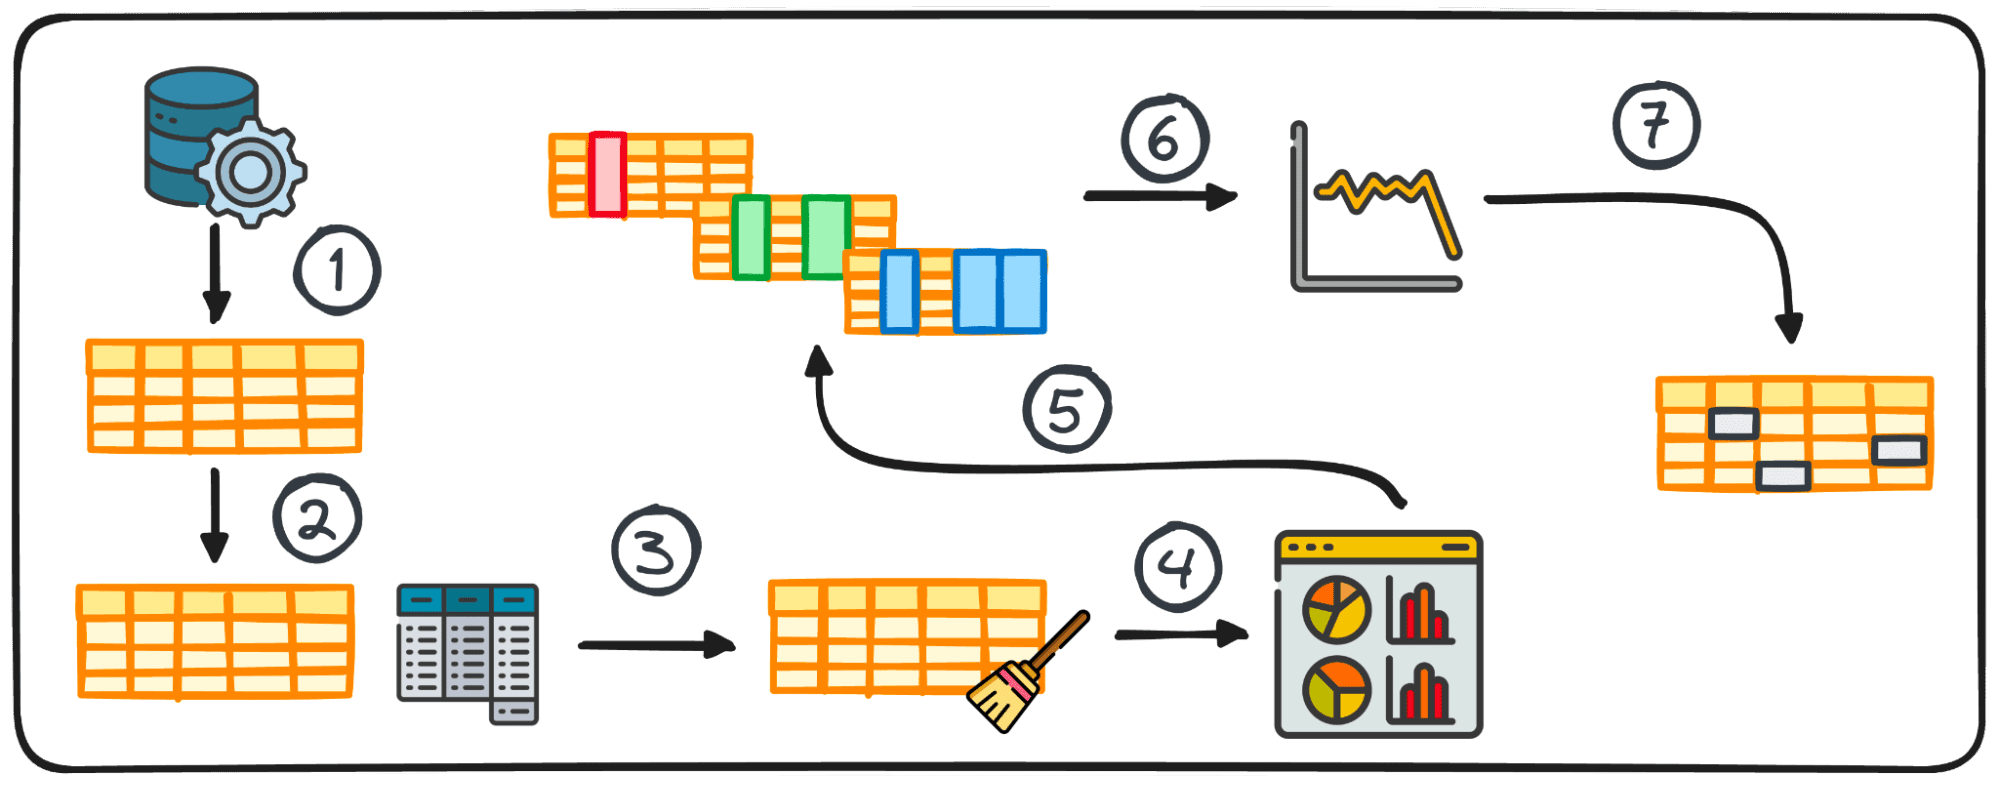
Step 1: Data Collection
The initial step in any data project is having the data itself. This first step is where data is gathered from various sources for subsequent analysis.
2. Summary Statistics
In data analysis, handling tabular data is quite common. During the analysis of such data, it’s often necessary to gain rapid insights into the data’s patterns and distribution.
These initial insights serve as a base for further exploration and in-depth analysis and are known as summary statistics.
They offer a concise overview of the dataset’s distribution and patterns, encapsulated through metrics such as mean, median, mode, variance, standard deviation, range, percentiles, and quartiles.
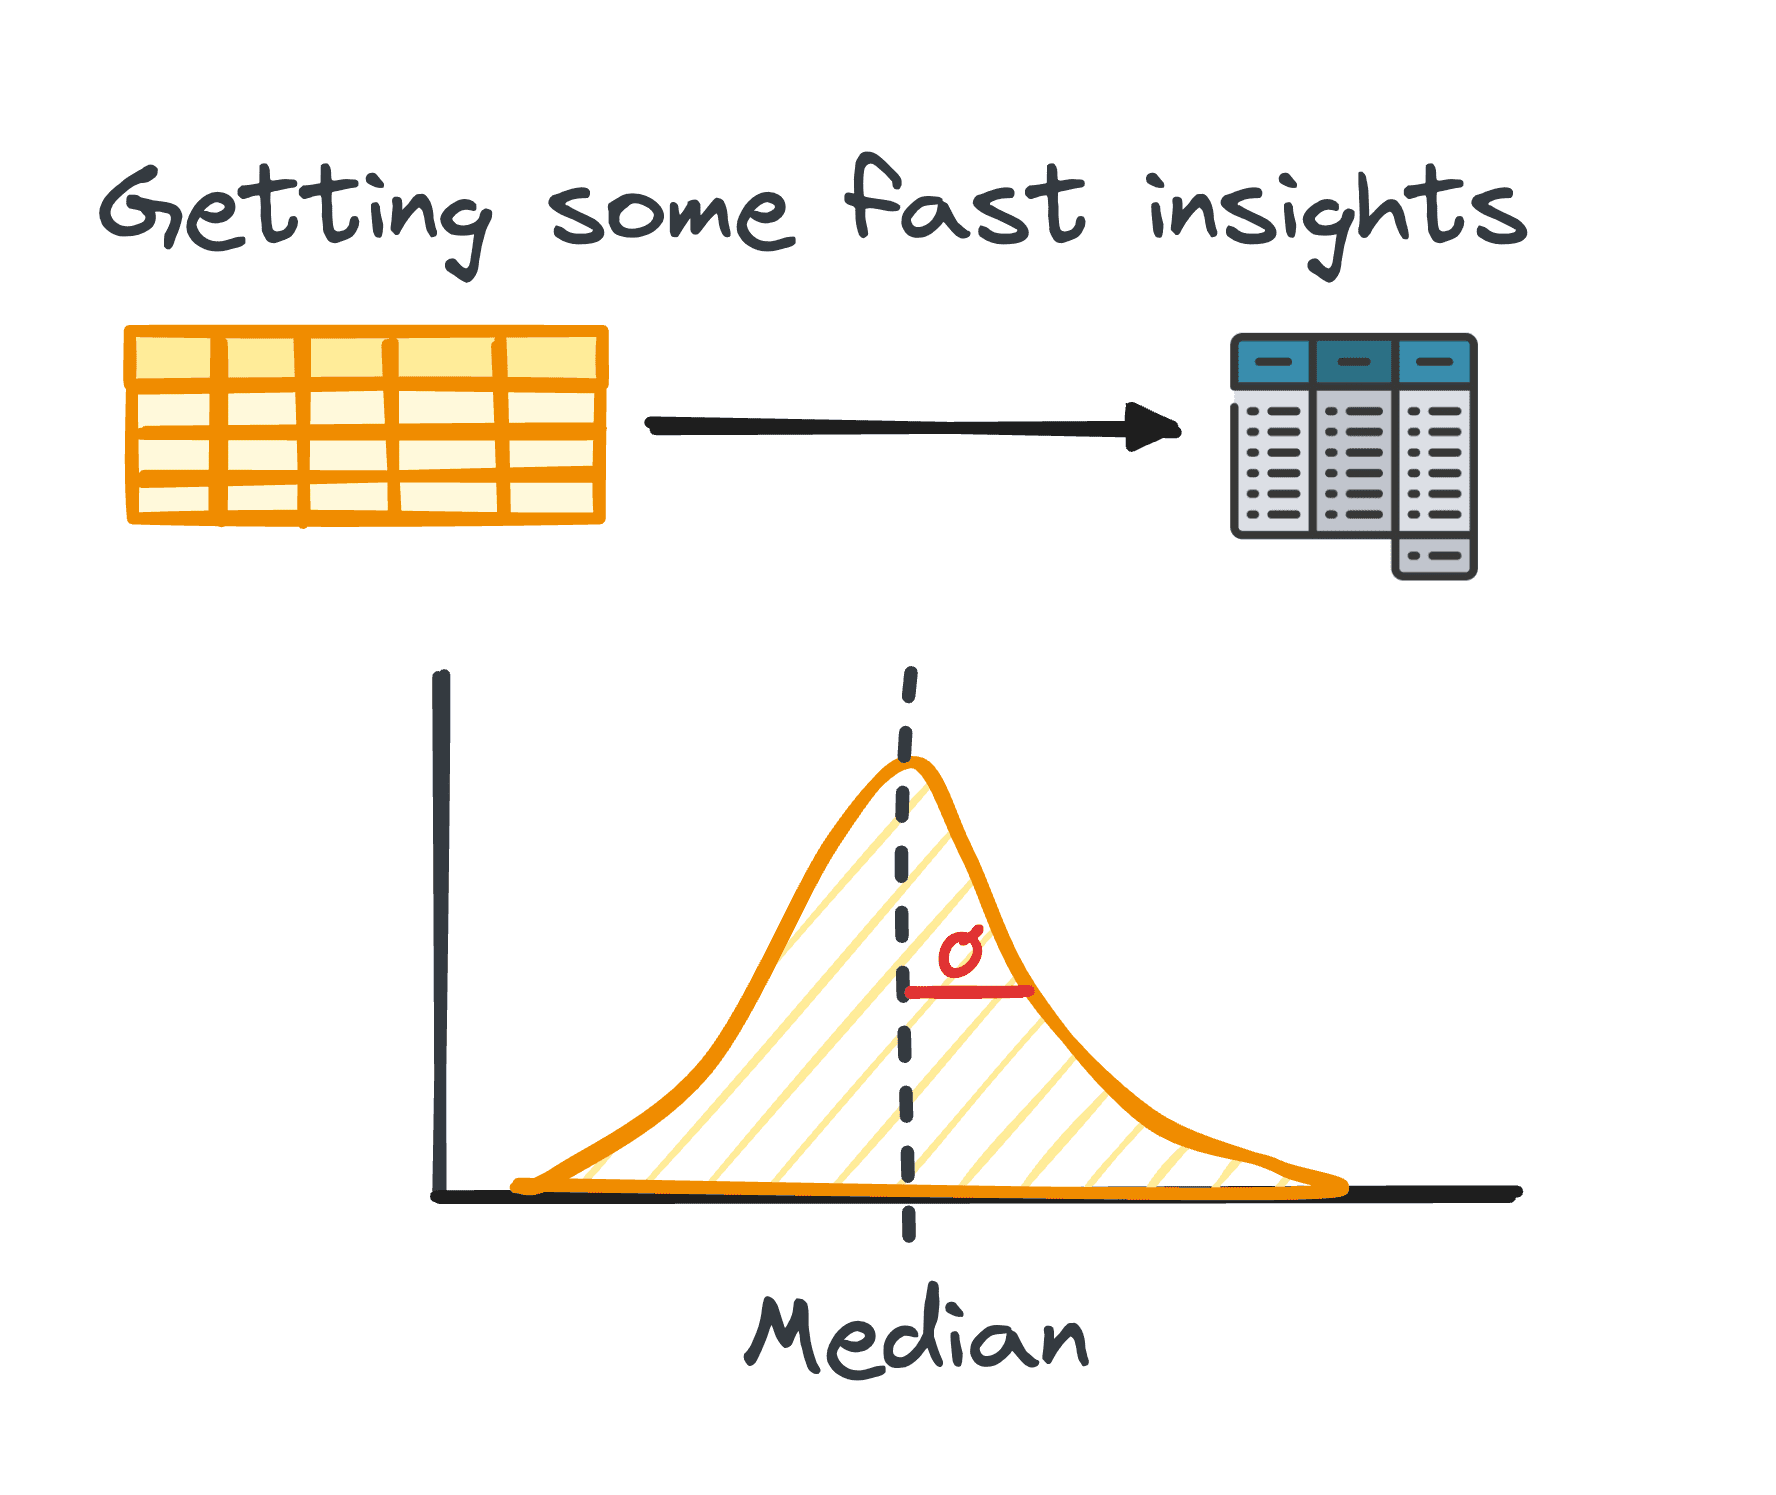
Image by Author
3. Preparing Data for EDA
Before starting our exploration, data usually needs to be prepared for further analysis. Data preparation involves transforming, aggregating, or cleaning data using Python’s pandas library to suit the needs of your analysis.
This step is tailored to the data’s structure and can include grouping, appending, merging, sorting, categorizing, and dealing with duplicates.
In Python, accomplishing this task is facilitated by the pandas library through its various modules.
The preparation process for tabular data doesn’t adhere to a universal method; instead, it’s shaped by the specific characteristics of our data, including its rows, columns, data types, and the values it contains.
4. Visualizing Data
Visualization is a core component of EDA, making complex relationships and trends within the dataset easily comprehensible.
Using the right charts can help us identify trends within a big dataset and find hidden patterns or outliers. Python offers different libraries for data visualization, including Matplotlib or Seaborn among others.
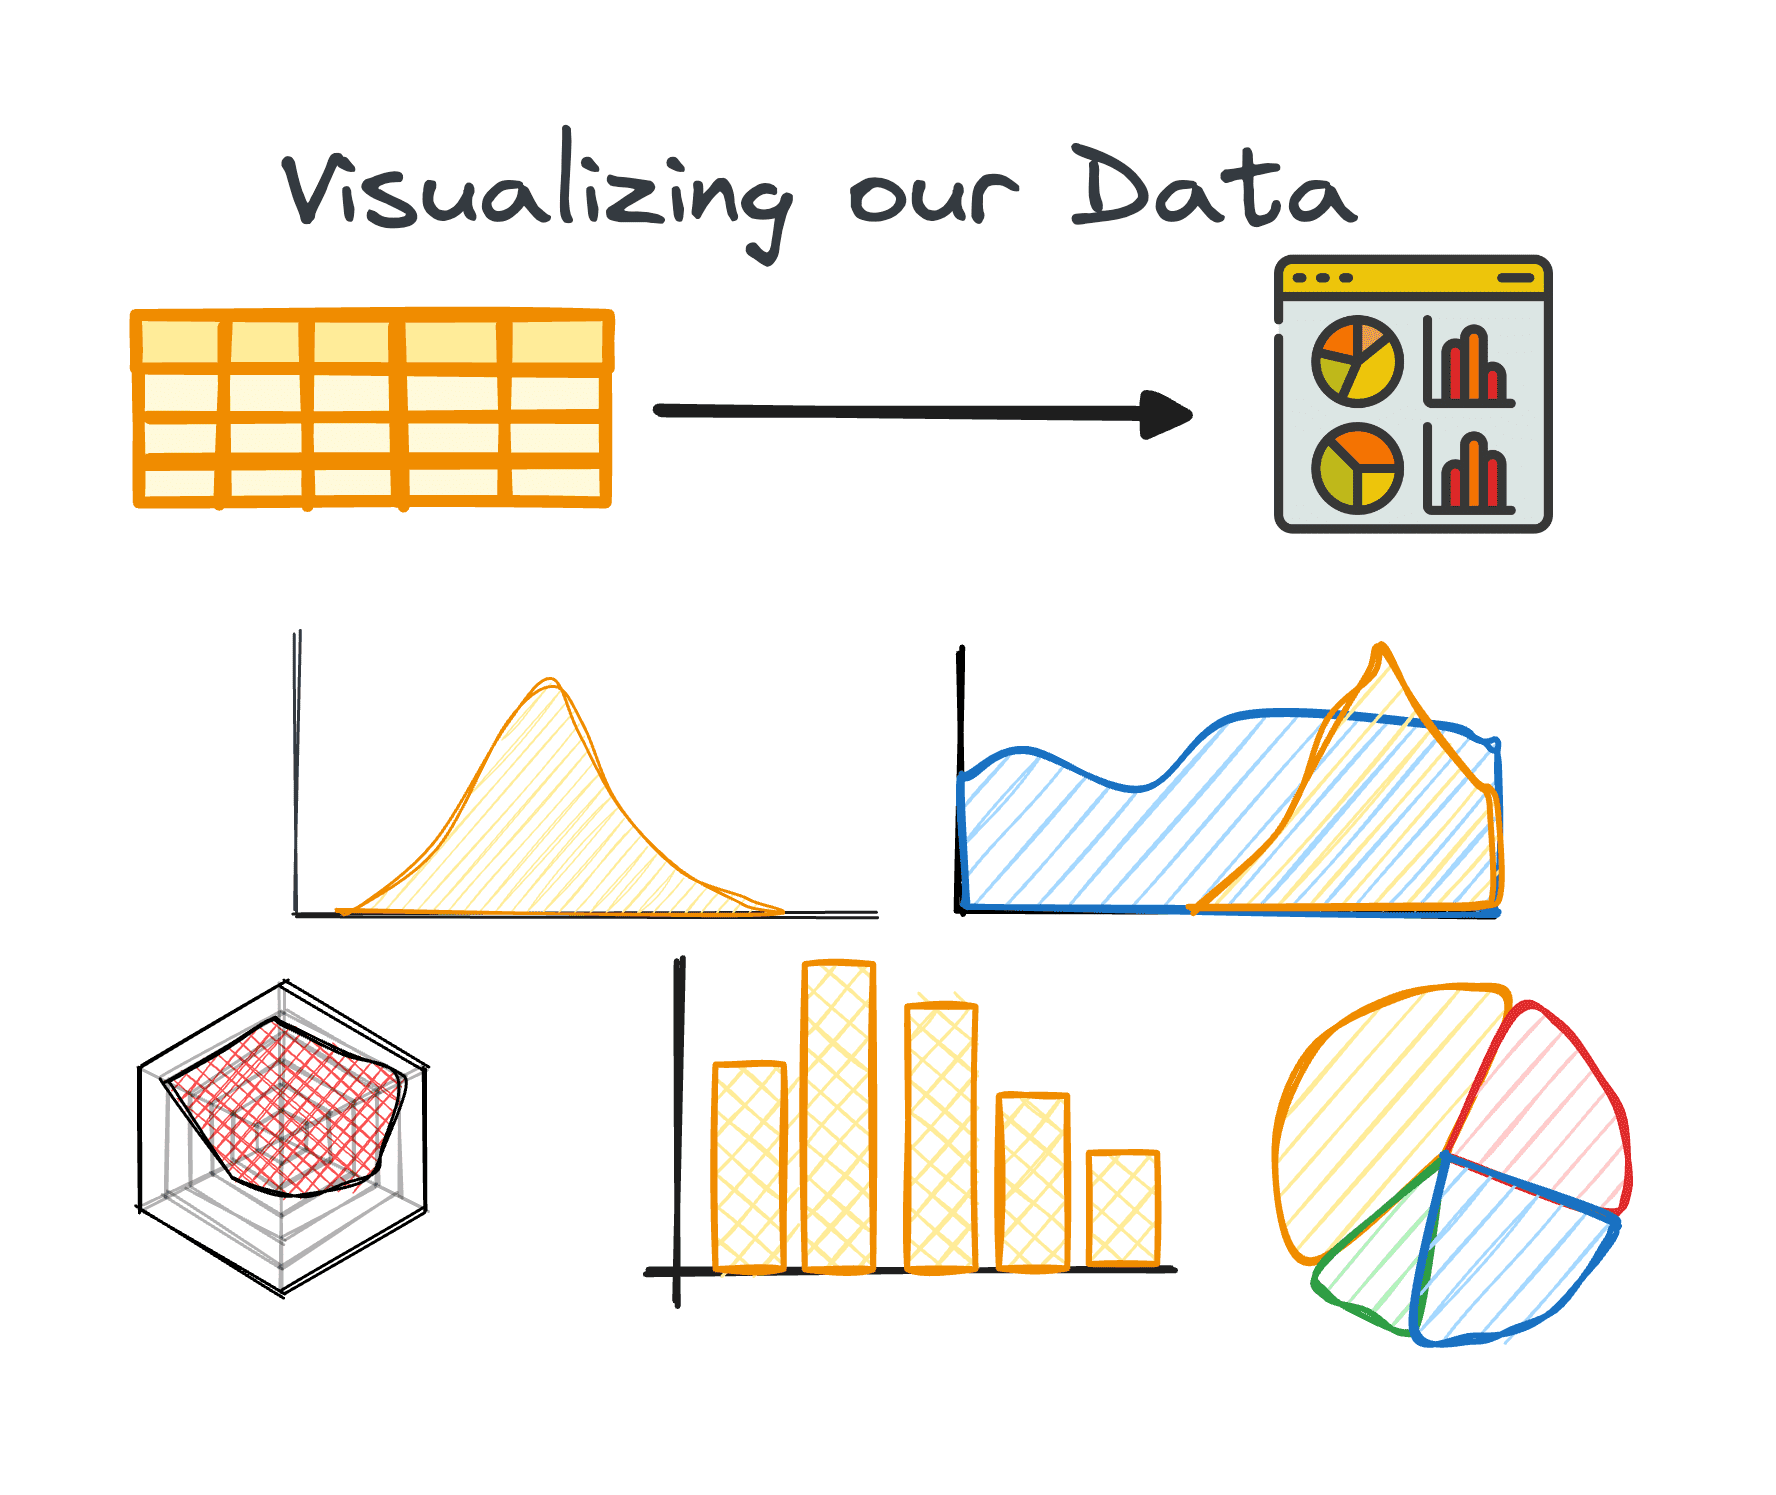
Image by Author
5. Performing Variable Analysis:
Variable analysis can be either univariate, bivariate, or multivariate. Each of them provides insights into the distribution and correlations between the dataset’s variables. Techniques vary depending on the number of variables analyzed:
Univariate
The main focus in univariate analysis is on examining each variable within our dataset on its own. During this analysis, we can uncover insights such as the median, mode, maximum, range, and outliers.
This type of analysis is applicable to both categorical and numerical variables.
Bivariate
Bivariate analysis aims to reveal insights between two chosen variables and focuses on understanding the distribution and relationship between these two variables.
As we analyze two variables at the same time, this type of analysis can be trickier. It can encompass three different pairs of variables: numerical-numerical, numerical-categorical, and categorical-categorical.
Multivariate
A frequent challenge with large datasets is the simultaneous analysis of multiple variables. Even though univariate and bivariate analysis methods offer valuable insights, this is usually not enough for analyzing datasets containing multiple variables (usually more than five).
This issue of managing high-dimensional data, usually referred to as the curse of dimensionality, is well-documented. Having a large number of variables can be advantageous as it allows the extraction of more insights. At the same time, this advantage can be against us due to the limited number of techniques available for analyzing or visualizing multiple variables concurrently.
6. Analyzing Time Series Data
This step focuses on the examination of data points collected over regular time intervals. Time series data applies to data that change over time. This basically means our dataset is composed of a group of data points that are recorded over regular time intervals.
When we analyze time series data, we can typically uncover patterns or trends that repeat over time and present a temporal seasonality. Key components of time series data include trends, seasonal variations, cyclical variations, and irregular variations or noise.
7. Dealing with Outliers and Missing Values
Outliers and missing values can skew analysis results if not properly addressed. This is why we should always consider a single phase to deal with them.
Identifying, removing, or replacing these data points is crucial for maintaining the integrity of the dataset’s analysis. Therefore, it is highly important to address them before start analyzing our data.
- Outliers are data points that present a significant deviation from the rest. They usually present unusually high or low values.
- Missing values are the absence of data points corresponding to a specific variable or observation.
A critical initial step in dealing with missing values and outliers is to understand why they are present in the dataset. This understanding often guides the selection of the most suitable method for addressing them. Additional factors to consider are the characteristics of the data and the specific analysis that will be conducted.
EDA not only enhances the dataset’s clarity but also enables data professionals to navigate the curse of dimensionality by providing strategies for managing datasets with numerous variables.
Through these meticulous steps, EDA with Python equips analysts with the tools necessary to extract meaningful insights from data, laying a solid foundation for all subsequent data analysis endeavors.
Josep Ferrer is an analytics engineer from Barcelona. He graduated in physics engineering and is currently working in the Data Science field applied to human mobility. He is a part-time content creator focused on data science and technology. You can contact him on LinkedIn, Twitter or Medium.
- SEO Powered Content & PR Distribution. Get Amplified Today.
- PlatoData.Network Vertical Generative Ai. Empower Yourself. Access Here.
- PlatoAiStream. Web3 Intelligence. Knowledge Amplified. Access Here.
- PlatoESG. Carbon, CleanTech, Energy, Environment, Solar, Waste Management. Access Here.
- PlatoHealth. Biotech and Clinical Trials Intelligence. Access Here.
- Source: https://www.kdnuggets.com/7-steps-to-mastering-exploratory-data-analysis?utm_source=rss&utm_medium=rss&utm_campaign=7-steps-to-mastering-exploratory-data-analysis

