In this strategy, we will be combining both price action trading and technical indicators. We will use the Zigzag indicator as a means to simplify our price action trading and identify the support and resistance trendlines that would form a channel. We will also be using the Stochastic Oscillator to spot when momentum has reversed for a more precise trade entry.
Trendlines and Channels
When trading based on price action, you would notice that price tends to oscillate up and down the price chart on pulses or waves. These price movements create peaks and dips. Some would call it pivot highs and pivot lows, while others call it swing highs and swing lows. In an uptrend market, these pivot highs and pivot lows tend to continually rise, while in a downtrend market, the pivot highs and pivot lows tend to continually drop.
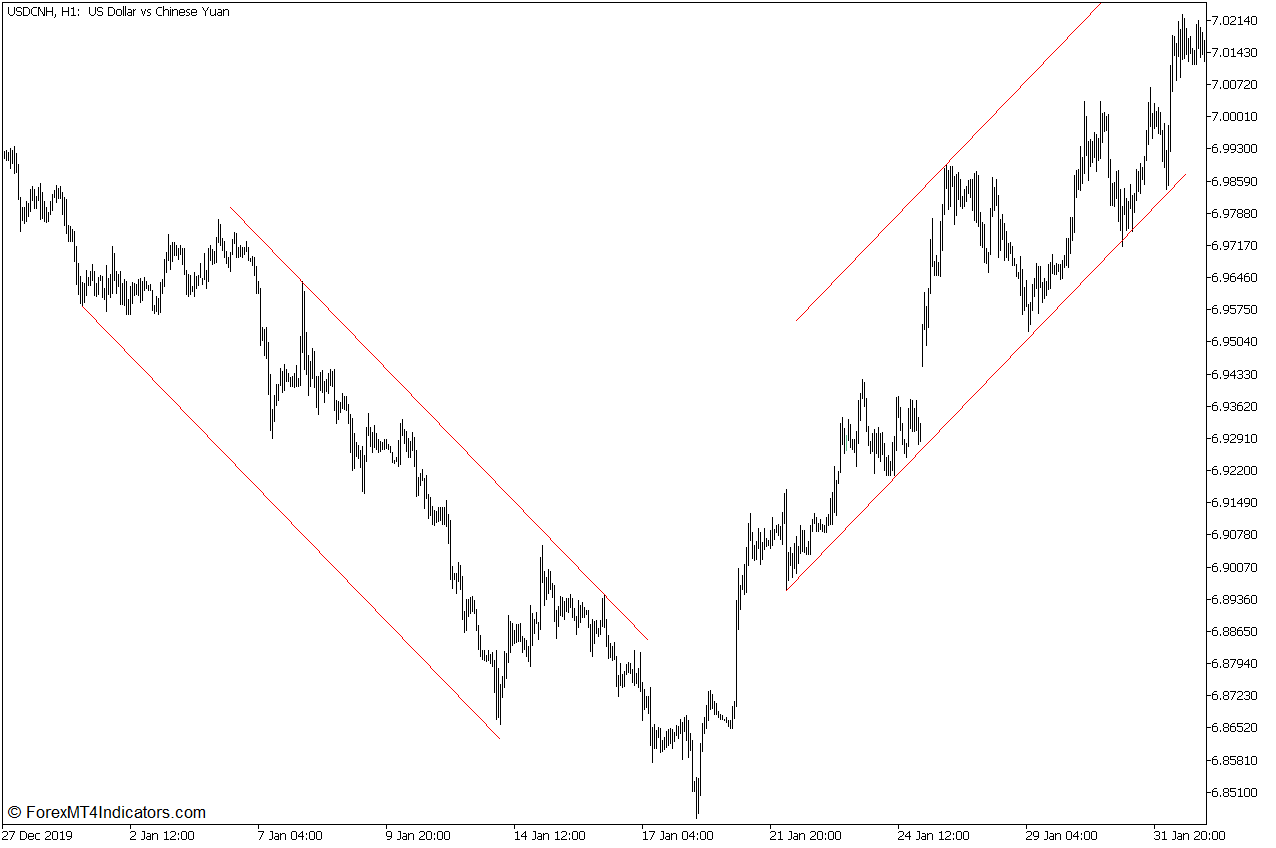
At times, the rise or drop of the pivot highs and lows in a trending market tend to be very consistent. They can be so consistent that you could draw a line connecting these pivot highs and pivot lows. These lines are what we call trendlines. These lines are visual markers of the support or resistance levels.
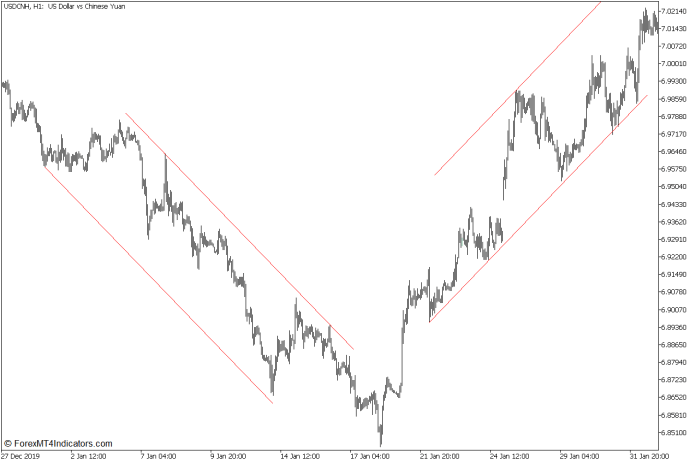
It is also not uncommon to have a clear support line and resistance line in a trending market which are somewhat parallel. These are what we call channels.
Zigzag Indicator for Identifying Pivot Highs and Pivot Lows
Trading based on price action trends and trendlines can be a very effective trading strategy. However, it could also be quite difficult for beginner traders because it could somehow be very subjective. Different traders would have different appreciations of the various pivot highs and pivot lows that could be observed on a price chart. On top of that traders would also have different opinions on where and how to plot a trendline. Trading based on price action trends and trendlines would require a lot of practice, screen time, and skill, all of which take time to develop.
There are ways we can simplify the process of trading based on price action and trendlines. One of which is with the use of a Zigzag indicator.
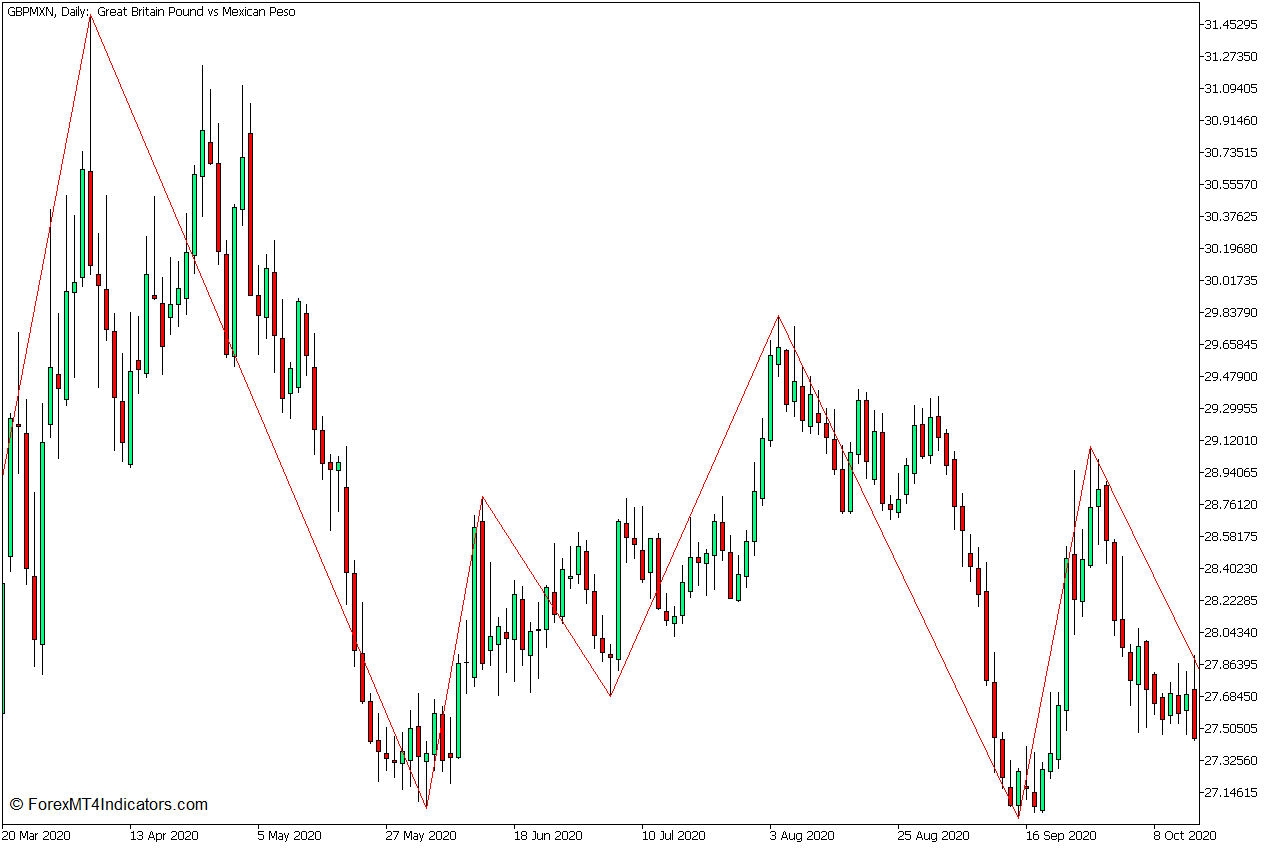
The Zigzag indicator is an indicator that automatically identifies pivot highs and pivot lows based on the deviation of price movements from a prior momentum direction and its corresponding depth. It then connects the pivot highs and pivot lows with a line creating a zigzag-like pattern. Thus it is called the Zigzag indicator.
Since the Zigzag indicator is primarily intended to help traders objectively identify pivot highs and pivot lows, it can also be used to identify trends and be used as a basis for plotting trendlines.
Traders can identify uptrends based on a consistently rising pivot high and pivot low based on the Zigzag indicator. Inversely, traders can also do the same for downtrends based on a dropping pivot high and pivot low pattern.
It can also be used to draw trendlines. Traders can plot resistance lines by connecting swing highs, and support lines by connecting swing lows.

Stochastic Oscillator
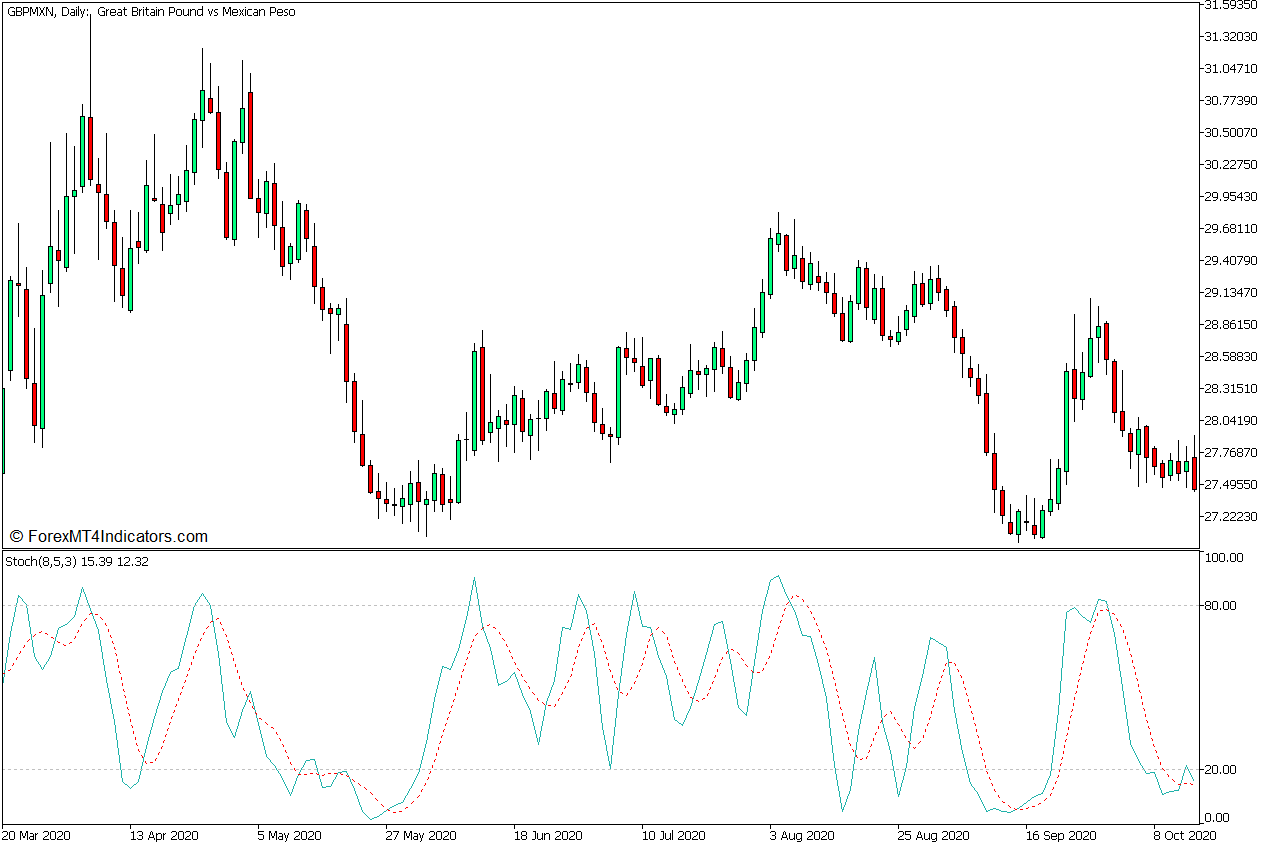
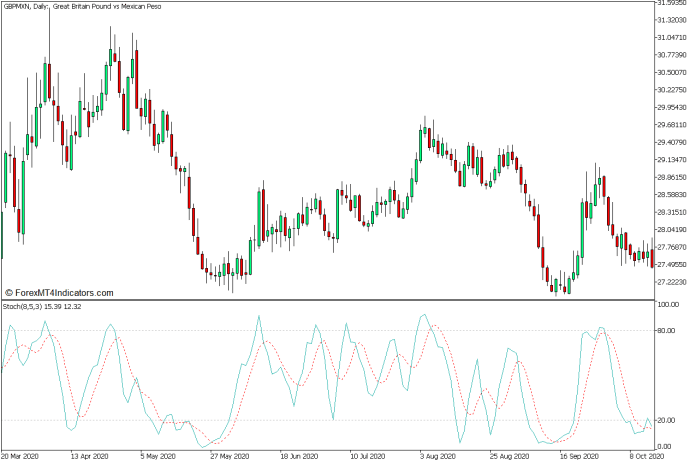
The Stochastic Oscillator is one of the more popular oscillator types of momentum indicator, which is often used to identify momentum direction, as well as oversold and overbought markets.
The Stochastic Oscillator plots two lines that crisscross each other based on an underlying stochastic computation. Momentum direction can be identified based on how the two lines crossover. It also has markers at 20 and 80. Crossovers occurring below 20 can be interpreted as a bullish mean reversal coming from an oversold price level. Crossovers above 80 indicate a bearish mean reversal coming from an overbought price level.
Trading Strategy Concept
This trading strategy is a channel-based trend-following strategy. It begins by identifying channels with the aid of the Zigzag Indicator. Traders can easily identify trendlines and channels by connecting the price action swing points and observing if the market is forming a channel.
Traders should then wait for the price to pull back on the support or resistance line as opposed to the direction of the trend or the slope of the channel. This should be accompanied by a Stochastic Oscillator line indicating an oversold or overbought market.
Price action should then show signs of price rejection on the support or resistance level and form a reversal candlestick pattern. The reversal signal is then confirmed by the crossing over of the Stochastic Oscillator lines in the direction of the trend.
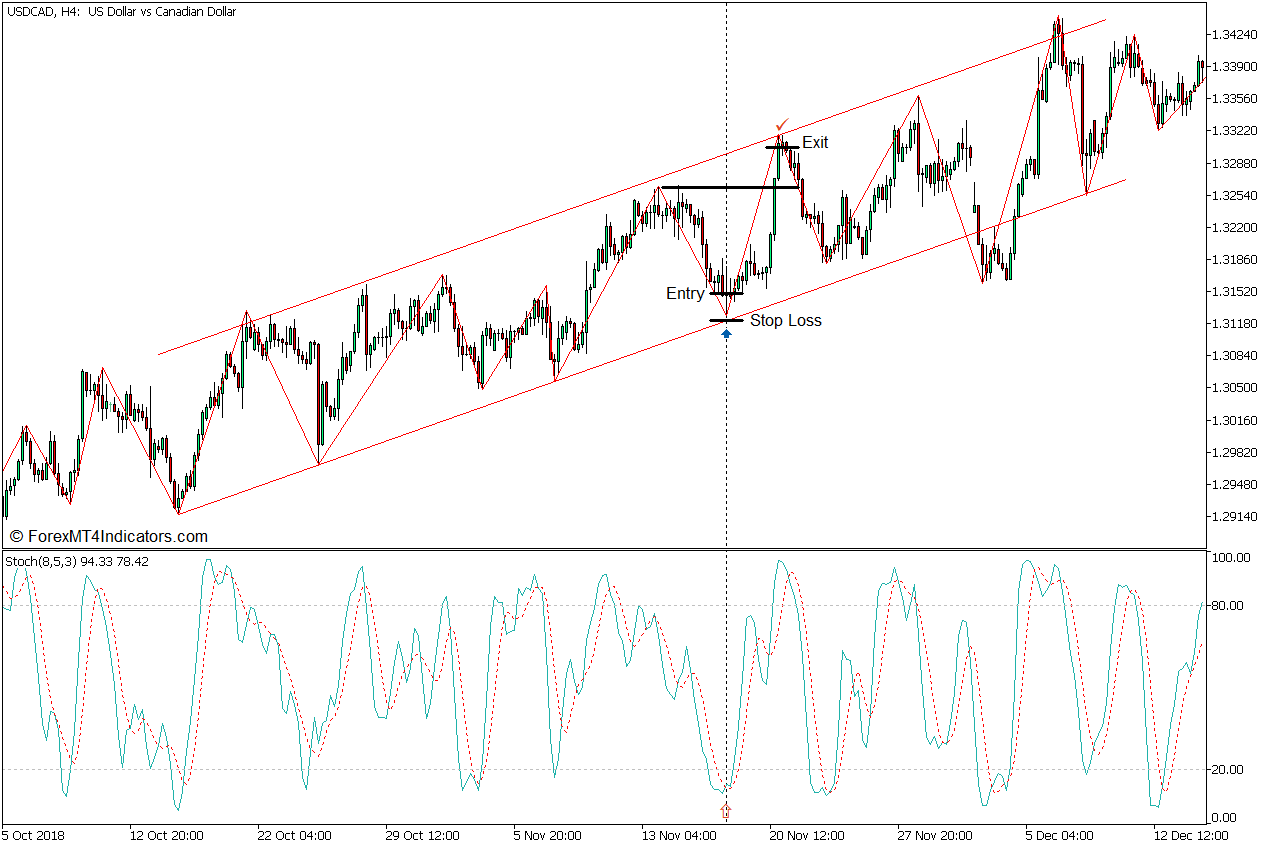
Buy Trade Setup
Entry
- A bullish trending market should be observable based on the pivot highs and lows.
- An uptrend channel should be formed when connecting the pivot lows and pivot highs.
- The price should retrace back to the support line of the channel and show signs of price rejection.
- The Stochastic Oscillator line should crossover coming from an oversold level.
- Enter a buy order on the confirmation of these conditions.
Stop Loss
- Set the stop loss below the support line.
Exit
- Allow the price to break above the last pivot high and close the trade on the first sign of price rejection.

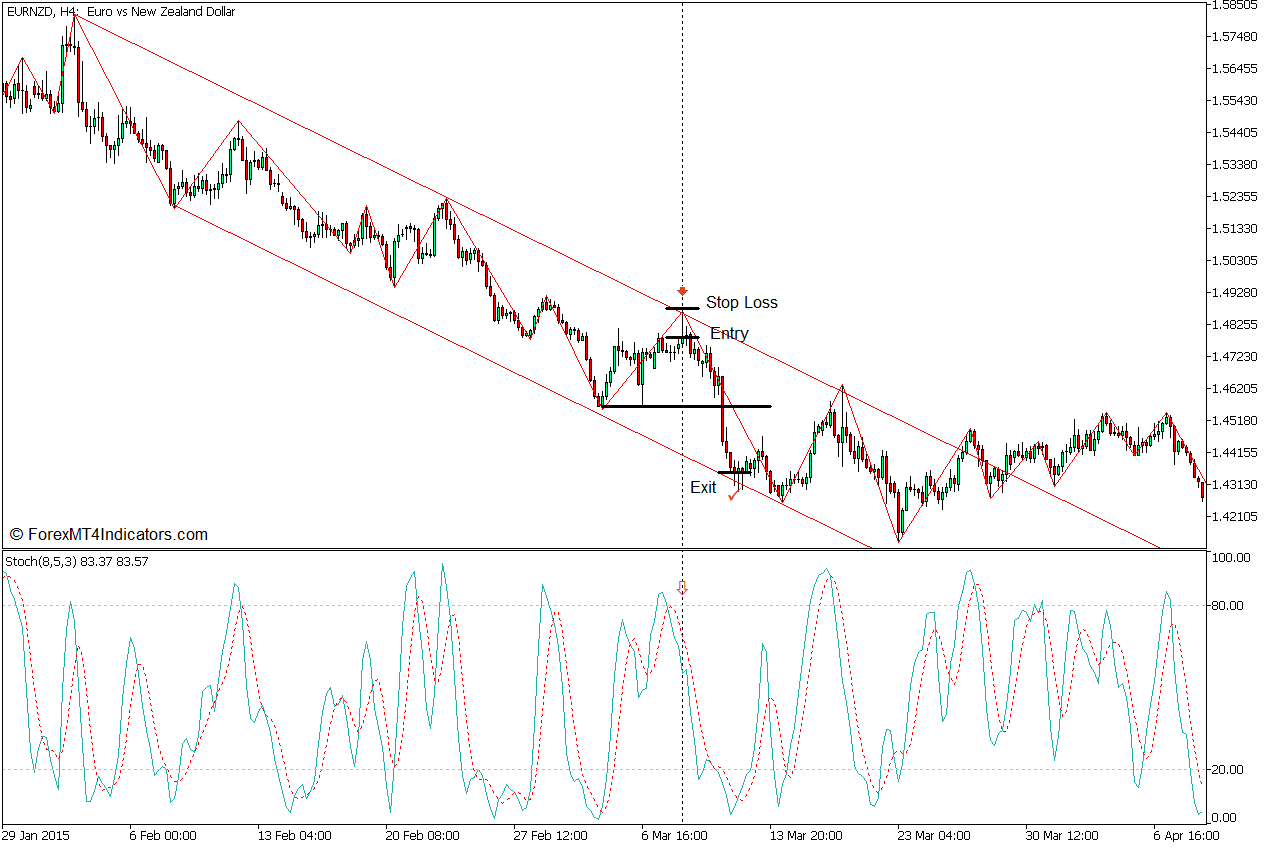
Sell Trade Setup
Entry
- A bearish trending market should be observable based on the pivot highs and lows.
- A downtrend channel should be formed when connecting the pivot lows and pivot highs.
- The price should retrace back to the resistance line of the channel and show signs of price rejection.
- The Stochastic Oscillator line should crossover coming from an overbought level.
- Enter a sell order on the confirmation of these conditions.
Stop Loss
- Set the stop loss above the resistance line.
Exit
- Allow the price to drop below the last pivot low and close the trade on the first sign of price rejection.

Conclusion
Trading based on reversals from support and resistance lines of a trend channel is a textbook price action strategy that many traders use. However, this strategy would require a lot of skill to master.
This strategy simplifies this classic price action strategy with the use of the Zigzag indicator and the Stochastic Oscillator.
Recommended MT5 Broker
- Free $50 To Start Trading Instantly! (Withdrawable Profit)
- Deposit Bonus up to $5,000
- Unlimited Loyalty Program
- Award Winning Forex Broker
- Additional Exclusive Bonuses Throughout The Year

>> Claim Your $50 Bonus Here <<
Click here below to download:
Save
Save
- SEO Powered Content & PR Distribution. Get Amplified Today.
- PlatoData.Network Vertical Generative Ai. Empower Yourself. Access Here.
- PlatoAiStream. Web3 Intelligence. Knowledge Amplified. Access Here.
- PlatoESG. Carbon, CleanTech, Energy, Environment, Solar, Waste Management. Access Here.
- PlatoHealth. Biotech and Clinical Trials Intelligence. Access Here.
- Source: https://www.forexmt4indicators.com/zigzag-channel-bounce-forex-trading-strategy-for-mt5/?utm_source=rss&utm_medium=rss&utm_campaign=zigzag-channel-bounce-forex-trading-strategy-for-mt5

