Yeast lacking the C-5 sterol desaturase Erg3 exhibit striking enhanced tolerance to escin
We hypothesised that if escin toxicity is mediated by direct interaction with ergosterol, then ergosterol biosynthesis mutants may differ in escin tolerance. Sterols are considered to have a key role in maintaining homeostasis of plasma membrane dynamics28, however yeast strains lacking enzymes which catalyse the final five steps in ergosterol biosynthesis (Erg2, Erg3, Erg4, Erg5 or Erg6; Figs. 1b and S1) are viable. Due to the substrate promiscuity of the latter enzymes in ergosterol biosynthesis, these deletion mutants accumulate a mixture of sterol structures, which differ from ergosterol in the number and position of double bonds in the sterol B-ring, and the sterol side chain29. We used microplate cultures of the wild type strain BY4741 (WT) and mutants from the Yeast Deletion Collection30, to assess growth of the ergosterol biosynthesis mutants in complex rich medium (YPD) in the presence and absence of escin (Fig. 1c). Sterol extraction and analysis by Gas Chromatography–Mass Spectrometry verified that ergosterol did not accumulate in the mutant strains (Figs. S2 and S3). The Minimum Inhibitory Concentration (MIC) of escin for the WT strain in YPD medium was 150 µg/mL. Similar MICs were observed for the erg2Δ, erg4Δ, erg5Δ and erg6Δ strains, however growth of the erg3Δ strain was uninhibited up to the highest concentration tested (1000 µg/mL; Fig. S4).
Transcriptome analysis
In order to further explore the impact of escin on WT cells, and the mechanism of escin tolerance in erg3Δ, we analysed the transcriptomes of WT, erg3Δ and erg6Δ cells, treated with 0 or 100 µg/mL escin in YPD for 1 h, in shake flask cultures. The erg6Δ strain was included in this experiment as this strain shares many similar phenotypes with erg3Δ29, but does not have enhanced escin tolerance (MIC 150 µg/mL; Fig. 1c). Within the scope of this experiment, we also analysed the transcriptomes of erg3Δ and erg6Δ cells which were treated with 75 µg/mL escin for 1 h.
K means clustering of the 2000 genes with the most variable expression levels is shown in Fig. S5, with full details of gene set enrichment analysis included in the Supplementary Information (SI). Cluster B genes (n = 82) are in general expressed at a higher level in erg3Δ and erg6Δ compared to WT under all conditions and, as anticipated, this cluster is enriched in genes relating to sterol biosynthesis, sterol transport, siderophore transport, and regulation of transcription by glucose. Cluster A genes (n = 821) are downregulated in WT and erg6Δ in response to escin treatment. This cluster is enriched in genes relating to ribosome biogenesis and RNA processing. Cluster C (n = 897) and D (n = 200) genes are in general upregulated in WT and erg6Δ in response to escin treatment, with cluster D genes upregulated to a greater extent than cluster C. Cluster D is enriched in genes relating to trehalose, mannose, fructose and glutamate metabolism, as well as glycolysis and cell wall organisation. Cluster D is also enriched in genes associated with responses to osmotic, oxidative, temperature and starvation stress. Cluster C is enriched in genes relating to late nucleophagy, lipid catabolism, sulphur assimilation, the tricarboxylic acid cycle and gluconeogenesis.
Differentially Expressed Genes (DEGs) with ≥ 2-fold differential expression between conditions of interest (Fig. 2) are discussed in more detail below, with full gene set enrichment details in SI.
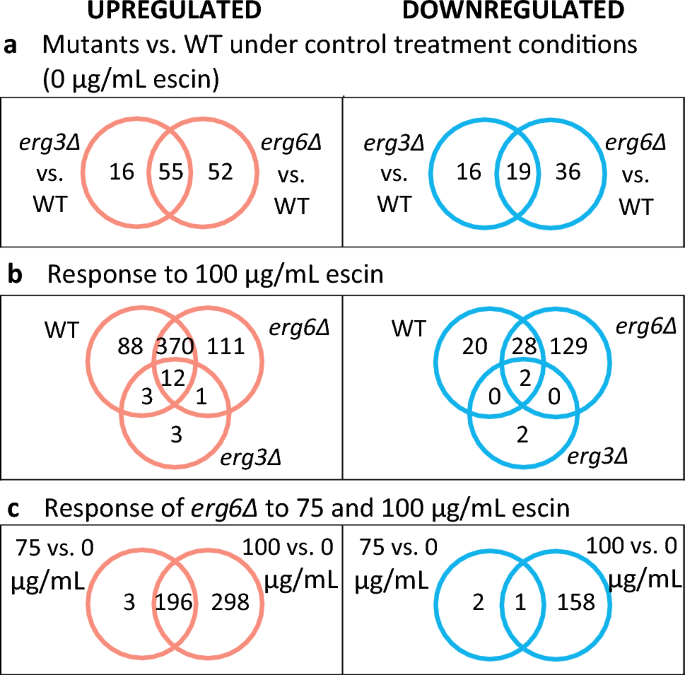
Venn diagrams for Differentially Expressed Genes (DEGs). DEGs have ≥ 2-fold differential expression, and a False Discovery Rate (FDR) ≤ 0.1.
Impact of ERG3 and ERG6 deletion on the yeast transcriptome
Comparing the transcriptomes of strains under control conditions reveals interesting differences between the mutant strains and WT. Deletion of ERG6 results in a greater number of DEGs (n = 162) than ERG3 deletion (n = 106). In both mutants, upregulated DEGs are enriched in genes relating to sterol biosynthesis and transport, including the sterol sensor and transcriptional activator UPC2 (Fig. S6). In contrast, only a very small number of genes involved in sphingolipid and phospholipid supply are upregulated (YSR3, RSB1, FAA2 and ELO2 in both strains, and additionally SUR1 in erg6Δ; Fig. S7), although large changes in sphingolipid composition have been reported for sterol biosynthesis mutants31.
Anaerobic response cell wall mannoprotein genes are also highly upregulated in both strains (Fig. S8). Several steps of ergosterol biosynthesis require oxygen and iron as cofactors, and there is complex crosstalk between the regulatory responses to ergosterol, oxygen and iron32,33,34,35. A number of iron starvation response genes36 are upregulated in erg6Δ (FIT2, FIT3, ARN2, SIT1, TIS11), but not erg3Δ, relative to WT (Fig. 3a). It has recently been reported that the iron-sensing transcription factor Aft1, which usually shuttles between the cytoplasm and nucleus, accumulates in the vacuoles of ergosterol-diminished upc2Δ cells37. Our data suggests that this signalling pathway may be impacted to differing extents in erg6Δ and erg3Δ.
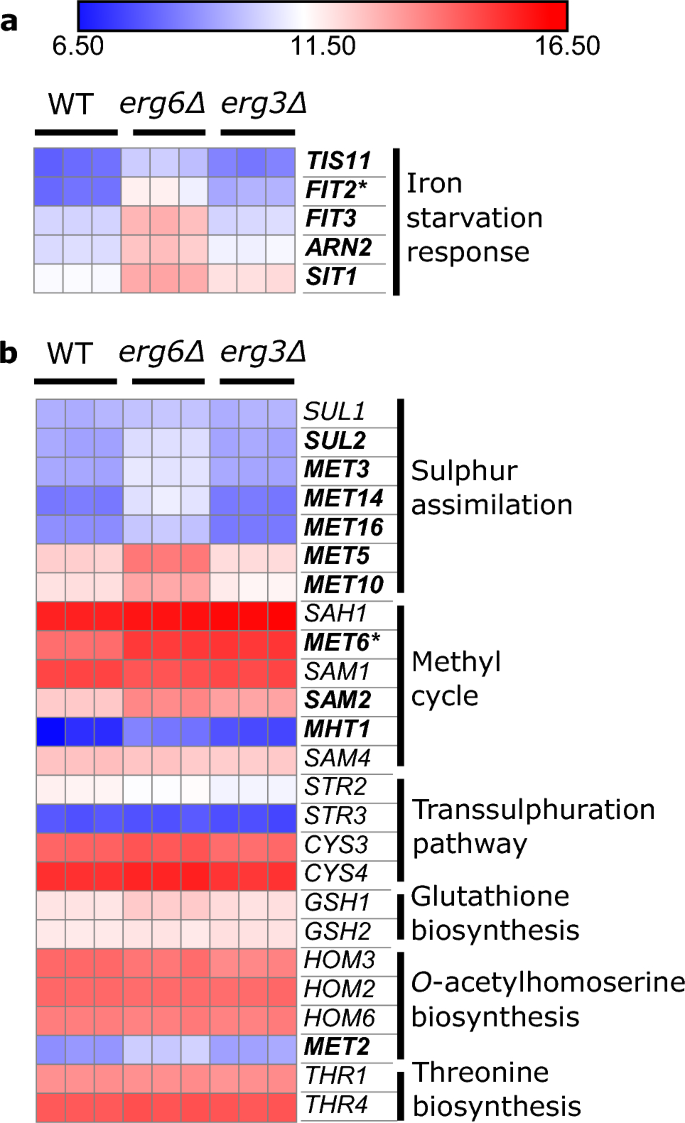
The erg6Δ strain exhibits elevated expression of sulphur assimilation genes and iron starvation response genes. Expression of genes relating to (a), iron homeostasis and (b), the methionine biosynthesis pathway, under control conditions, units log2(CPM + 4). Bold; gene upregulated ≥ 2-fold in erg6Δ versus WT. Asterisk; gene upregulated ≥ 2-fold in erg3Δ versus WT (FDR ≤ 0.1).
Methionine metabolism genes are also upregulated in erg6Δ, but not erg3Δ (Fig. 3b). Specifically, the upregulated genes are associated with the sulphur assimilation pathway (SUL2, MET3, MET14, MET16, MET5, MET10), and the methyl cycle (MET6, SAM2, MHT1) which generates S-adenosylmethionine (SAM) (Fig. S9). The Erg6 enzyme uses the methyl donor SAM to methylate zymosterol38, and an Erg6–deficient strain has previously been found to accumulate SAM, which was attributed to reduced SAM consumption39.
Both strains downregulate a number of genes involved in mating (Fig. 4). These are mainly genes which are involved in conjugation between mating schmoo tips (FUS1, AGA1, AGA2, FIG1, SHC1), and notably reduced mating efficiency has previously been described for ergosterol biosynthesis mutants40,41.
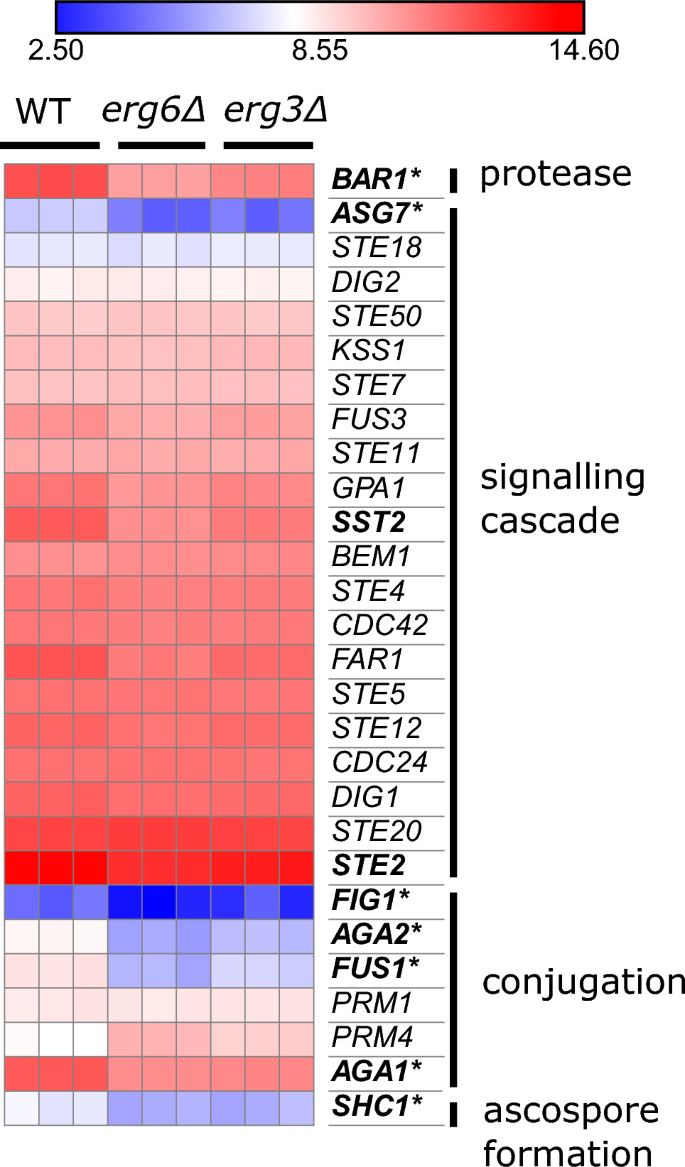
The erg3Δ and erg6Δ strains exhibit reduced expression of mating genes. Expression of genes relating to mating, units log2(CPM + 4). Bold; downregulated ≥ 2-fold in the comparison erg6Δ 0 µg/mL escin versus WT 0 µg/mL escin. Asterisk; downregulated ≥ 2-fold in the comparisons erg3Δ 0 µg/mL escin versus WT 0 µg/mL escin (FDR ≤ 0.1).
Both strains also express NCE102 at a lower level than WT (42% of WT level in erg3Δ, and 40% of WT level in erg6Δ). Although primarily localised at plasma membrane eisosomes, Nce102 has recently been reported to have a role in vacuole fusion42, and vacuoles are highly fragmented in many ergosterol biosynthesis mutant strains, including erg3Δ, although not erg6Δ43,44,45.
It is notable that several DEGs between the mutants and WT are of unknown function; 20 and 29 upregulated DEGs, and 10 and 13 downregulated DEGs, in erg3Δ and erg6Δ respectively.
Transcriptome responses to escin treatment
In response to 100 µg/mL escin, the WT and erg6Δ strains upregulate 473 and 494 genes, respectively (Fig. 2b). These DEGs are enriched in genes which are also associated with responses to desiccation, osmotic stress, oxidative stress, temperature, chemical treatment and changes in nutrient levels (SI). Treatment of erg6Δ cells with 75 µg/mL escin resulted in upregulation of 199 genes (Fig. 2c). These 199 DEGs are enriched in genes which are associated with responses to oxidative stress, chemical stress and starvation (SI).
The impact of escin treatment on central carbon metabolism genes is shown in Fig. S10. In response to 100 μg/mL escin, both WT and erg6Δ strongly upregulate genes relating to the biosynthesis of trehalose, glycogen and glycerol. The glucose polymer glycogen is considered to primarily function as a storage carbohydrate, which has little impact on the internal osmotic pressure of the cell46,47. The disaccharide trehalose is considered to have a key role in protecting the structure of lipid membranes and proteins, by displacing water from lipid bilayers and protein surfaces, and preventing aggregation of denatured proteins which would prevent their subsequent refolding47. Glycerol acts as a key osmolyte during hyperosmotic stress, and forms the backbone of phospholipids and storage lipid triacylglycerols48. The upregulation of trehalose, glycogen and glycerol biosynthesis is part of a general response to environmental change47,48,49. Additionally, both WT and erg6Δ strains upregulate genes encoding proteins of the Glucose Induced degradation Deficient (GID) complex, which negatively regulates gluconeogenesis, in favour of glycolysis, by initiating polyubiquitination and degradation of fructose-1,6-bisphosphatase50 (Fig. S11).
In response to 100 μg/mL escin, both WT and erg6Δ also upregulate genes encoding enzymes of the γ-aminobutyric acid (GABA) shunt pathway (Fig. S12) which degrades glutamate via GABA. In yeast, this pathway has been shown to be important for heat and oxidative stress tolerance51.
The upregulated DEGs are also enriched in genes relating to cell wall organisation, including sporulation and chitin biosynthesis (Fig. S13). Crosstalk between the High Osmolarity Glycerol 1 (Hog1) and Cell Wall Integrity (CWI) mitogen-activated protein kinase (MAPK) pathways mean that it is difficult to dissect specific stresses which are initiating the upregulation of these genes, without utilising mutants which are defective in specific branches of these signalling pathways52,53,54.
Many autophagy-related genes are upregulated in WT and erg6Δ in response to escin treatment (Fig. S14), including core phagosome components, and proteins involved in the cytoplasm-to-vacuole pathway, which selectively delivers hydrolases to the vacuole55. In response to 100 μg/mL escin, more autophagy-related genes are upregulated ≥ 2-fold in the erg6Δ strain than WT (11 vs. 7).
The erg6Δ strain also downregulates more genes than WT in response to 100 μg/mL escin (159 vs. 50), and these DEGs are enriched in genes relating to ribosome biogenesis and translation. These processes require substantial amounts of energy56, and their downregulation is part of a general stress response, in which resources are diverted to stress resistance rather than cell proliferation57,58.
If escin sequestered ergosterol from cells, or inhibited sterol sensing by interaction with either ergosterol or a sterol sensor, then we might expect to see a transcriptional change in sterol biosynthesis genes such as ERG2 and ERG11 in response to escin treatment. These genes are regulated by the sterol sensors and transcriptional activators Upc2 and Ecm22, in response to ergosterol content59,60. Differential expression of ergosterol biosynthesis genes is not observed (Fig. S6), although there is statistically significant but small upregulation of UPC2 in each strain (1.3, 1.9 and 1.5-fold for WT, erg6Δ and erg3Δ respectively). A small number of genes related to sphingolipid supply are upregulated in response to escin in WT and erg6Δ (Fig. S7), although it should be noted that much of sphingolipid regulation is post-translational31.
In contrast to the large transcriptome changes observed for the WT and erg6Δ strains, the erg3Δ strain upregulates only 19 genes in response to 100 µg/mL escin, and downregulates 4 (Fig. S15). Most of these DEGs are also differentially expressed in the WT and/or erg6Δ strain in response to escin treatment, with the exception of HAP4 (encoding a regulator of respiration), YOL163W (considered non-functional), YGL088W (unknown function) and the cell wall mannoprotein genes DAN1 and DAN4.
The erg3Δ transcriptome is not primed for the stress of escin treatment
In order to explore whether the escin response DEGs in the WT strain are already differentially expressed in erg3Δ under control conditions, potentially ‘priming’ erg3Δ for the stress of escin treatment, we compared DEGs in the comparisons WT 100 versus 0 µg/mL escin, and erg3Δ 0 µg/mL escin versus WT 0 µg/mL escin (Fig. S16a). Under control conditions, the erg3Δ strain has elevated expression of 18 genes which are also upregulated in WT in response to escin treatment, and lower expression of 5 genes which are downregulated in WT in response to escin treatment. A heatmap showing the expression levels of these overlapping genes is included in Fig. S16b. The majority of these genes are also differentially regulated in the erg6Δ strain under control conditions, and the erg6Δ strain does not exhibit the enhanced escin tolerance phenotype. The exceptions are PAI3 (encoding a cytoplasmic proteinase A inhibitor), SRL3 (encoding a cell cycle regulator), HED1 (encoding a meiosis-specific protein), MAL31 (encoding a maltose permease), ARG3 (encoding ornithine carbamoyltransferase), COS111 (encoding a mitochondrial protein), genes YBR090C and YKR075C of unknown function, and genes YJR037W and YJL195C which are unlikely to encode functional proteins.
Overall, this data shows that escin has no impact on growth and a negligible impact on the transcriptome of erg3Δ cells. This is not likely to be due to erg3Δ cells being already primed for the stresses induced by escin treatment, and is potentially attributable to the chemical composition of its membrane sterols.
Pre-mixing escin with ergosterol, but not brassicasterol, prevents escin-mediated growth inhibition
In order to explore the hypothesis that escin mediates toxicity by directly interacting with ergosterol, but not the altered sterols present in erg3Δ, we assessed the impact of treating WT cells with escin alone, or escin which had been pre-mixed with ergosterol in a 1:1 molar ratio. It was considered that if ergosterol interacts directly with escin, then an escin-ergosterol mixture would have reduced impact on WT growth than escin alone, due to reduced accessibility of the escin saponins. Notably, yeast cells do not import exogenous sterols under aerobic conditions37.
The experiment was carried out using microplate cultures and complete supplement mixture (CSM) media, as opposed to YPD, as the exact content of CSM is defined, whereas YPD is a rich media containing complex molecules from yeast extract, which may also interact with escin and/or sterols. Previous studies have reported ergosta-7,22-dienol to be the predominant sterol in yeast lacking Erg3, with episterol and ergosta-7-enol also accumulating31,43. When sterol content was verified by Gas Chromatography-Mass Spectrometry (Figs. S2 and S3), the relative retention time of the largest sterol peak in the erg3Δ Total Ion Chromatogram corresponded to previous reports for ergosta-7,22-dienol, when the strain was grown in either YPD or CSM.
The MIC of escin in CSM media was determined to be 63 μg/mL for WT cells (Fig. 5b); 2.4-fold lower than in YPD. Meanwhile growth of the erg3Δ strain was uninhibited up to the highest concentration tested (500 μg/mL). When escin was pre-mixed with ergosterol in a 1:1 molar ratio, and the mixture added to cells, growth of the WT strain in the presence of 63 μg/mL escin was completely restored (Fig. 5c). Pre-mixing escin with ergosterol also restored the percentage of cells stained with the membrane impermeable dye propidium iodide to control treatment levels (Fig. S17), indicating decreased cell permeability and/or increased cell viability.
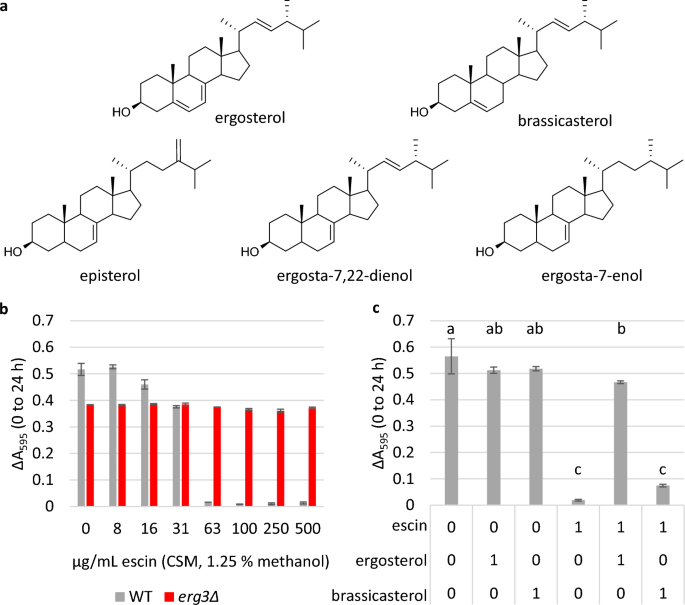
Restoration of growth when escin is pre-mixed with ergosterol, but not brassicasterol. (a) Structure of ergosterol (the predominant sterol in S. cerevisiae plasma membrane), brassicasterol (a plant sterol), and sterols which have been identified as accumulating in the erg3Δ strain (episterol, ergosta-7,22-dienol, ergosta-7-enol). (b) and (c), Growth in microplate cultures indicated by ΔA595 (0–24 h). Three biological replicates ± standard deviation (SD). In (b), the MIC of escin in CSM media is 63 μg/mL for WT, which is 2.4-fold lower than in rich complex medium. In (c), WT cells were grown in the presence of 0 or 63 μg/mL escin (1.25% methanol), alone or pre-mixed with ergosterol or brassicasterol in a 1:1 molar ratio. Ergosterol and brassicasterol only controls were included. Statistics: one-way ANOVA with post-hoc Tukey HSD test, conditions not connected by the same letter are significantly different (p ≤ 0.05).
The sterols present in erg3Δ are of limited availability, and so for comparison we also assessed growth when escin was pre-mixed with the phytosterol brassicasterol, which also has one double bond in the B-ring, although the position of this is between C-5 and C-6 (Fig. 5a). In contrast to the restored growth observed when escin was pre-mixed with ergosterol, restoration of WT growth was not observed when escin was pre-mixed with brassicasterol in a 1:1 molar ratio (Fig. 5c).
This supports the hypotheses that escin interacts directly with ergosterol, and that small changes in sterol structure can have a large impact on the strength of sterol-saponin interactions.
- SEO Powered Content & PR Distribution. Get Amplified Today.
- PlatoData.Network Vertical Generative Ai. Empower Yourself. Access Here.
- PlatoAiStream. Web3 Intelligence. Knowledge Amplified. Access Here.
- PlatoESG. Automotive / EVs, Carbon, CleanTech, Energy, Environment, Solar, Waste Management. Access Here.
- PlatoHealth. Biotech and Clinical Trials Intelligence. Access Here.
- ChartPrime. Elevate your Trading Game with ChartPrime. Access Here.
- BlockOffsets. Modernizing Environmental Offset Ownership. Access Here.
- Source: https://www.nature.com/articles/s41598-023-40308-0

